Licenciada
Production and Characterization of Chitin-Glucan
Complex by Komagataella pastoris
Dissertação para obtenção do Grau de Doutor em Engenharia Química e Bioquímica
Orientadora: Professora Doutora Maria d´Ascensão C. F.
Miranda Reis, Faculdade de Ciências e Tecnologia da
Universidade Nova de Lisboa
Co-orientadora: Doutora Maria Filomena Andrade de Freitas,
Faculdade de Ciências e Tecnologia da Universidade Nova de
Lisboa
Júri:
Presidente: Professor Doutor José Paulo Barbosa Mota
Arguentes: Professora Doutora Ana Maria Barreto Xavier
Luís António Paulino Passarinha
Vogais: Doutora Maria Teresa Ferreira Cesário Smolders
Engenheiro António Pereira da Cunha
Production and Characterization of
Chitin-Glucan Complex by
Komagataella pastoris
By
Bárbara Chagas
Dissertação para obtenção do Grau de Doutor em Engenharia Química e Bioquímica
Production and Characterization of Chitin-Glucan Complex by Komagataella pastoris
Copyright © Bárbara Ferreira Chagas, Faculdade de Ciências e Tecnologia, Universidade Nova de Lisboa.
Em primeiro lugar, gostaria de agradecer à minha orientadora, Professora Maria Ascensão Reis, pela orientação e a oportunidade de realizar esse trabalho.
À minha co-orientadora Dra. Filomena Freitas um muito obrigada! Sem ela nada teria sido possível. Obrigada pela disponibilidade, pelas suas valiosas sugestões que muito enriqueceu este trabalho, por todas as discussões motivantes, por toda a partilha de conhecimento e acima de tudo por acompanhar todo o trabalho de noite e de dia, de uma maneira muito gentil!
À Inês Farinha e à Diana Araújo, quero agradecer por toda a ajuda no trabalho laboratorial. À Professora Ana Ramos (LAQV-REQUIMTE, FCT-UNL) e ao Professor Vítor Alves (LEAF – Linking Environment, Agriculture and Food, Instituto Superior de Agronomia, Universidade de Lisboa), um muito obrigado por toda simpatia e contribuição.
Ao Dr. Luís Mafra da CICECO, Universidade de Aveiro, quero agradecer pelo seu especial contributo e disponibilidade para efetuar as análises de espectroscopia de ressonância magnética nuclear (RMN).
A todos os colegas que fazem e fizeram parte da equipa do BIOENG, obrigado pela constante troca de experiências.
À Fundação para a Ciência e Tecnologia pela concessão da bolsa.
Agradeço à SGC Energia – Biovegetal – o fornecimento do glicerol (subproduto do biodiesel). Às minhas amigas, Márcia Delgado e Patrícia Marques, muito obrigado por toda a cumplicidade, por me terem sempre incentivado, apoiado e entenderam sempre as minhas decisões.
Às minhas filhas, Madalena e Francisca, e ao meu marido, Ricardo, obrigado de uma maneira muito especial. Vocês são as pessoas mais importantes pois acompanharam comigo todos os momentos, alegres e tristes. Obrigado pelo carinho, apoio e paciência. A vocês, todo o meu amor.
O tema desta tese centrou-se na produção, extração e caraterização do complexo quitina-glucanos, denominado por CQG. Neste processo, utilizou-se como principal fonte de carbono um subproduto da indústria do biodiesel – o glicerol. A levedura Komagataella pastoris
(anteriormente denominada por Pichia pastoris) foi selecionada para a produção de CGC devido
ao facto de atingir elevadas densidades celulares, usando como fonte de carbono o glicerol proveniente da produção de biodiesel.
Numa primeira abordagem, foram realizados ensaios em Erlenmeyer, no sentido de selecionar a estirpe de K. pastoris com melhor desempenho, a nível de crescimento, usando o glicerol como
fonte de carbono. A estirpe K. pastoris DSM 70877 atingiu elevadas densidades celulares
(82-95 g/l), comparativamente à estirpe DSM 70382 (76-89 g/l) usando como fonte de carbono glicerol puro (99 %, w/v) ou o glicerol resultante da indústria do biodiesel (86 %, w/v), respetivamente. Tendo em conta os resultados obtidos nos testes em Erlenmeyer, a estirpe DSM 70877 foi selecionada e desta forma usada em ensaios em bioreator (2 l), usando como única fonte de carbono o glicerol resultante da indústria do biodiesel, a uma concentração de 40 g/l.
A produção de biomassade K. pastoris em bioreator foi realizada em condições controladas de
temperatura e pH (30.0 ºC e 5.0, respetivamente). Nestas condições, a concentração de biomassa atingiu valores superiores a 100 g/l, em menos de 48 horas. Durante a fase “batch”, o
rendimento de biomassa em função do glicerol consumido foi de 0.55 g/g enquanto que na “ fed-batch” atingiu 0.63 g/g.
No sentido de otimizar a eficiência do processo de extração e purificação do CQG da biomassa de K. pastoris foram efetuados diversos testes. Os resultados demonstraram que o uso de NaOH
polímero. Para tal, foram utilizadas ferramentas estatísticas, tais como a metodologia de superfície de resposta e o desenho compósito central. Os resultados mostraram que o conteúdo CQG na biomassa e a produtividade volumétrica (rp) não foram significativamente afetadas na gama de valores de pH e temperatura testadas. Contrariamente, o efeito do pH e da temperatura teve impacto positivo na proporção molar de CQG na biomassa. A maior razão molar quitina:β -glucanos (> 14:86) obteve-se na gama de pH de 4,5-5,8 e de temperaturas de 26-33 ºC. A capacidade de K. pastoris sintetizar CQG com variações na razão molar quitina:β-glucanos em
função do pH e da temperatura é uma caraterística que pode ser explorada para obter polímeros com composição distinta adequados a diferentes aplicações.
Foi, ainda, avaliado o impacto de vários fatores na produção de CQG por K. pastoris e na
composição da parede celular, nomeadamente na razão molar quitina:β-glucanos: a concentração de glicerol, o uso de diferentes fontes de carbono, a concentração de micronutrientes no meio, a presença de compostos inibitórios ou estimuladores no meio e o uso de resíduos e subprodutos de diferentes indústrias utilizados como fontes de carbono.
Os resultados obtidos mostraram que o aumento da concentração inicial de glicerol de 40 g/l para 60 g/l e da concentração de CaSO4 de 6.8 mM para 200 mM estimulou o crescimento celular. Por outro lado, o aumento da concentração de MgSO4. 7 H2O de 60 mM para 140 mM não apresentou efeito significativo no crescimento celular, mas induziu o aumentou do conteúdo de CQG na biomassa (27%), comparativamente às condições padrão (15%). Verificou-se ainda que a presença de cafeína ou glucosamina, apesar de inibir o crescimento celular, aumentou a razão molar quitina:β-glucanos no polímero de CQG (19:81 e 23:77 %mol, respetivamente).
Relativamente ao uso de resíduos e subprodutos resultantes de diferentes indústrias (melaço de cana-de-açúcar, soro de leite e de borras de café), os resultados mostraram que a cultura de K. pastoris atingiu baixa concentração celular usando soro de leite, enquanto que o melaço de
CQG comercial (kiOsmetine), tornando-o uma alternativa promissora para ser usado em várias aplicações industriais (cosmética, suplementos alimentares e saúde).
Palavras-Chave:
Complexo quitina-glucanos, Komagataella (Pichia) pastoris,This thesis was focused on the production, extraction and characterization of chitin:β-glucan complex (CGC). In this process, glycerol byproduct from the biodiesel industry was used as carbon source. The selected CGC producing yeast was Komagataella pastoris (formerly known
as Pichia pastoris), due the fact that to achieved high cell densities using as carbon source
glycerol from the biodiesel industry.
Firstly, a screening of K. pastoris strains was performed in shake flask assays, in order to select
the strain of K. pastoris with better performance, in terms of growth, using glycerol as a carbon
source. K. pastoris strain DSM 70877 achieved higher final cell densities (92-97 g/l), using pure
glycerol (99%, w/v) and in glycerol from the biodiesel industry (86%, w/v), respectively, compared to DSM 70382 strain (74-82 g/l). Based on these shake flask assays results, the wild type DSM 70877 strain was selected to proceed for cultivation in a 2 l bioreactor, using glycerol byproduct (40 g/l), as sole carbon source.
Biomass production by K. pastoris was performed under controlled temperature and pH (30.0
ºC and 5.0, respectively). More than 100 g/l biomass was obtained in less than 48 h. The yield of biomass on a glycerol basis was 0.55 g/g during the batch phase and 0.63 g/g during the fed-batch phase.
In order to optimize the downstream process, by increasing extraction and purification efficiency of CGC from K. pastoris biomass, several assays were performed. It was found that
extraction with 5 M NaOH at 65 ºC, during 2 hours, associated to neutralization with HCl, followed by successive washing steps with deionised water until conductivity of ≤20µS/cm, increased CGC purity. The obtained copolymer, CGCpure, had a chitin:glucan molar ratio of 25:75 mol% close to commercial CGC samples extracted from A. niger mycelium, kiOsmetine
from Kitozyme (30:70 mol%). CGCpure was characterized by solid-state Nuclear Magnetic Resonance (NMR) spectroscopy and Differential Scanning Calorimetry (DCS), revealing a CGC with higher purity than a CGC commercial (kiOsmetine).
temperatures (26–33 ºC). The ability of K. pastoris to synthesize CGC with different molar
ratios as a function of pH and temperature is a feature that can be exploited to obtain tailored polymer compositions.
The influence of several parameters on K. pastoris growth and CGC production were evaluated:
glycerol concentration, different carbon sources, micronutrients composition, the presence of toxic or stimulatory compounds and the use of wastes and byproducts resulted from different industries as carbon sources. Furthermore, the effect of these factors on chitin:β-glucan molar ratio in yeast cell wall composition was also evaluated in two sets of shake flask experiments.
It was found that increasing glycerol concentration from 40 to 60 g/l and CaSO4 from 6.8 to 200 mM stimulated cell growth. In contrast, the increase of MgSO4. 7 H2Ofrom 60 mM to 140 mM, had little effect on growth, but increased CGC content on the biomass (27%), compared to the standard conditions (15%). Furthermore, the presence of caffeine or glucosamine despite inhibit yeast cell growth, increased the chitin molar ratio in the CGC polymer (19:81 and 23:77 mol%, respectively).
The impact of using wastes and byproducts resulted from different industries (sugarcane molasses, cheese whey and spent coffee grounds) as carbon sources for K. pastoris cultivation
and on CGC production was studied. The results showed that K. pastoris reached lower biomass
concentration using cheese whey, compared to the other substrates. The latter were selected and tested in bioreactor. Results showed that biomass concentration obtained using sugarcane molasses and spent coffee ground hydrolysate (3.46 - 17.78 g/l, respectively) were much lower than the results obtained with glycerol biodiesel byproduct (33.6 g/l). Furthermore, a CGC content of 17.53 %, that corresponds a CGC concentration of 3.12 g/l, was achieved with sugarcane molasses.
Results demonstrated that, beyond glycerol, K. pastoris can use several carbon sources, and
Abbreviations
Acetyl Co-A Acetyl coenzyme A
AIM Alkaline-insoluble material
ATP Adenosine triphosphate
ANOVA Analysis of Variance
AOX Peroxidase alcohol oxidase
AOX1 Ethanol-regulated alcohol oxidase 1 gene
ASM Alkaline-soluble material
Asn Asparagine
BOD Biochemical oxygen demand (mg/l)
BSM Basal salts medium
CCRD Central Composite Rotatable Design
CDW Cell Dry Weight (g/l)
CGC Chitin-Glucan Complex
COD Chemical oxygen demand (mg/l)
DHAP Dihydroxyacetone phosphate
DNA Deoxyribonucleic acid
DSC Differential scanning calorimetry
DSMZ Deutsche Sammlung von Mikroorganismen und Zellkulture
Glc Glucose
GlcN Glucosamine
GlcNAc N-acetyl-D-glucosamine
HCl Hydrochloric acid
HPLC High Performance Liquid Chromatography
Man Mannose
MLR Multiple Linear Regression
NADH Nicotinamide adenine dinucleotide
NaOH Sodium Hydroxide
NMR Nuclear magnectic ressonance
PBS Phosphate-buffered saline solution
PTM Trace salts medium
rpm Rotation per minute
RSM Response Surface Methodology
SCG Spent Coffee Grounds
TCA Tricarboxylic acid
TFA Trifluoroacetic acid
UDP Uridine diphosphate
vvm Gas volume per liquid volume per time
Abs (750 nm) Absorbance at 750 nm
h Hours
KDa Kilodalton
N Normal concentration
mol % Molar Percentage
M Molar concentration (mol/l)
Mr Relative molecular mass
pO2 (%) Dissolved Oxygen Concentration
ppm parts per million
p-value Regression parameter significance
R2 Multiple correlation coefficient
rp product volumetric productivity (gCGC/l.h)
rx Biomass Volumetric Productivity (g/l..h)
T Temperature (ºC)
μmax Maximum specific growth rate (h-1)
wt.% Weight percentage
Greek Letters
α Axial level in RSM
1. Background and Motivation 1 1.1. The Yeast Cell Wall 2
1.2. Glucans and Mannans 4
1.3. Chitin:β-Glucan Complex (CGC) 5
1.4. Komagataella pastoris 6
1.5. Optimization of CGC Production 7
1.5.1.Carbon Source 8
1.6. Motivation 9
1.7. Thesis Outline 10
2. Screening of Komagataella pastoris strains 13
2.1. Summary 14
2.2. Introduction 15 2.3. Materials and Methods 17 2.3.1.Yeast Strains and Culture medium 17
2.3.2. Shake Flask Tests 17
2.3.3. Bioreactor Operation 18
2.3.4. Analytical techniques 18
2.3.5. Kinetic Parameters 19
2.4. Results and Discussion 20
2.4.1. Shake Flask Tests 20 2.4.2. Cultivation 21
2.5. Conclusions 23
3. Downstream Optimization and Polymer Characterization 25
3.1. Summary 26
3.2. Introduction 28 3.3. Material and Methods 31 3.3.1.Fractionation of K. pastoris cell wall 31
3.4.2. Purification of CGC 42 3.4.3. CGC Chemical Characterization 46 3.4.4. Thermal Properties 48 3.4.5. Solid-state NMR 50
3.5. Conclusions 52
4. Effect of pH and temperature on CGC production 55
4.1. Summary 56
4.2. Introduction 57
4.3. Materials and Methods 59
4.3.1.Yeast strain and medium 59 4.3.2. Bioreactor operation 59 4.3.3. Analytical techniques 59
4.3.4. Kinetic parameters 60
4.3.5. Experimental design (Response surface methodology - RSM) 60
4.4. Results and Discussion 62
4.4.1. Influence of temperature and pH: response analysis 62
4.4.2.Response surface methodology 64
4.5. Conclusions 69
5. Effect of Medium Composition on CGC Production 71
5.1. Summary 72
5.2. Introduction 74
5.2.1. Culture Medium 74
5.2.1.1. Wastes/byproducts as Carbon Sources 76
5.2.1.2. Cheese Whey 76
5.2.1.3. Sugarcane Molasses 78
5.2.1.4. Spent Coffee Grounds 79
5.3. Materials and Methods 80
5.3.1.Yeast strain and medium 80
5.3.2. Shake Flask Screening 80
5.3.2.1. Effect of different carbon sources 81
5.3.3. Bioreactor Operation 83
5.3.4. Analytical Techniques 83
5.3.5. Subtract Concentration 83
5.3.6. Kinetic Parameters 84
5.4. Results and Discussion 84
5.4.1. Effect of Increasing of Glycerol Concentration 84 5.4.2. Screening of different sugars as substrates for cultivation of K. pastoris and CGC
Production 86
5.4.3. Effect of Glucosamine 87
5.4.4. Effect of caffeine 87
5.4.5. Effect of Supplementation with Inorganic Salts 88 5.4.6.Valorization of food and industry byproducts for the production of CGC 89
5.4.7. Batch Bioreactor experiments 91
5.5. Conclusions 95
6. General Conclusions and Future Work 97
6.1. General Conclusions 98
6.2. Future Work 100
Figure 1.1 Schematic representation of the molecular structure of β-glucan and chitin (Roca et
al., 2012). 5
Figure 1.2 Macrokinetic model for methylotrophic K. pastoris growth on glycerol byproduct
from biodiesel industry. 8
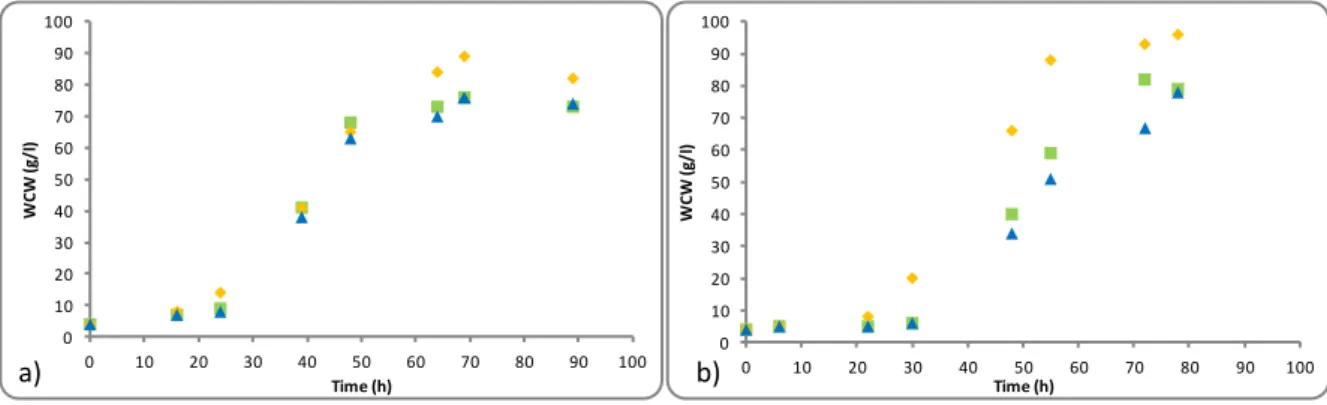
Figure 2.1 Wet cell weight (WCW) profile over time in shake flask assays, for strains (a) K. pastoris DSM 70382 and (b) K. pastoris DSM 70877, using as carbon source (, E0: 40 g/l
pureglycerol), (, E1: 43 g/l glycerol byproduct) and (▲, E2: 50g/l glycerol byproduct). 20 Figure 2.2Evolution of biomass production (CDW) during batch and fed-batch cultivation of K.
pastoris. 22
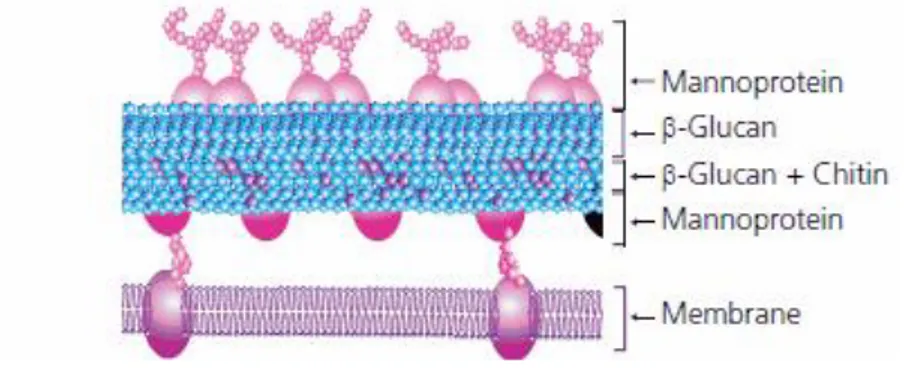
Figure 3.1 Yeast cell wall composition (Sigma-Aldrich). 28
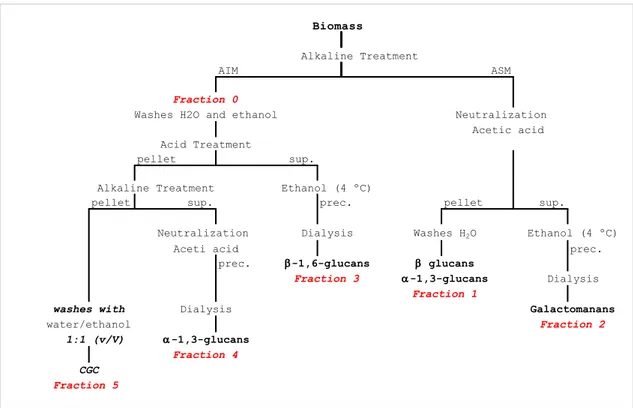
Figure 3.2- Diagram of the process of extraction of cell wall constituents of yeast. 32
Figure 3.3 Yield extraction of different fractions in K. pastoris (3-A); Composition of different
fractions of polymers (3-B). 40
Figure 3.4 DSC scans of produced CGCPBS, CGCpure, laminarin, crab shell chitosan, crab shell
chitin and commercial kiOsmetine. 49
Figure 3.5 13C CPMAS spectra of (a) the biopolymer extracted from I biomass compared with (b–d) other commercial biopolymers. Asterisks denote impurities. Selected carbon resonance assignments are depicted in Fig. 3.1; numbers inside square brackets depict carbon resonances of the β-glucan polysaccharide involved in β-1,3 glycosidic bonds. * A carbon resonances
involved in β-1,6 glycosidic bonds. 51
Figure 4.1 Parity plots for observed and predicted values for the responses studies ( maximum specific growth rate (A), CGC content in the biomass (B), CGC volumetric productivity (C) and
polymer´s chitin:β-glucan molar ratio (D). 65
grounds hydrolysate as carbon sources. 89
Figure 5.2 Cultivation profiles of the batch bioreactor experiments with sugarcane molasses. Dry cell weight ( , g/l) and CGC ( , g/l) and total sugars concentration ( , g/l).
92
Figure 5.3 Cultivation profiles of the batch bioreactor experiments with spent coffee grounds hydrolysate: A - Dry cell weight ( , g/l) and CGC concentration ( , g/l); B - galactose (
Table 1.1 Macromolecules of the cell wall of S. cerevisiae (Klis et al., 2005). 3
Table 1.2 Comparison of chitin content in different species. 4
Table 2.1 Comparison of µmax, maximum specific growth rate and Xmax, maximum biomass concentration reached at the end of fermentation in A. niger, S. cerevisiae and K. pastoris. 21
Table 2.2 Comparison of biomass production and biomass yield in various strains of P. pastoris.
23
Table 3.1 Different CGC alkaline extraction assays, with different solvent washings. 35
Table 3.2 Summary of the results obtained by quantification of glucan per gram of polymer using the enzymatic kit from Megazyme (K-YBG) and by HPLC analysis. 42
Table 3.3 Effect of temperature, NaOH concentration, reaction time and solvent washing on the efficiency of the alkaline treatment for CGC extraction from K. pastoris biomass. 44
Table 3.4 Elemental analysis of produced CGCPBS compared with laminarin, crab shell chitosan,
crab shell chitin and commercial kiOsmetine. 47
Table 3.5 CGC content in A. niger, S. cerevisiae and K. pastoris( %CGC, g CGC/g dry cell
biomass; % chitin, g chitin/g CGC). 48
Table 4.1 Central composite rotatable design (CCRD) with two independent variables X1 (temperature, T) and X2 (pH), and the observed responses studied: Y1, maximum specific growth rate (µmax); Y2, CGC content in the biomass (CGC); Y3, CGC volumetric productivity (rp),and
Y4, polymer’s chitin:β-glucan molar ratio. 63
Table 4.2 Analysis of variance (ANOVA) of the central composite design: model and lack of fit significance levels (p-values) and correlation values (R2) for the responses studied (maximum
specific growth rate (µmax, h-1); CGC content in the biomass (CGC, wt%); CGC volumetric productivity (rp, gCGC/l. day),and the polymer’s chitin:β-glucan molar ratio). 64
Table 4.3 Multiple linear regression (MLR) analysis of the polynomial models: regression coefficients (normalized values) and p-values for linear, quadratic and interaction effects of
Table 5.1 Composition of cheese whey (Siso, 1996). 77
Table 5.2Chemical composition (g 100/g) of spent coffee grounds (Mussato et al., 2011b).
79
Table 5.3 Composition of components used in shake flask experiments. 81
Table 5.4 Komagataella pastoris batch shake flask assays, under different cultivation
conditions. 85
Table 5.5 Comparison of parameters obtained for different residues in batch bioreactor experiments. μmax, maximum specific growth rate; CDW, maximum cell dry weight; % CGC, % of CGC in dry cell biomass; CGC, maximum active concentration; rp, overall volumetric
Chapter 1
Industrial biotechnology is seen as one of the key technologies of the new age. It is
mainly based on biological and engineering sciences and it develops new methods for
the production of various important products for human health and the environment.
Biotechnology not only helps in producing important biomaterials, usually non-toxic
and biodegradable, such as polysaccharides, but it also makes possible to manufacture
new products or value-added products, which were once thought to be impossible. In
particular, the demand for novel polysaccharides with interesting properties for
industrial applications (e.g. cosmetic, feed, medicine and pharmaceuticals) has greatly
increased (
Smirnou et al., 2011; Meichik and Vorob’ev, 2012
). This thesis aimed at
optimizing a process (previously described on patent WO2010/013174) to produce and
purify chitin:β
-glucan complex (CGC) from
Komagataella pastoris (previously known
as
Pichia pastoris) cell wall biomass using glycerol byproduct from the biodiesel
industry.
1.1.The yeast cell wall
Yeast cells are surrounded by a tough, rigid cell wall that represents 20-25% of the dry weight of the cell (Fleet, 1991; Klis et al., 1994). The major components of yeast cell walls are
polysaccharides (85-90%) and proteins (5-15%). However, the cell wall ratio of each component varies with the species and with the biochemical adaptation to adverse factors (Feofilova et al., 2006). Most of the protein is covalently linked to mannan polysaccharides, forming mannoproteins.
The polysaccharide component consists of a mixture of water-soluble mannans, alkali-soluble glucans, alkali-insoluble glucans and small amounts of chitin (Table 1.1). Fleet and Manners (1976) showed that in S. cerevisiae there are approximately equal proportions of mannans and
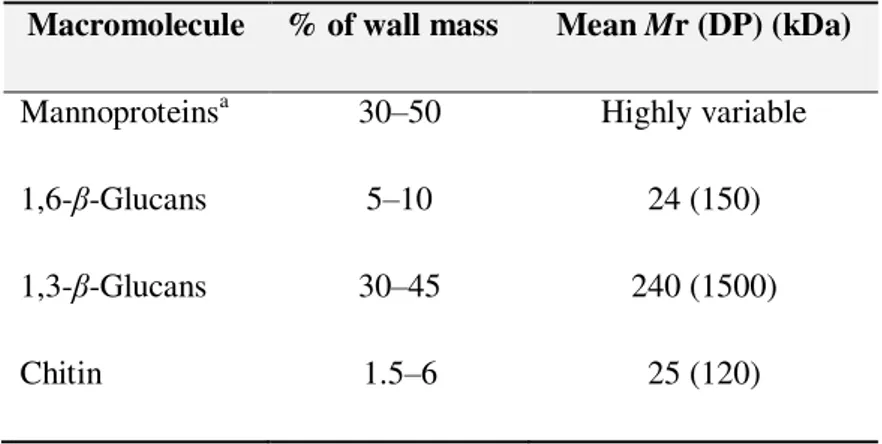
Table 1.1 - Macromolecules of the cell wall of S. cerevisiae (Klis et al., 2005).
Macromolecule % of wall mass Mean Mr (DP) (kDa)
Mannoproteinsa 30–50 Highly variable
1,6-β-Glucans 5–10 24 (150)
1,3-β-Glucans 30–45 240 (1500)
Chitin 1.5–6 25 (120)
a The actual protein content is about 4–5%; the remaining mass is from protein-linked,
mannose-containing carbohydrate side-chains.
The presence of polysaccharides conferred the structural function in the yeast cell wall, whereas the mannoproteins are important for the cell wall permeability (Zlotnic et al., 1984; De Nobel et al.,2000). The inner layer of the cell wall of yeast and fungi is mostly formed by -(1,3) and -(1,6)-glucans (polymers of glucose residues joined, respectively, by -(1,3) and -(1.6) linkages) and chitin (Smirnou et al., 2011).
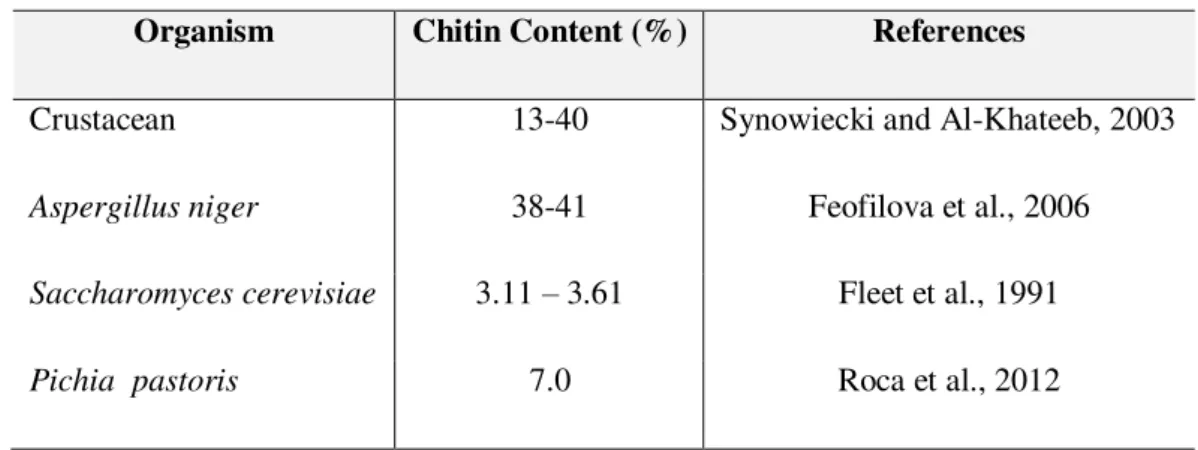
Table 1.2 - Comparison of chitin content in different species.
Organism Chitin Content (%) References
Crustacean 13-40 Synowiecki and Al-Khateeb, 2003
Aspergillus niger 38-41 Feofilova et al., 2006
Saccharomyces cerevisiae 3.11 – 3.61 Fleet et al., 1991
Pichia pastoris 7.0 Roca et al., 2012
Chitin is considered to be responsible for an enormous tensile strength and significantly contributes to the overall integrity of the cell wall of yeasts and fungi, being covalently linked to
β-(1,3)-glucans, a polymer of glucose units, forming co-polymers known as chitin-glucan complex (CGC).
The outer layer of yeast and fungi cell wall contains mainly mannans, polysaccharides that are mostly covalently linked to the cell wall proteins (glycoproteins) (Osumi, 1998).
1.2. Glucans and Mannans
Glucans are the major structural polysaccharides of the fungal and yeast cell walls, representing around 50–60% of the wall by dry weight, and are composed of repeating glucose residues that are cross-linked into chains through a variety of chemical linkages. β-(1,3)-glucans are the dominant glucans, but other glucans, such as β-(1,6)-, mixed β –(1,3)- and β-(1,4)-, α-(1,3)-, and
α-(1,4)-linked glucans are also commonly found (Fleet et al., 1991; Kapteyn et al., 1999).
Glucans are synthesized by enzyme complexes associated with the plasma membrane and then are branched by cross-linked to chitin and mannoproteins to provide the cell wall with mechanical strength and integrity (Kollar et al., 1997).
With regard to solubility, β-(1,3)-glucans with significant number of links β-(1,6) in the branches, constituted a cell wall fraction soluble in alkaline medium, β-(1,6)-glucans, a soluble fraction in acidic medium, and also β-(1,3) glucan linked to chitin represented a fraction insoluble in acidic and basic media (Phaff, 2001).
β-glucans have revitalizing properties, act as anti-inflammatory agents, protect against UV radiation and have soothing, immunostimulating, anti-ageing, anti-wrinkle and antiacne effects (Pillai et al., 2005).
1.3. Chitin-Glucan Complex (CGC)
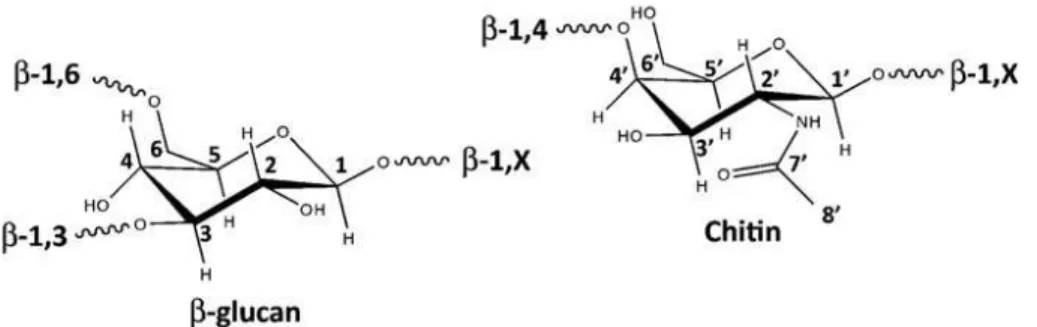
The chitin-glucan complex (CGC) is the main component of cell wall in yeasts and fungi, conferring stability and rigidity to the cells (Roca et al., 2012). Its molecular structure consists of chitin, a polymer of N-acetylglucosamine units, covalently linked to β-(1,3)-glucans, a polymer of glucose units (Figure 1.1). It can be extracted from the cell-wall of yeasts and fungi (Aguilar-Uscanga et al., 2003; Pestov et al., 2009; Smirnou et al., 2011; Tarabukina et al., 2005). The glucan and chitin cell wall biosynthesis occurs on the plasma membrane and the polymer chains are extruded into the cell wall space during their synthesis (Bowman and Free, 2006).
Figure 1.1 - Schematic representation of the molecular structure of β-glucan and chitin (Roca et al., 2012).
Commercialization of CGC isolated from mycelia of the mold fungus Aspergillus niger has
recently been authorized as food complement (EFSA, 2010). Further hydrolysis of CGC can easily lead to the production of many derivatives, such as pure chitin, chitosan (the deacetylated form of chitin) and glucans, which have attracted increasing interest due to their broad applications in agriculture, wastewater treatment, cosmetics or even in tissue engineering and immunology (Park et al., 2010; Rinaudo et al., 2006; Gautier et al., 2008). In addition, the production of fungal CGC offers the possibility to obtain a product with stable composition and properties, contrary to conventional preparation of chitin from marine sources.
Yeast production of CGC allows for the use of inexpensive raw materials, such as crude glycerol from the biodiesel industry (currently with no availability restrictions), and reaching high cell density process. Moreover, both the composition and the properties of the polymers are more stable than the ones obtained by the traditional extraction method from crustacean (Khanafari et al., 2008; Çelik et al., 2008).
CGC is extracted from yeasts and fungal biomass as an insoluble residue after successive treatments with alkali and/or acid, enzymatic methods, with the use of inorganic reagents, organic solvents or detergents (Ivshina et al., 2007; Sugawara et al., 2004). It can also be extracted from a by-product of the production of pharmaceutical and food-grade citric acid (Versali et al., 2003; Muzzarelli et al., 1997). Feofilova et al. (2006) reported a CGC content of 15-25% for fungi Aspergillus niger cell wall, and 25% for yeast, such as S. cerevisiae. As any
other yeast cells, except Schizosaccharomyces species that do not contain chitin in the cell wall
(Roncero and Durán, 1985), CGC is present in K. pastoris cells wall to maintain its integrity
and, therefore, relatively high amount of CGC can be extracted after biomass production.
1.4.
Komagataella pastoris
Pichia pastoris (reclassified as Komagataella pastoris (Yamada et al., 1995)) is a
methylotrophic yeast able to metabolize reduced one-carbon compounds, such as methanol, using them as the sole carbon and energy sources for growth (Cunha et al., 2004).
Phillips Petroleum Company (USA) was the first company that developed cultivation techniques for P. pastoris species in large-volume continuous cultures and at cell densities
An advantage of K. pastoris over other yeasts is its capacity to use a wide range of substrates,
including low-cost raw materials (e.g. biodiesel waste glycerol) (Bai et al., 2009; Cui and Ellison, 2012). Combining this feature with the fast growth rates (and hence shorter culture times), cheap operating costs and simple chemically defined media, make the production process economically viable and sustainable (Roca et al., 2012; Çelik et al., 2008).
In order to achieve maximal levels of the desired product with K. pastoris strains, it is important
to understand the influence of culture conditions on the physiology and on the regulation of CGC production process. According to the literature, factors such as temperature (Li et al., 2001; Li et al., 2003; Shi et al., 2003), pH (Sreekrishna et al., 1997; Inan et al., 1999), composition of the feed medium (Boze et al., 2001; Xie et al., 2005; Jungo et al., 2007) and specific growth rate (D'Anjou and Daugulis, 2001) have to be optimized in order to achieve high productivities of desired products with K. pastoris strains.
1.5. Optimization of CGC Production
Available cultivation protocols for growing of K. pastoris are mainly based on those described
in the Pichia Fermentation Process Guidelines (Supplied by Invitrogen). However, these standard protocols were developed to obtain heterologous proteins and not specifically to reach high cell density nor CGC.
At the moment, more than 500 heterologous proteins have been expressed by P. pastoris (
Cregg et al., 2000 and Cos et al., 2006). Moreover, a recombinant DNA hepatitis B vaccine and interferon alpha derived from P. pastoris have been marketed in India
(www.shantabiotech.com). Similarly, a recombinant human insulin was approved and marketed in India (www.biocon.com).
Efficient production of CGC relies on both the strain used and the optimal bioprocess parameters, such as carbon source, composition of the fermentation medium and operational conditions, such as temperature and pH. Although the effect of nutritional and environmental factors, such as temperature and pH, on growth and protein expression by K. pastoris have been
1.5.1. Carbon Source
Glycerol
Biodiesel production generates about 10% (w/w) crude glycerol as the main byproduct. On the other hand, its cost is much lower than pure glycerol and is considered nowadays a surplus of this industry (Pachauri et al., 2006).
With the rapid growth of biodiesel industry all over the world, a large surplus of glycerol has been created and its price is declining day by day. The current market value is US$ 0.27- 0.41 per pound of pure glycerol (Yang et al., 2012) and as low as US$ 0.04 - 0.09 per pound of crude glycerol (Sims, 2011). Thus, crude glycerol disposal and utilization has become a serious issue and a financial and environmental liability for the biodiesel industry. Economic utilizations of glycerol for value-added products are critically important for the sustainability of biodiesel industry (Ayoub and Abdullah, 2012).
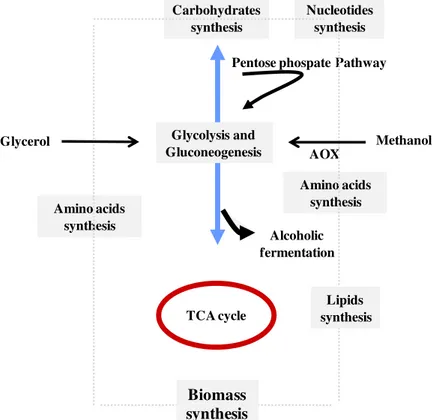
The metabolic network presented in Figure 1.2 is a macrokinetic model for reaching high cell densities of K.pastoris using glycerol from biodiesel industry as sole carbon source.
Figure 1.2 - Macrokinetic model for methylotrophic K. pastoris growth on glycerol byproduct from
biodiesel industry. Glycolysis and Gluconeogenesis TCA cycle Glycerol Amino acids synthesis Nucleotides synthesis Amino acids synthesis Methanol AOX Alcoholic fermentation Carbohydrates synthesis
Pentose phospate Pathway
Biomass synthesis
The catabolic pathway includes glycerol phosphorylation by a glycerol kinase, resulting in the formation of glycerol 3-phosphate, which is then followed by oxidation to dihydroxyacetone phosphate (DHAP) by a FAD dependent glycerol-3-phosphate dehydrogenase. The dihydroxyacetone phosphate formed enters the glycolytic pathway. A few yeast species have an alternative pathway for dissimilating glycerol which involves a NAD-dependent glycerol dehydrogenase and a dihydroxyacetone kinase (Nevoigt and Stahl, 1997). Pyruvate is formed as an outcome of glycolysis and is further oxidized to acetyl-CoA, via pyruvate dehydrogenase. Acetyl-CoA enters the tricarboxylic acid (TCA) cycle, where many metabolites are produced and used for the synthesis of cellular constituents such as amino acids, nucleic acids and cell wall components (Ren et al., 2003; Solá et al., 2004).
1.6. Motivation
CGC is the main component of cell wall in yeasts and fungi, conferring stability and rigidity to the cells. Currently, commercial CGC is mainly obtained from Aspergillus niger from the citric
acid production (Versali et al., 2003) as a side-product of an industrial cultivation process.
Nevertheless, those cultures do not attain cell densities as high as the values reached with yeasts, due the fact that the process is guided for the production of citric acid and not to production of high biomass densities and also due fungal morphology. As any other yeast cells, CGC is present in K. pastoris cell wall to maintain its integrity and, therefore, relatively high
amount of CGC can be extracted after biomass production. This, combined with the fast growth rates, cheap operating costs, also due its ability to use efficiently inexpensive raw material and simple chemically defined media, make the production process economically viable and sustainable.
This PhD work plan aimed at optimizing the process described on patent WO2010/013174, whose objective was to produce high cell densities of K. pastoris to obtain chitinous polymers,
as well as polymers containing glucose, mannose and/or galactose.
Bearing in mind that renewable resources, like industrial wastes/byproducts, may be regarded as potential alternative substrate sources for biopolymers production, in this PhD thesis, a process was studied to valorize glycerol byproduct from the biodiesel industry, as well other wastes/byproducts as carbon sources. For the first time, in this study, K. pastoris was grown on
This thesis encompasses the following objectives:
Objectives
1. Screening of the most suitable Komagataella (Pichia) pastoris strains for cultivation at high
cell densities, using the byproduct of biodiesel industry rich in glycerol as the sole carbon source.
2. Development and optimization of the extraction procedure to obtain pure CGC from K. pastoris biomass. Polymer characterization, in terms of its chemical composition; Thermal
properties (DSC); elemental analysis; and NMR characterization to understanding the molecular-scale structure and dynamics of macromolecules contents on CGC polymer.
3. Optimization of bioreactor operation aiming at maximizing CGC production, by studding the effect of environmental conditions (pH and temperature).
4. Evaluation of the effect of medium composition and the use of stimulatory or inhibitory factors on the CGC production and on the impact on chitin:β-glucan molar ratio.
1.7. Thesis outline
This thesis is divided into six chapters, describing the work performed during this PhD project. The methodology used in each individual chapter is detailed in the context of the respective subject and, when applicable, is related to that used in previous chapters. Chapters 2 and 3 are dedicated to optimization of growth and CGC extraction and purification process optimization, as well as CGC characterization. Chapter 4 and 5 are related to optimization of the environmental conditions (pH and temperature), type and concentration of carbon source, presence of inhibitory/stimulatory factors and divalent ions, aiming at maximizing CGC productivity.
The work performed during this PhD resulted in three scientific papers, which have been published in international scientific publications.
Chapter 1: Background and Motivation
Chapter 2: Screening of Komagataella pastoris strains
The second chapter of the thesis deals with the screening of high cell density producing K. pastoris strains. Two strains of K. pastoris with accession numbers DSM 70877 and DSM
70382 were tested. They were further grown in shake flasks using Basalt Salt Medium supplemented with pure and glycerol byproduct of biodiesel industry. Growth experiments on different carbon sources have been discussed here. Further, fed-batch culture was performed with strain K. pastoris DSM 70877 using glycerol from the biodiesel industry.
Chapter 3: Downstream Optimization and Polymer Characterization
Chapter 3 describes the studies performed for the optimization of extraction and purification of CGC. Various methods of extraction of CGC were tested aiming at making easier downstream processing after fermentation. Selective extraction by fractionation of K. pastoris biomass was
assayed. The fractions extracted had low degree of purity, thus requiring further extraction and purification steps. Several assays were performed to increase extraction efficiency (extension of the reaction time, concentration of the alkali and temperature and purification of CGC (different solvent washing procedures).
Chemical and structural characterization of CGC was done by hydrolysis and analysis Dionex (HPLC), using elemental analysis, nuclear magnetic resonance (13C NMR) and DSC.
Chapter 4: Effect of pH and temperature on CGC production
Chapter 4 focused on the interactive effect of temperature and pH using multivariate statistical analysis.
Response surface methodology (RSM) has been used for the optimization of bioreactor operation, by studding the effect of environmental conditions (pH and temperature).
This methodology has been extended to assess the cultivation conditions favorable for maximizing CGC production in yeast cell and evaluate chitin:β-glucan molar ratio in the polymer.
Chapter 5: Effect of Medium Composition on CGC Production
In chapter five, the effect of the type (namely, lactose, sucrose and galactose) and concentration of carbon source, presence of inhibitory/stimulatory factors (presence of glucosamine or caffeine) and increased concentration of some divalent ions (namely, Ca2+, Mn2+ and Mg2+) on CGC productivity and on chitin:β-glucans molar ratio were evaluated in shake flask assays. The use of food industry byproducts, namely, cheese whey, sugarcane molasses and spent coffee grounds hydrolysate, was also evaluated.
Chapter 6: Conclusions and Future strategies
Chapter 2
2.1 Summary
This study aimed at selecting the most suitable
Komagataella (Pichia) pastoris strain
for cultivation at high cell densities, using the byproduct of biodiesel industry rich in
glycerol as the sole carbon source.
Two strains, namely
K. pastoris DSM 70877 and DSM 70382, were cultivated in pure
glycerol (99%, w/v) and in glycerol from the biodiesel industry (86%, w/v), in shake
flask assays. It was found that both strains grew well in either substrate. Nevertheless,
strain DSM 70877 has achieved higher final cell densities in both experiments (82-95
g/l, respectively), compared to DSM 70382 strain (76-89 g/l, respectively). Based on
these results, the wild type DSM 70877 strain was selected to proceed for cultivation in
a 2 l bioreactor, using glycerol byproduct (40 g/l), as sole carbon source.
2.2 Introduction
Komagataella pastoris is a methylotrophic yeast. This ability to metabolize reduced one-carbon
compounds, such as methanol, using them as the sole carbon and energy sources for cell growth, is possible due to overexpression of the enzyme peroxisome alcohol oxidase (AOX), which can reach about 30% of the intracellular protein in the presence of methanol (Couderc, 1980).
The prevalent use of K. pastoris in biotechnology is based on several advantages. One
advantage consists in achieving high cell densities during fermentation, over 130 g/l cell dry weight, in controlled environmental conditions (Cregg et al., 1993; Cereghino and Cregg, 2000). Another advantage of K. pastoris is its capacity to efficiently use a wide range of substrates,
including low-cost raw materials (e.g. biodiesel waste glycerol and methanol) (Çelik et al., 2008; Cui and Ellison, 2012), making the production processes more economically viable and sustainable (Roca et al., 2012; Reis et al., 2011; Ferreira et al., 2012; Çelik et al., 2008 ).
Glycerol, an abundant byproduct from the biodiesel industry, is today one of those cheap raw materials. In Europe alone, the biodiesel production was over 9 million tones in 2014 (www.longhini.eu). For every 9 kg of biodiesel produced, approximately 1 kg glycerol is obtained. Large amounts of glycerol are then expected to accumulate with increasing demand for biodiesel. However, glycerol resulting from biodiesel industry contains impurities, which makes it inadequate for use in many of the traditional glycerol applications unless costly purification steps are performed. For this reason, there is an urgent need to develop new ways to convert this glycerol byproduct, into higher value-added products. Furthermore, Çelik et al. (2008) already studied the influence of the type and purity/concentration of crude glycerol on K. pastoris growth and showed that cell concentration was higher using a medium containing crude
glycerol (with a methanol content of >3%), as carbon source (reaching a biomass yield of 0.57 g biomass/g substrate), whereas lower glycerol consumption rates were obtained with pure glycerol medium, underlying the positive effect of potential additional nutrients present in crude glycerol.
K. pastoris is used to produce heterologous proteins at high levels when grown on a minimal
which simplifies protein purification, and (c) K. pastoris preference to grow in a respiratory
mode, reducing excretion of fermentation byproducts, such as ethanol or acetic acid, often growth inhibitors, and allows one to reach exceptionally high cell densities (Solá et al., 2004).
The protocol for aerobic growth of Komagataella pastoris yeast to achieve high cell densities
and protein production is well optimized (Oliveira et al., 2005; Ferreira et al., 2012). The components of K. pastoris media (glycerol, methanol, salts and trace elements) are relatively
inexpensive and as such are well suited for large-scale production. As described by Cunha et al. (2004), K. pastoris fermentation usually occurs in semi-continuous mode, starting with a batch
phase in a medium containing glycerol as the primary carbon source, followed by a stage of feeding with glycerol for biomass growth, and a final feed phase with a methanol stream as a carbon source for the production of the target protein. A high cell density is a key characteristic of Komagataella pastoris due to its preference for growth. This trait lends an advantage to K. pastoris over other yeasts, such as Saccharomyces cerevisiae, whose growth is hindered by the
ethanol accumulated during fermentation.
The main objective of this chapter was the screening for a K. pastoris strain able to reach high
2.3 Material and Methods
2.3.1. Yeast strains and culture medium
The strains used in this work were purchased at the Leibniz Institute DSMZ – German collection of microorganisms and cell cultures. Two Komagataella pastoris strains were tested,
namely DSM 70877 and DSM 70382. Bothstrains were cryopreserved in 20% (v/v) glycerol, at -80ºC.
The strains were cultivated in standard basal salts medium (BSM) (Pichia Fermentation Process Guidelines, Invitrogen), with the following composition (per litre): H3PO4 85%, 26.7 ml; CaSO4, 0.93 g; K2SO4, 18.2 g; MgSO4,.7H2O, 14.9 g; KOH, 4.13 g; glycerol, 40 g; Antifoam A (Sigma), 0.75 ml and 4.35 ml of a trace elements solutions (PTM). The PTM solution had the following composition (per litre): CuSO4·5H2O, 6 g; NaI, 0.08 g; MnSO4·H2O, 3 g; Na2MoO4·2H2O, 0.2 g; H3BO3, 0.02 g; CoCl2·6H2O, 0.5 g; ZnCl2, 20 g; Fe2SO4·7H2O, 65 g; biotin, 0.2 g and H2SO4, 5 ml. The pH was adjusted to 5.0 with a 25% (v/v) ammonium hydroxide solution (Scharlau). The PTM solution was filter sterilized (0.2 μm, Sartorius Stedim Minisart) separately and added to the BSM medium after its sterilization at 121 ºC, for 30 minutes. Pure glycerol (Sigma-Aldrich, 99%) or glycerol byproduct (with a glycerol content ca. 86 w/v, supplied by SGC Energia, SGPS, SA, Portugal) were sterilized at 121 ºC, for 30 min.
BSM medium was used for inocula preparation, as well as for the shake flask and bioreactor experiments.
2.3.2. Shake flask tests
K. pastoris DSM 70877 and DSM 70382 were cultivated in BSM medium supplemented with
40 g/l pure glycerol (Sigma-Aldrich, 99%) (run E0) and glycerol byproduct at different concentrations, 43 and 50 g/l (runs E1 and E2, respectively).
pre-inoculum (25 ml) in 250 ml BSM medium and further incubating the cultures, under the same conditions, for 72 hours.
For runs E0, E1 and E2, pre-inocula (25 ml) was used to inoculate a 500 ml shake flask with 250 ml BSM medium at 10% (v/v) and incubated in an orbital shaker at 30 ºC and 200 rpm, for 120 h. All experiments were performed in duplicate. Twice daily, 1 ml samples were withdrawn from each shake flask for measurement of the pH and the optical density at 600 nm.
2.3.3. Bioreactor operation
Inoculi for bioreactor experiments were prepared by incubating the culture in BSM medium, containing glycerol byproduct (40 g/l), in shake flasks for 2 days at 30 ºC, in an incubator shaker (250 rpm). This pre-inoculum was used to inoculate a 250 ml shake flask at 10% (v/v), which was grown for 3 days at 30 ºC and 250 rpm. Experiments were carried out in a 2 l bioreactor (BioStat B-plus, Sartorius) with an initial working volume of 1.4 l. The bioreactor was operated with controlled temperature and pH of 30 ºC ± 0.1 and 5.0 ± 0.05, respectively. pH was controlled by the addition of 25% (v/v) ammonium hydroxide that served also as the nitrogen source. The DO concentration was controlled by the automatic variation of the stirring rate (between 300 and 1000 rpm) and supplementation of the air stream with pure oxygen. An initial batch phase was performed during 26 h on BSM medium. Fed-batch mode was initiated when a decrease in the oxygen consumption rate was observed, by supplying the bioreactor with fresh glycerol byproduct (~86%, w/v) supplemented with 24 ml of trace elements PTM solution per liter of glycerol, using an exponential feeding rate, F = F0eµt, with F being the feeding rate in g/h, F0 the initial feeding rate (5.6 g/h), and µ the desired specific growth rate, 0.16 h−1.
2.3.4. Analytical Techniques
Culture broth samples were taken periodically from the bioreactor during the cultivation runs and centrifuged at 10 000×g, for 15 minutes, for cell separation. The cell-free supernatant was
stored at -20 ºC for glycerol quantification.
minutes). The cell dry weight (CDW, g/l) was also determined by gravimetry, by drying the wet cell pellet at 105 ºC until constant weight.
Glycerol concentration in the cell-free supernatant was determined by high performance liquid chromatography (HPLC) with an Aminex HPX-87H column (BioRad), coupled to a refractometer. The cell-free supernatant samples were diluted in H2SO4 0.01 N and filtered with Vectra Spin Micro Polysulphone filters (0.2 μm), at 10 000×g, for 10 min. The analysis was
performed at 50 °C, with sulphuric acid (H2SO4 0.01N) as eluent, at a flow rate of 0.6 ml/min. An external standard calibration curve was constructed using glycerol (Sigma – Aldrich 99%) solutions in concentrations within 10 and 1000 ppm.
2.3.5. Kinetic parameters
The maximum specific cell growth rate (μmax, h-1) was obtained by linear regression of the logarithm of cell dry weight in relation to time, using the following equation:
maxt
1CDWo CDW
Ln
where CDW0 (g/l) is the cell dry weight at the beginning of the run.
The yield of biomass on substrate (YX/s, g/g) was determined by using the following equation:
2
/
/
s
x
s
Yx
where Δs is the biomass (g CDW/l) produced and Δx is the substrate uptaken (g/l) for the same time interval.
The biomass volumetric productivity (rX , g/l.d) was determined as follows:
3
/
dt
dx
rX
where X corresponds to the biomass concentration (CDW, g/l), at a certain running time t
2.4. Results and Discussion
The selection of high cell densities strain remains an early step of improvement of biomass production. Shake flask assays and bioreactor validations were done in order to choose the strain that better metabolizes glycerol from biodiesel industry and reaches high cell concentrations.
2.4.1. Shake flask Tests
A preliminary shake flask screening was performed for cultivation of each K. pastoris strain,
wherein glycerol byproduct was tested as the sole carbon source at different concentrations: runs E1 (43 g/l) and E2 (50g/l) that were compared with pure glycerol at 40 g/l (runs E0) (Figure 2.1 a) and b)).
In runs E0, using pure glycerol, strain DSM 70877 achieved slowly higher maximum wet cell weight (82g/l) than strain DSM 70382 (76 g/l) (Figure 2.1).
Figure 2.1- Wet cell weight (WCW) profile over time in the shake flask assays, for strains (a) K. pastoris
DSM 70382 and (b) K. pastoris DSM 70877, using as carbon source (, E0: 40 g/l pure glycerol), (, E1: 43 g/l glycerol byproduct) and ( ▲, E2: 50g/l glycerol byproduct).
Results obtained for cultivation of both strains in 43 g/l glycerol byproduct (runs E1), showed that K. pastoris DSM 70877 strain presented a faster growth, with higher maximum yeast cell
growth, 95 g/l within 79 hours, compared to 89 g/l obtained within 69 hours for DSM 70382. Furthermore, the increased of glycerol byproduct concentration from 43 g/l to 50 g/l (runs E2) reveled a slower growth, with a lag-phaseslowly higher, compared to growth on 43 g/l glycerol
0 10 20 30 40 50 60 70 80 90 100
0 10 20 30 40 50 60 70 80 90 100
W C W ( g / l) Time (h) 0 10 20 30 40 50 60 70 80 90 100
0 10 20 30 40 50 60 70 80 90 100
W C W (g / l) Time (h)
byproduct as carbon source. Indeed, a decreased of wet cell weigh in DSM 70382 (76 g/l) and DSM 70877 (79 g/l) strains were observed, compared with results with glycerol byproduct at 43 g/l. These results may be related to the inhibition of bioconversion that may arise from considerable concentrations of substrates or products (high osmotic pressure in the fermentation medium) and/or the presence of toxic substances (metabolites and/or substrate impurities).
Based on these results, K. pastoris DSM 70877 was selected the most suitable Komagataella
strain for cultivation at high cell densities, using the byproduct of biodiesel industry rich in glycerol as the sole carbon source on fed-batch culture.
2.4.2. Bioreactor cultivation
Considering the results obtained in the shake flask assays, namely, higher cell density, strain DSM 70877 was selected to perform fed-batch bioreactor experiments in a 2 l bioreactor, using glycerol byproduct (40g/l), as sole carbon source.
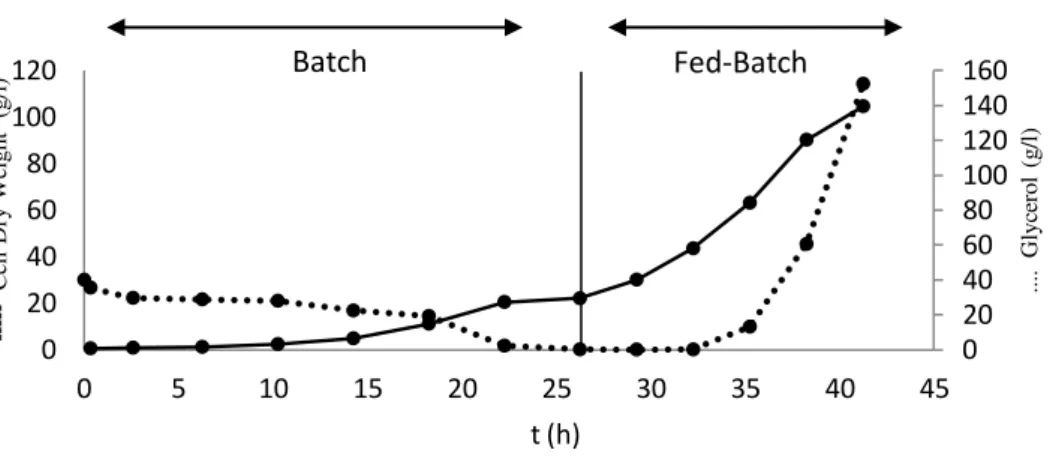
The run included an initial batch phase of 26 h (Figure 2.2), in which K. pastoris cells grew at a
maximum specific growth rate of 0.12 h−1 and reached a biomass concentration of 22 g/l.
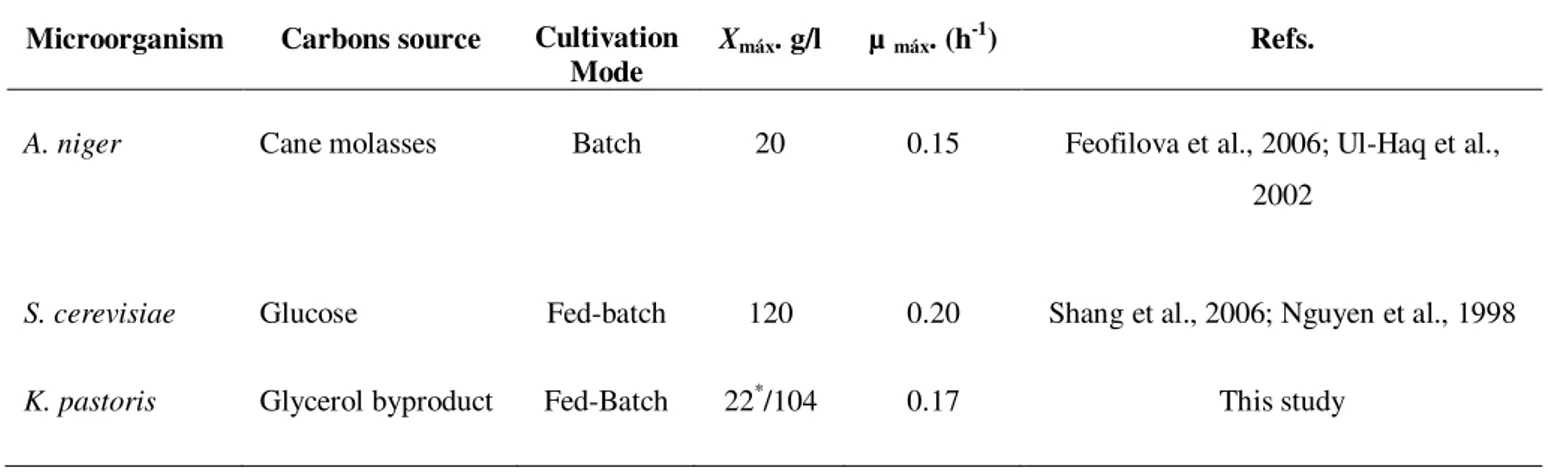
Table 2.1. - Comparison of µmax, maximum specific growth rate and Xmax, maximum biomass
concentration reached at the end of fermentation in A. niger, S. cerevisiae and K. pastoris.
Microorganism Carbons source Cultivation
Mode
Xmáx. g/l µ máx. (h-1) Refs.
A. niger Cane molasses Batch 20 0.15 Feofilova et al., 2006; Ul-Haq et al.,
2002
S. cerevisiae Glucose Fed-batch 120 0.20 Shang et al., 2006; Nguyen et al., 1998
K. pastoris Glycerol byproduct Fed-Batch 22*/104 0.17 This study
As illustrated in Table 2.1, utilization of K. pastoris allows reaching very high biomass
concentration during fermentation (much more difficult to attain with filamentous fungi, as
Aspergillus, due to rheological constraints). Nevertheless, with a relatively lower growth rate
(0.17 h-1) (compared with other yeasts, such as Saccharomyces with µ
max=0.2 h-1 and Xmax 120 g/l), using only glycerol as carbon source (much cheaper than glucose, for instance).
This corresponds to a growth yield of 0.55 g/g, similar to published results on pure glycerol (0.55 g/g) for recombinant Pichia pastoris strain and on glycerol byproduct (0.57 g/g) for Pichia pastoris E17 strain (Table 2.2). These results are consistent with observation by Çelik et
al. (2008) (Table 2.2) where the cell yield on substrate using glycerol byproduct (Yx/s = 0.57 g/g) was higher than those attained with pure glycerol (Yx/s = 0.44 g/g).
After 26 h of cultivation, when glycerol was depleted, as indicated by a drop in the stirring rate (corresponding to a drop in oxygen consumption rate), the exponential feeding phase using glycerol byproduct and mineral media was initiated, resulting in an immediate increase in the oxygen consumption rate. Biomass concentration reached 104 g/l after 41 h of cultivation (Figure 2.2 and Table 2.1).
Figure 2.2- Evolution of biomass production (CDW) and glycerol concentration (g/l) during batch and fed-batch phases of the bioreactor cultivation of K. pastoris.
The growth yield increased slightly to 0.63 g/g during the fed batch phase (close to the value of 0.70 g/g reported by Jahic et al. (2002) for Pichia pastoris SMD1168 strain cultivated on
four-stage process (including a batch with pure glycerol; the second four-stage was exponential fed-batch growth on glycerol; transiting to exponential fed-batch growth on methanol; followed a fourth stage with constant fed-batch growth on methanol used to control the oxygen demand at the
0 20 40 60 80 100 120 140 160 0 20 40 60 80 100 120
0 5 10 15 20 25 30 35 40 45
... . G ly ce ro l (g /l) -- Ce ll D ry W ei gh t (g /l) t (h)
high cell density). Final cell concentration (104 g/l) was in the range of results obtained by other authors (75-120 g/l) with pure glycerol (Table 2.2). The overall biomass volumetric productivity was 60.9g/l.d.
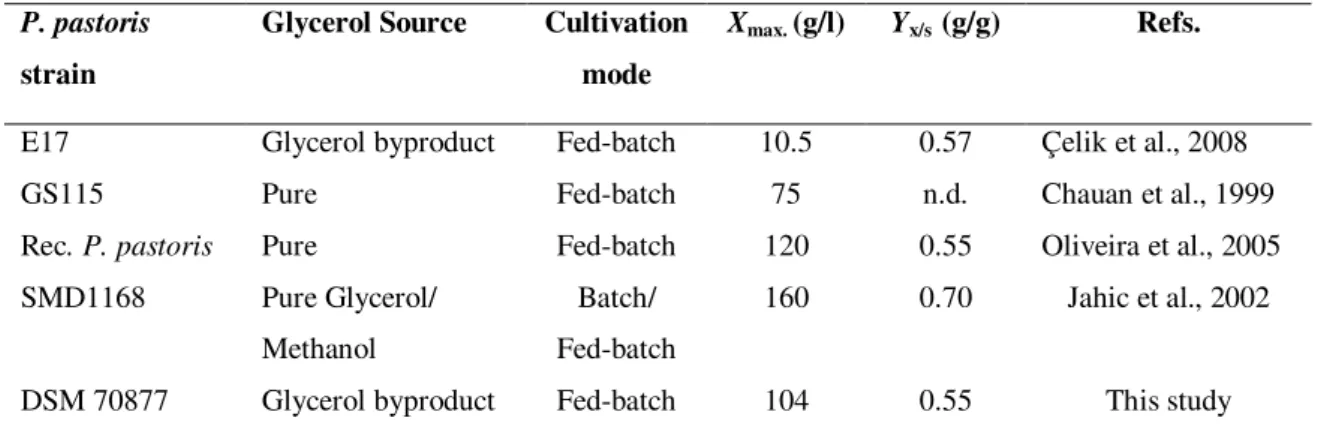
Table 2.2- Comparison of biomass production and biomass yield in various strains of P. pastoris.
P. pastoris
strain
Glycerol Source Cultivation
mode
Xmax. (g/l) Yx/s (g/g) Refs.
E17 Glycerol byproduct Fed-batch 10.5 0.57 Çelik et al., 2008 GS115 Pure Fed-batch 75 n.d. Chauan et al., 1999
Rec. P. pastoris Pure Fed-batch 120 0.55 Oliveira et al., 2005
SMD1168 Pure Glycerol/ Methanol
Batch/ Fed-batch
160 0.70 Jahic et al., 2002 DSM 70877 Glycerol byproduct Fed-batch 104 0.55 This study Rec.: Recombinant; n.d.: not determinated
These results confirmed that Komagataella pastoris DSM 70877 it is a promising strain: is able
to reach very high biomass concentration (104 g/l) in the end of fed-batch culture on glycerol byproduct from the biodiesel industry, when compared with other strains (10.5 g/l) and showed a overall growth yield (0.55 g/g) closed to the observed by other authors (Table 2.2).
2.5 Conclusions
In the present study, two different Komagataella pastoris strains were cultivated in order to
investigate the efficiency of using pure glycerol and glycerol byproduct from the biodiesel industry, in the growth biomass efficiency.
Shake flask assays results revealed that Komagataella pastoris DSM 70877 was able to
efficiently grow on glycerol byproduct as the sole carbon source.
Strain DSM 70877 was selected to perform fed-batch bioreactor experiments due to the high growth biomass observed on shake flask assays.
Fed-batch cultivations with K. pastoris were performed using glycerol from biodiesel industry
Chapter 3
Downstream Optimization and
Polymer Characterization
Part of the results presented in this chapter were published in a peer reviewed paper:
3.1 Summary
Theyeast cell wall contains different polymers, including β-(1-3)-D-glucans, β-(1-6)-D-glucans, chitin and mannoproteins. Recent studies with S. cerevisiae suggest that the existence of
covalent linkages between the different components of the wall, such as chitin and β -(1-3)-glucans (Kollar et al., 1997), as well as among glycoproteins, β-(1-6)-glucans and β -(1-3)-glucans, leads to the formation of different copolymers, such as, for example, glucomannans, galactomannans and chitin-glucan complex (CGC). The latter is a co-polymer of chitin and ß-glucans (Tarabukina et al., 2005).
K. pastoris showed significant amounts of CGC, in the range 18-26%, which makes feasible its
extraction. Based on the work of Sugawara et al. (2004), several protocols were tested and optimized for the selective extraction of CGC by fractionation of K. pastoris biomass, followed
by polymer purification. However, the fractions extracted had low degree of purity, thus requiring further extraction and purification steps. In order to do this, several assays were performed to increase extraction efficiency (extension of the reaction time, concentration of the alkali and temperature) and purification of CGC (different solvent washing procedures). It was found that the use of 5 M NaOH at 65 ºC, during 2 hours, associated to neutralization with HCl, increased CGC purity.
The obtained copolymer, CGCpure, had a chitin:β-glucan molar ratio of 25:75. Residual contents of 1.5 wt.% mannose, 3.0 wt.% proteins and 0.9 wt.% inorganic salts were detected. Commercial CGC samples extracted from A. niger mycelium, kiOsmetine from Kitozyme, had
higher inorganic salts (<5wt%) and protein (<8 wt%) contents (www.kitozyme.com).
CGCpure had a chitin:β-glucan molar ratio similar to the values reported for kiOsmetine, 30:70. CGCpure was characterized by Differential Scanning Calorimetry (DCS) and solid-state Nuclear Magnetic Resonance (NMR) spectroscopy and compared with commercial biopolymers,
namely, crab shell chitin and chitosan, algal β-glucan (laminarin) and commercial fungal CGC
3.2 Introduction
The yeast cell wall is a complex of different macromolecules, mainly composed by polysaccharides that correspond for over 50% of the cell dry weight. There are three main groups of polysaccharides that form the yeast cell wall: polymers of mannose covalently linked to peptides (mannoproteins, 30-50%), polymers of glucose (1,6-β-glucans: 5-10% and 1,3-β -glucans: 30-45%) and lower amounts of polymers of N-acetylglucosamine (chitin, 1.5-6%) that
is usually present in the form of a chitin-glucan complex (Figure 3.1) (Orlean, 1997 and Klis et al., 2005).
Figure 3.1- Yeast cell wall composition (Sigma-Aldrich).
CGC extraction from yeast cell walls consists of two stages:
1. Yeast cell lysis: CGC is localized in the cell wall, thus it is necessary to lyse cells and separate the insoluble cell wall fraction from the cytoplasm, lipids, DNA, proteins and debris; 2. Cell wall fractionation of the cell lysed components by their selective solubilization to obtain different polysaccharides, such as CGC and polysaccharides containing different sugar monomers, such as glucose, mannose and/or galactose (Klis et al., 2005; JohnSton, 1965; Otero et al., 1996; Synowiecki and Al-Khateeb, 2003; Sugawara et al., 2004).
At present, CGC is isolated from fungi and yeasts through physicochemical and/or enzymatic methods (Feofilova et al., 2002) with the use of inorganic reagents (Kanarskaya, 2000) in combination with synthetic detergents (Kotlyar, 2001), and methods based on the use of organic solvents and detergents (Feofilova et al., 1995; Ivshina et al., 2007; Sugawara et al., 2004).
An interesting alternative to chemical methods is the enzymatic method. CGC can be enzymatically extracted from the Aspergillus niger mycelium, a byproduct of the production of
pharmaceutical and food-grade citric acid (Versali et al., 2003). The extraction and purification process is environmentally friendly – it uses no animal- or synthetic-derived reactants and has minimal environmental impact. However, residual protein often remains high and reaction times are significantly increased compared to chemical methods. Enzyme costs are further more prohibitive, limiting enzymatic methods in industrial applications (Percot et al., 2003).
an alkaline hydrolysis, Ha et al. (2002) used alkaline–acid hydrolysis, and Magnelli et al. (2002) used the sequential treatment of yeast and fungi cell walls with specific hydrolytic enzymes, followed by dialysis.
Studies on the chemistry and structure of yeast walls have focused mainly on Saccharomyces cerevisiae and Candida albicans. For those species, as well as for most other yeasts that have
been examined, the cell wall consists of about 85±9.0% polysaccharide, namely water soluble mannans, alkali soluble glucans, alkali insoluble glucans and small amounts of chitin and 10±1.5% protein, often covalently linked to the mannan, which is more correctly described as mannoprotein.
In the present study, a method to optimize the purification of CGC from K. pastoris cell wall
was developed. In this context, several tests were performed to remove contaminants (mannose-containing polymers, protein and ashes) from CGC, including washing with water, PBS (phosphate-buffered saline solution), ethanol and/or HCl neutralization. Nguyen et al. (1998) showed that PBS can be efficiently used to remove proteins during cell wall preparation for fractionation because it is a good solvent for most proteins.