Universidade do Minho
Escola de Engenharia
Alexandre Vieira de Sousa
abril de 2016
A guide for Functional
Magnetic Resonance Imaging
Ale xandr e Vieir a de Sousa A guide for F unctional Magne tic R esonance Imaging UMinho|20 16
Alexandre Vieira de Sousa
abril de 2016
A guide for Functional
Magnetic Resonance Imaging
Trabalho efetuado sob a orientação do
Professor Victor Manuel Rodrigues Alves
e coorientação do
Doutor José Miguel Montenegro Soares
Dissertação de Mestrado
Mestrado Integrado em Engenharia Biomédica
Ramo de Informática Médica
Universidade do Minho
Escola de Engenharia
DECLARAÇÃO
Nome: Alexandre Vieira de Sousa
Endereço electrónico: [email protected]
Número do Bilhete de Identidade: 12345530
Título dissertação: A Guide for Functional Magnetic Resonance Imaging
Orientadores: Victor Manuel Rodrigues Alves, José Miguel Montenegro Soares
Ano de conclusão: 2016
Designação do Mestrado: Mestrado Integrado em Engenharia Biomédica
DE ACORDO COM A LEGISLAÇÃO EM VIGOR, NÃO É PERMITIDA A REPRODUÇÃO DE QUALQUER PARTE DESTA DISSERTAÇÃO
Universidade do Minho, ___/___/______
iii
Title: A guide for Functional Magnetic Resonance Imaging
Abstract
The brain is the most amazingly powerful and complex organ in the human body. Constituted by approximately 86 billion of highly interconnected neurons, it allows us to have unique cognitive capabilities, such as language production and comprehension, memory, judgement and problem solving, or even experience feelings. The full understanding of the organization and functioning of the human brain is receiving increasing attention but remains an exciting challenge for all neuroscientists.
To assist in this quest, fMRI stands as a safe and powerful non-invasive neuroimaging tool providing high visualization quality of the location of activity in the brain resulting from, for example, sensory stimulation, cognitive or motor function, or even resting state fluctuations, being then widely used for mapping the human brain. It allows the study of how the healthy brain works, how it is affected by different diseases, how it recovers from damage and how drugs can modulate activity or post-lesion recovery. Starting purely as a research tool, fMRI was quickly adopted for clinical purposes and has now a growing role in clinical neuroimaging.
Constantly gaining increased popularity among clinicians and researchers, fMRI is presently a promising tool for studying the brain function in living humans. However, it has a complex workflow that implicates knowledge of paradigm design, imaging artifacts, complex MRI protocol definition, a multitude of preprocessing and analysis methods in several software packages, statistical analyzes, and in results interpretation. In addition, fMRI data can be analyzed with a large quantity of commonly used tools, with minor consensuses on how, when, or whether to apply each one.
This dissertation aims to compile a practical guide of crucial information and essential references to consider in setting up fMRI studies, optimizing data quality, and interpreting results. All the major stages are covered with the aim to ultimately help the fMRI beginner researcher, clinician to consider and overcome the most significant difficulties along the process and expand the use of this imaging technique. To validate this guide two examples of fMRI studies were analyzed, with real data, obtaining results according to similar studies literature.
v
Título: Guia para Imagem por Ressonância Magnética Funcional
Resumo
O cérebro é o órgão mais poderoso e complexo do corpo humano. Constituído por aproximadamente 86 mil milhões de neurões altamente interligados, confere-nos capacidades cognitivas únicas, tais como a criação e compreensão de linguagem, formação de memória, resolução de problemas, ou experienciar sentimentos. O conhecimento profundo da organização e funcionamento do cérebro humano continua a ser um desafio para os neurocientistas, apesar da crescente atenção que tem recebido.
Para auxiliar na pesquisa deste conhecimento, a Imagem por Ressonância Magnética funcional (IRMf) posiciona-se como uma poderosa ferramenta que para além de ser segura, é não-invasiva e proporciona visualizações de alta qualidade das localizações de actividade cerebral resultante de, por exemplo, estimulação sensorial, função cognitiva, ou até mesmo de fluctuações em repouso, sendo por isso amplamente utilizada para o mapeamento do cérebro humano. Permite desta forma o estudo do funcionamento do cérebro saudável, de como é afectado por diferentes doenças, como recupera de lesões, e como fármacos influenciam a actividade cerebral e recuperação de lesões. Apesar de começar por ser uma ferramenta usada para investigação, a IRMf foi rapidamente adoptada para aplicações clínicas, tendo agora uma crescente importância em neuroimagem clínica.
Ganhando crescente popularidade entre médicos e investigadores, IRMf é neste momento uma ferramenta muito promissora no estudo in-vivo do funcionamento do cérebro em humanos. Contudo implica um conhecimento e domínio do seu fluxo de trabalho, nomeadamente desenho do paradigma, artefactos de imagem, definição de protocolos complexos de IRM, uma multitude de métodos de pré-processamento e análise estatística, e finalmente na interpretação dos resultados. Tudo isto usando uma ampla colecção de diferentes softwares, sem que haja consenso em quais são os mais adequados.
Esta dissertação tem como objectivo compilar um guia prático contendo a informação crucial e referencias essenciais à definição, optimização e interpretação de estudos de IRMf. Todas as principais etapas estão cobertas de forma a auxiliar os principiantes em IRMf a considerar e ultrapassar as principais dificuldades normalmente encontradas e assim expandir a utilização desta técnica de imagem médica. Para validar este guia, dois exemplos de estudos de IRMf foram analisados com dados reais e foram obtidos resultados de acordo com os de estudos semelhantes já publicados.
vii
Contents
ABSTRACT ... III RESUMO ... V CONTENTS ... VII LIST OF FIGURES ... IX LIST OF TABLES ... XI LIST OF EQUATIONS ... XI LIST OF ACRONYMS ... XII1 - INTRODUCTION ... 1
1.1-BRIEF HISTORY OF FMRI ... 2
1.2-CONTEXT ... 4
1.3-OBJECTIVES ... 6
2 - APPLICATION FIELDS ... 7
2.1-PRESURGICAL PLANNING AND NEURONAVIGATION ... 7
2.2-EEG-FMRI ... 8
2.3-RADIOTHERAPY ... 8
2.4-CONSCIOUSNESS DISORDERS ... 8
2.5-RESTING-STATE FMRI ... 8
2.6-REAL-TIME FMRI AND NEUROFEEDBACK ... 9
2.7-PHARMACO-FMRI ... 10 2.8-COMMERCIAL APPLICATIONS ... 10 3 - FMRI SIGNALS ... 11 3.1-BOLD ... 12 3.2-ASL ... 14 3.3-VASO ... 14 3.4-SEEP ... 15
3.5–DETECTING NEURONAL OR GLIAL ACTIVITY? ... 16
4 - EXPERIMENTAL DESIGN ... 17
4.1-BLOCK PARADIGM... 18
4.2-EVENT-RELATED PARADIGMS ... 19
4.3-MIXED BLOCK/EVENT-RELATED PARADIGM ... 21
4.4-BOLDCEILING FMRI ... 21
4.5-RESTING STATE PARADIGM ... 22
5 - DATA ACQUISITION AND ARTIFACTS ... 25
5.1-HARDWARE ... 25
5.2-BIOEFFECTS AND SAFETY ... 32
5.3- FMRI DATA ACQUISITION ... 36
5.4-ARTIFACTS ... 39
6 - QUALITY CONTROL AND PREPROCESSING ... 45
6.1-FILE FORMAT CONVERSION ... 46
6.2-SLICE-TIMING CORRECTION ... 47
6.3-MOTION CORRECTION ... 48
viii
6.5-SPATIAL NORMALIZATION ... 50
6.6-TEMPORAL FILTERING ... 51
6.7-SMOOTHING (SPATIAL FILTERING) ... 52
7 - STATISTICAL ANALYSIS OF BOLD FMRI DATA... 53
7.1-GLM-GENERAL LINEAR MODEL... 54
7.2-DATA-DRIVEN,MULTIVARIATE ANALYSIS METHODS ... 60
7.3-GROUP ANALYSIS ... 60
8 - PROCESSING AND VISUALIZATION ... 63
8.1-BRAIN CONNECTIVITY... 63
8.2- FMRISOFTWARE ... 68
8.3-SOFTWARE ANALYSIS ... 72
8.4-VISUALIZATION ... 74
9 - MULTIMODAL NEUROIMAGING ... 79
9.1-STRENGTHS AND LIMITATIONS OF FMRI ... 79
9.2-COMPARISON WITH OTHER FUNCTIONAL IMAGING MODALITIES ... 81
9.3-MULTIMODAL DATA INTEGRATION ... 82
10 - RESULTS INTERPRETATION ... 85
11 - THE FUTURE OF FMRI ... 89
12 - PRACTICAL EXAMPLE OF FMRI STUDIES ... 93
12.1-TASK FMRI ... 93
12.2-RESTING STATE STUDY ... 119
13 - CONCLUSION AND FUTURE WORK ... 139
ix
List of Figures
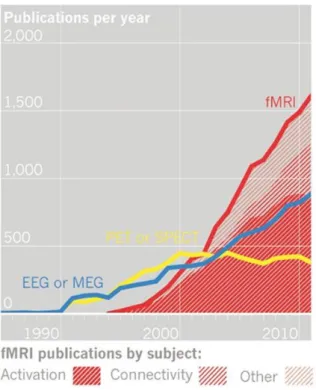
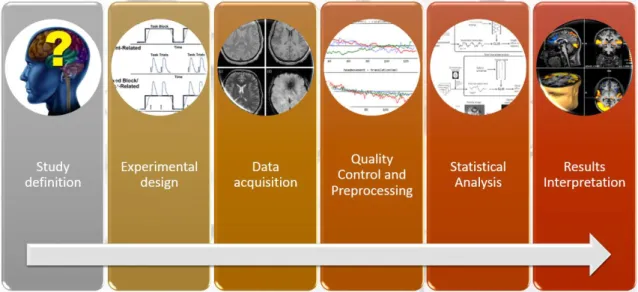
FIGURE 1:EVOLUTION OF NEUROIMAGING PUBLICATIONS.DATA FROM ISIWEB OF KNOWLEDGE [12]. ... 3 FIGURE 2:WORKFLOW OF A TYPICAL FMRI STUDY ... 5 FIGURE 3:SCHEMATIC ILLUSTRATION OF THE ORIGINS OF THE BOLD EFFECT IN FMRI[46]... 12 FIGURE 4:CANONICAL HEMODYNAMIC RESPONSE FUNCTION (HRF).THIS IS THE TYPICAL BOLD RESPONSE TO A SINGLE,
IMPULSE STIMULATION [111]. ... 13 FIGURE 5:SIGNAL ENHANCEMENT BY EXTRAVASCULAR WATER PROTONS,SEEP[122]. ... 15 FIGURE 6:REPRESENTATION OF A VOXEL (VOLUME ELEMENT).REPRESENTED IN RED THE VOXELS WHERE FUNCTIONAL
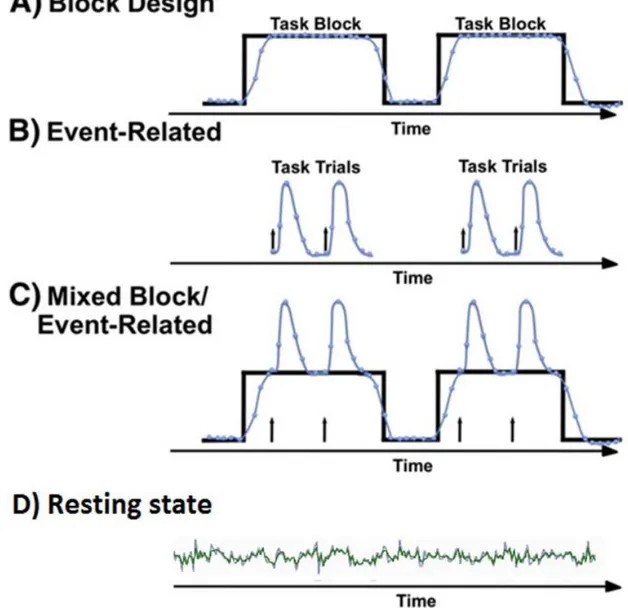
ACTIVATION WAS DETECTED [145]. ... 18 FIGURE 7:TYPICAL FMRI STUDY PARADIGMS ... 20 FIGURE 8:A-DEFAULT MODE NETWORK.B-SOMATOMOTOR NETWORK.C-VISUAL NETWORK.D-LANGUAGE NETWORK.
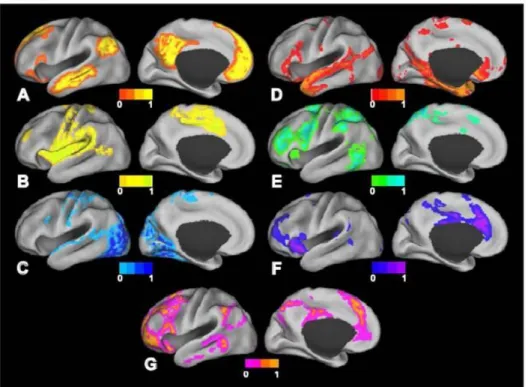
E-DORSAL ATTENTION NETWORK.F- VENTRAL ATTENTION NETWORK.G-FRONTOPARIETAL CONTROL NETWORK [65]. .. 23 FIGURE 9:A SUPERCONDUCTING MAGNET 1.5TSIEMENS MAGNETOM AVANTO MRI SCANNER (SIEMENS,ERLANGEN,
GERMANY) AT HOSPITAL DE BRAGA. ... 27
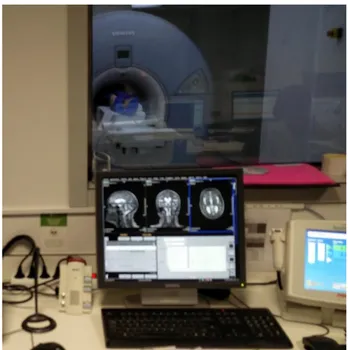
FIGURE 10;HOST COMPUTER OF THE MRI SYSTEM AT HOSPITAL DE BRAGA. ... 30 FIGURE 11:DEMONSTRATION OF VISUAL, AUDIO STIMULI PRESENTATION ACCESSORIES AND BUTTON RESPONSE COLLECTION AT
HOSPITAL DE BRAGA. ... 30 FIGURE 12:STIMULI PRESENTATION, RESPONSE COLLECTION, AND SYNCHRONIZATION SYSTEM AT HOSPITAL DE BRAGA... 32
FIGURE 13:DIFFERENT IMAGE CONTRASTS OF AN AXIAL BRAIN SLICE AT 3T:(A)PROTON-DENSITY-WEIGHTED IMAGE (B)
T1-WEIGHTED IMAGE (C)T2-WEIGHTED IMAGE (D)T2*-WEIGHTED IMAGE [258]. ... 36 FIGURE 14:SCHEMATIC REPRESENTATION OF THE EPI PULSE SEQUENCE (ON THE LEFT) AND CORRESPONDING SAMPLING OF
THE K-SPACE (ON THE RIGHT) FOR IMAGING OF ONE SLICE.ONLY ONE RF PULSE IS USED TO SAMPLE THE WHOLE SLICE
[258]. ... 38 FIGURE 15:RINGING ARTIFACT, MANIFESTS AS SUBTLE HYPOINTENSE LINES OVERLYING CORTEX.INDICATED WITH ARROWS IN
THIS IMAGE [165]. ... 42 FIGURE 16:ALIASING ARTIFACT ON BRAIN MRI WITH FOV=24×18 CM (A).SAME PATIENT WITH FOV=24×24 CM (B)
[259]. ... 42 FIGURE 17:EFFECT OF TEMPORAL FILTERING ON SIMULATED FMRI DATA FOR A SINGLE VOXEL [129]. ... 52 FIGURE 18:BASIC PRINCIPLES OF THE GLM IN FMRI.THE GLM ATTEMPTS TO FIND THE SET OF EXPERIMENTAL PARAMETERS
Β FOR A DESIGN MATRIX G THAT BEST ACCOUNTS FOR THE ORIGINAL DATA Γ, BY MINIMIZING THE UNEXPLAINED ERROR Ε
[43]. ... 56 FIGURE 19:ILLUSTRATION OF THE ANALYSIS STEPS CARRIED OUT IN A TYPICAL FMRI GROUP STUDY [34]. ... 59 FIGURE 20:SCHEMATIC OF AN “IDEAL” CONNECTOMIC MAP.NODE ROLE HETEROGENEITY IS REPRESENTED BY DIFFERENT
COLORS.THE EDGES ARE DIRECTED (ARROWS), WEIGHTED (EDGE THICKNESS) AND ENCODE DIFFERENT FORMS OF INTER
-REGIONAL INTERACTION (SOLID VS BROKEN LINES).THE MAPS ALSO VARY OVER TIME [260]. ... 64
FIGURE 21:ACTIVATION MAP VISUALIZATION IN DIFFERENT PLANES [261]. ... 75 FIGURE 22:SURFACE BASED VISUALIZATION.IMAGES ADAPTED FROM “VISUALIZATION AND QUANTIFICATION OF FMRI
RESULTS”[262]. ... 76 FIGURE 23:3D NODE LINK AND CIRCLE REPRESENTATION OF A RSN.NODES CORRESPONDING MOST CLOSELY TO THE
NETWORK IN QUESTION ARE ISOLATED AND REPRESENTED IN PURPLE WHILE THE OTHERS ARE SHOWN IN BLUE.
x
FIGURE 24:CONNECTIVITY MATRIX AND CORRESPONDING CIRCLE VIEW.STRONGER CONNECTIONS ARE SHOWN IN ORANGE
WHILE WEAKER CONNECTIONS ARE SHOWN IN BLUE [225]. ... 77
FIGURE 25:EEG-FMRI RECORDING HARDWARE SETUP [263]. ... 83
FIGURE 26:THE COLOUR-CODED LINES REPRESENT DISTINCT FUNCTIONAL NETWORKS OF PATIENTS IN VEGETATIVE STATE. DATA COLLECTED FROM THREE DIFFERENT PATIENTS WITH DISTINCT DEGREES OF CONSCIOUSNESS ARE DISPLAYED [264]. ... 91
FIGURE 27:PARTICIPANTS EDUCATION LEVEL ... 93
FIGURE 28:MATLABCOMMAND WINDOW ... 95
FIGURE 29:SPM12MENU WINDOW ... 95
FIGURE 30:SPM12–BATCH EDITOR ... 96
FIGURE 31:MOTION CORRECTION PARAMETERS PLOTS. ... 97
FIGURE 32: NORMALISED MUTUAL INFORMATION HISTOGRAMS. ... 98
FIGURE 33:SPM-CHECK REGISTRATION.ON THE LEFT THE SUBJECT’S IMAGE AND ON THE LEFT AN MNI TEMPLATE. ... 100
FIGURE 34:BEFORE SMOOTHING (TOP) VS AFTER SMOOTHING (BOTTOM) ... 101
FIGURE 35:SEGMENTATION OF STRUCTURAL T1 IMAGE.FROM TOP TO BOTTOM:GM;WM;CSF;BONE; SOFT-TISSUE. .. 102
FIGURE 36:IMAGE RESULTING FROM COMBINATION OF GM AND WM OF ONE SUBJECT. ... 103
FIGURE 37:3D SURFACE MODEL EXTRACTED FROM GM AND WM IMAGES. ... 104
FIGURE 38:REVIEW OF STUDY DESIGN ... 106
FIGURE 39:REVIEW OF PARAMETERS. ... 107
FIGURE 40:BRAIN REGIONS OF SUBJECT SW0081C IN WHICH LOCAL VOLUME WAS SIGNIFICANTLY RELATED WITH WORKING MEMORY.CLUSTERS (>80VOXELS), SIGNIFICANT AT P<0.05(FWE CORRECTED), ARE PROJECTED ON CORONAL, AXIAL AND SAGITTAL SECTIONS.THE COLOR BAR REPRESENTS THE T VALUES. ... 108
FIGURE 41:3D SURFACE MODEL OF A SINGLE SUBJECT OVERLAID WITH ITS INDIVIDUAL STATISTICAL MAP WITH TWO CONTRASTS.RED: NB1>NB0.GREEN: NB2>NB0.THE BOTTOM IMAGE IS AN INFLATED VERSION OF THE SURFACE MODEL. ... 109
FIGURE 42:SPM–REVIEW DESIGN. ... 110
FIGURE 43:BRAIN REGIONS FROM ALL SUBJECTS IN THE GROUP IN WHICH LOCAL VOLUME WAS SIGNIFICANTLY RELATED WITH WORKING MEMORY (NB1>NB0).CLUSTERS (>89VOXELS), SIGNIFICANT AT P<0.001(UNCORRECTED), ARE PROJECTED ON CORONAL, AXIAL AND SAGITTAL SECTIONS OF A TEMPLATE.THE COLOR BAR REPRESENTS THE T VALUES. ... 112
FIGURE 44:BRAIN REGIONS FROM ALL SUBJECTS IN THE GROUP IN WHICH LOCAL VOLUME WAS SIGNIFICANTLY RELATED WITH WORKING MEMORY (NB2>NB0).CLUSTERS (>75VOXELS), SIGNIFICANT AT P<0.001(UNCORRECTED), ARE PROJECTED ON CORONAL, AXIAL AND SAGITTAL SECTIONS OF A TEMPLATE.THE COLOR BAR REPRESENTS THE T VALUES. ... 113
FIGURE 45:STUDY DESIGN OF TWO-SAMPLE T-TEST.GROUP 1: FEMALE SUBJECTS.GROUP 2: MALE SUBJECTS ... 117
FIGURE 46:BRAIN REGIONS IN WHICH LOCAL VOLUME FROM FEMALE GROUP WAS MORE SIGNIFICANTLY RELATED WITH WORKING MEMORY THAN MALE GROUP.VOXEL SIGNIFICANT AT P<0.001(UNCORRECTED), ARE PROJECTED ON CORONAL, AXIAL AND SAGITTAL SECTIONS OF A TEMPLATE.THE COLOR BAR REPRESENTS THE T VALUES. ... 118
FIGURE 47:PARTICIPANTS EDUCATION LEVEL ... 119
FIGURE 48:SCREENSHOT OF A BASH SESSION WITH FSL COMMAND “BET” INSTRUCTIONS ... 121
FIGURE 49:ON THE TOP THE ORIGINAL STRUCTURAL IMAGE, IN THE MIDDLE THE ORIENTED VERSION, AND ON THE BOTTOM THE CROPPED (PART OF THE NECK WAS REMOVED) AND ORIENTED IMAGE. ... 122
xi
FIGURE 51:OVERLAY OF BRAIN MASK ON THE ORIGINAL STRUCTURAL IMAGE. ... 124
FIGURE 52:TIME SERIES OF ONE VOXEL. ... 127
FIGURE 53:MEAN OF FUNCTIONAL IMAGES. ... 128
FIGURE 54:MOTION CORRECTION PARAMETER PLOTS.THE MIDDLE VOLUME IS USED AS REFERENCE. ... 130
FIGURE 55:FSLVIEW GUI–MOVIE MODE ... 130
FIGURE 56:SKULL STRIPPED FUNCTIONAL IMAGE. ... 132
FIGURE 57:FUNCTIONAL IMAGE NORMALIZED TO MNI SPACE. ... 133
FIGURE 58:SPATIALLY SMOOTHED FUNCTIONAL IMAGE ... 134
FIGURE 59:FUNCTIONAL IMAGE WITH NORMALIZED INTENSITIES. ... 135
FIGURE 60:TEMPORALLY FILTERED FUNCTIONAL IMAGE. ... 136
FIGURE 61:INDEPENDENT COMPONENT NUMBER 1 TIMECOURSE AND POWERSPECTRUM OF TIMECOURSE. ... 137
FIGURE 62:COMPONENT NO.1– THRESHOLDED IC MAP.ALTERNATIVE HYPOTHESIS TEST AT P>0.5 ... 138
List of Tables
TABLE 1: FMRISOFTWARE ANALYSIS* ... 73TABLE 2:TEMPLATE OF AN FMRI RESULTS TABLE. ... 74
TABLE 3:PARTICIPANTS DEMOGRAPHIC DATA ... 93
TABLE 4:GREY MATTER REGIONS SHOWING A POSITIVE CORRELATION WITH WORKING MEMORY (NB1>NB0).EACH CLUSTER’S COORDINATES IN MNI SPACE (X, Y, Z), MAXIMUM Z-VALUE AND SIZE ARE GIVEN.FROM CLUSTERS (>89VOXELS), SIGNIFICANT AT P<0.001(UNCORRECTED) DIFFERENT BRAIN REGIONS WERE AUTOMATICALLY LABELED USING AAL2 TOOLBOX FOR SPM WITH THE ROI_MNI_V5 ANATOMICAL PARCELLATION DATABASE. ... 114
TABLE 5:GREY MATTER REGIONS SHOWING A POSITIVE CORRELATION WITH WORKING MEMORY (NB2>NB0).EACH CLUSTER’S COORDINATES IN MNI SPACE (X, Y, Z), MAXIMUM Z-VALUE AND SIZE ARE GIVEN.FROM CLUSTERS (>75VOXELS), SIGNIFICANT AT P<0.001(UNCORRECTED) DIFFERENT BRAIN REGIONS WERE AUTOMATICALLY LABELED USING AAL2 TOOLBOX FOR SPM WITH THE ROI_MNI_V5 ANATOMICAL PARCELLATION DATABASE. ... 115
TABLE 6:PARTICIPANTS DEMOGRAPHIC DATA ... 119
List of Equations
EQUATION 1:LARMOR EQUATION IN MRI[142]. ... 26EQUATION 2:SIGNAL-TO-NOISE RATIO IN MRI ... 37
EQUATION 3:GENERAL LINEAR MODEL EQUATION ... 55
xii
List of Acronyms
2D Two-Dimensional 3D Three-Dimensional ATP Adenosine Tri-Phosphate ASL Arterial Spin Labeling ANOVA Analysis of Variance ANCOVA Analysis of Covariance
AFNI Analysis of Functional NeuroImages BCI Brain-Computer Interface
BCT Brain Connectivity Toolbox
BOLD Blood Oxygenation Level Dependent CO2 Carbon Dioxide
CBF Cerebral Blood Flow CBV Cerebral Blood Volume
CMRO2 Cerebral Metabolic Rate of Oxygen
CT Computed Tomography CSF Cerebrospinal Fluid CNR Contrast-to-Noise Ratio
CVU Connectome Visualization Utility DTI Diffusion Tensor Imaging dMRI Diffusion MRI
DC Direct Current
DCM Dynamic Causal Model EPI Echo-Planar Imaging EEG Electroencephalography EV Explanatory variables FA Flip Angle
FDR False Discovery Rate FCA Fuzzy Clustering Analysis FOV Field of view
FWEs Family-Wise Errors
fMRI functional Magnetic Resonance
Imaging
FWHM Full Width at Half Maximum
fNIRS functional Near Infrared Spectroscopy FSL FMRIB Software Library
GLM General Linear Model
GE Gradient Echo
GRE Gradient Refocused Echo
HRF Hemodynamic Response Function Hb02 Oxygenated Hemoglobin
Hb Deoxygenated Hemoglobin ICA Independent Components Analysis LCD Liquid-Crystal Display
MEG Magnetoencephalography MRI Magnetic Resonance Imaging MVPA Multi Voxel Pattern Analysis MNI Montreal Neurological Institute NMRI Nuclear Magnetic Resonance Imaging PCA Principal Components Analysis PET Positron Emission Tomography PLS Partial Least Squares
PNS Peripheral Nerve Stimulation PSF Point Spread Function RF Radiofrequency rtfMRI Real-time fMRI RS-fMRI Resting State fMRI RSN Resting State Network ROIs Region of Interest SAR Specific Absorption Rate SNR Signal-to-Noise Ratio SEM Structural Equation Modelling
SEEP Signal Enhancement by Extravascular
Water Protons
SPM Statistical Parametric Mapping T Tesla TR Repetition Time TE Echo Time TI Inversion Time VASO Vascular-Space-Occupancy V Voxel Volume QA Quality Assurance
1
1 - Introduction
We are living in an exciting era, marked by an unprecedented rate of technological changes and constant advances in multiple domains that include engineering, life sciences and healthcare. In this process, Biomedical Engineering positions itself as a crucial class to make the link between these different areas and boost the creation of outstanding inventions that ultimately help people to live a better, longer and healthier life.
Many of the advances have been fueled by the continuously increasing computational power and potentiated by information technologies. From its application to the medical domain, the specific branch of Medical Informatics emerges from the Biomedical Engineering field. It is now a difficult exercise to imagine healthcare being provided without, for example, the use of digital imaging applications or where the patients’ medical record is not stored electronically. On the other hand, it is a relatively easy exercise to imagine a future where for example image guided robot-assisted remote telesurgery, or brain-computer interfaces will become common practice.
There are many specialties within Medical Informatics that have revolutionized healthcare; one good example is Medical Imaging. Being defined as a relatively new multidisciplinary field that intersects with the biological sciences, health services, information sciences and computing, medical physics, and engineering, it touches every aspect of the imaging chain and forms a bridge between imaging and other medical disciplines [1]. Within the most used medical imaging modalities one will find X-rays, ultrasound, nuclear medicine and Magnetic Resonance Imaging (MRI). The latter is of particular interest as it is non-invasive, not using ionizing radiation, and portray anatomical details with superior resolution (on the order of 1 mm or better), in three dimensions, allowing excellent differentiation of soft tissues.
Since its inception, medical imaging has provided a huge contribute to the understanding of the structure and functioning of the different components of the human body. However, our expedition seems to be just starting when it comes to the most mysterious and complex organ in our body, the human brain. From all the human
2 body structures, brain outstands as being essential to life, commanding and controlling all the body. Due to the difficulty in accessing its complex network of interactions it is one of the most difficult organs to study and understand, both in structure and in function. The area responsible for studying the structures of the brain and its respective functions through the use of imaging techniques is called Neuroimaging and has several modalities such as Positron Emission Tomography (PET), Computed Tomography (CT), Electroencephalography (EEG), Magnetoencephalography (MEG), and MRI.
Neuroimaging can be divided into its two interconnected categories, structural and functional neuroimaging. Within functional neuroimaging, the most used technique is functional Magnetic Resonance Imaging (fMRI), which is a powerful non-invasive tool, that uses MRI technology to detect neuronal activity, being used, for example, by psychologists, psychiatrists, and neurologists, to study how the human brain functions and is organized.
1.1 - Brief history of fMRI
MRI is based on the principles of nuclear magnetic resonance (NMR); a spectroscopic technique used to acquire microscopic chemical and physical information about molecules [2]. The beginning of this new science field is recognized to Bloch and Purcell who independently discovered NMR in 1946 [3] [4] [5]. They figured out that it was possible to detect a signal (voltage in a coil) when one places a sample in a magnetic field and irradiate it with radiofrequency (RF) energy of a certain frequency, the resonant or Larmor frequency. The signal is produced by the interaction of the sample nuclei with the magnetic field.
A few decades later, in 1973, Lauterbur [6] and simultaneously Mansfield [7] used the previously mentioned discoveries and added to it magnetic field gradients. This development allowed them to acquire spatial information in NMR experiments, and with that to produce the first 2D and 3D images by NMR, known as MRI. It might be more accurate to refer to this field as Nuclear Magnetic Resonance Imaging (NMRI) rather than MRI, but because of the negative connotations associated with the word
3 nuclear during the cold war years, this word has been suppressed, having the public and the profession embraced the MRI acronym. Although, the nuclear component simply refers the role of the ‘spin’ of the nucleus in the process [8].
In the late 1970´s the introduction of Fourier transform imaging techniques by Ernst [9], and the development of echo-planar imaging (EPI) technique by Mansfield [10] have tremendously accelerated the development of MRI, setting the foundations to decrease the imaging time from hours to just a few seconds.
In 1990 Ogawa [11] discovers the contrast dependent on blood oxygenation (stated as BOLD – blood oxygenation level dependent) and since then fMRI use has grown exponentially, as it can be observed by the number of fMRI publications in figure 1 [12].
Figure 1: Evolution of neuroimaging publications. Data from ISI Web of Knowledge [12].
4
1.2 - Context
The exponential growth of fMRI studies arises from its capacity to give high-quality visualization, typically displayed as a statistical map, of the location of activity in the brain, resulting from sensory stimulation, cognitive function or even resting state fluctuations. Compared to other functional neuroimaging methods, fMRI offers much higher spatial resolution and it is entirely non-invasive, which has allowed to improve the mapping of the functional parcellation in the human brain [13].FMRI is now well established in many centers, and to support its ever-increasing availability is the fact that it uses similar imaging techniques and the same equipment as conventional MRI, which is extensively used for radiological diagnosis.
The main concept behind fMRI is that, as the neurons in the brain function, they consume glucose and oxygen, supplied by the blood flow. The higher the neuronal activity in one location of the brain is, the more blood and, therefore, the more oxygen, flows there. The blood oxygen levels also vary proportionately to how quickly the active neurons are consuming oxygen; the higher the activity, the faster oxygen is consumed [14]. The majority of the fMRI techniques are based on the detection of the localized MRI signal variations linked to increased blood flow at sites of neural activity, such as may be produced, for example, by a stimulus or task. It takes advantage of the oxygenation-dependent magnetic properties of hemoglobin and its interaction with the surrounding, the so-called blood oxygenation level dependent (BOLD) contrast. Specifically, deoxygenated hemoglobin tends to reduce the local MR signal within and around the blood vessels [15].
There is a long tradition in fMRI neuroscience to investigate the differential neuronal responses to stimuli and activity during task performance. Typical studies involved comparing periods of brain activation during a task against periods of a matched baseline task or a “rest” condition (supposed that neural circuits were apparently quiescent without an external stimulus) [16-20]. However, evoked activation is in fact, only the tip of the iceberg in brain functioning. More recently, a new perspective in functional imaging has brought the recognition that spontaneous/intrinsic brain activity is crucial to the normal brain functioning. Technical advances in neuroimaging methods have contributed to this paradigm shift, instigating
5 new insights to interpret the brain as a network of functionally connected (co-activated) interacting regions, focused on understanding patterns of activation rather than localized blobs [21-27]. Refer to figure 1 for fMRI “activation vs. connectivity” publications plot.
Constantly gaining increased popularity among clinicians and researchers, fMRI is presently a promising tool for studying the brain function in living humans, both in healthy conditions and in disease. However, it has a complex workflow (summarized in figure 2) that implicates knowledge of paradigm design, imaging artifacts, complex MRI protocol definition, a multitude of preprocessing and analysis methods in several software packages, statistical analyzes, and in results interpretation. In addition, fMRI data can be analyzed with a large quantity of commonly used tools, with minor consensuses on how, when, or whether to apply each one. This situation may introduce considerable variability in the analysis outcome. A recent publication [28] identified 6912 slightly different paths through the analysis pipeline, resulting in 34560 different sets of results for the same dataset. Several papers and books describing the main technical issues and pitfalls related to both intrinsic and evoked fMRI analyses have been published [29-36].
However, given the exceedingly complex data processing, constant methodological advances and the increase in fMRI applicability across clinical and research domains it becomes tough for newcomers to fMRI to know even where to start on such a complex information scattered space.
6
1.3 - Objectives
Taken into consideration the complexity previously described, this dissertation aims to compile a practical guide of crucial information and essential references to consider in setting up fMRI studies, optimizing data quality, and interpreting results. All the major stages are covered with the aim to ultimately help the fMRI beginner researcher and clinician to consider and overcome the most significant difficulties along the process, expanding the use of this imaging technique. To validate the proposed guide, 2 practical cases will be analyzed, one with task stimulation and one during resting-state fMRI, reporting all the workflow details from the fMRI idea to the final results interpretation.
7
2 - Application fields
In the last 25 years, fMRI has grown, matured and gained widespread acceptance and utilization. With a vast impact in the neuroscience domain, it has overtaken other modalities as the predominant mean for detecting changes in brain activity [37-40]. As previously mentioned, fMRI can give high visualization quality of the location of activity in the brain resulting from, for example, sensory stimulation, cognitive function or motor function, being then widely used for mapping the human brain. It allows the study of how the healthy brain works, how it is affected by different diseases, how it recovers from damage and how drugs can modulate activity or post-lesion recovery [31, 34, 41-43].
2.1 - Presurgical planning and neuronavigation
Starting purely as a research tool, fMRI was quickly adopted for clinical purposes and has now a limited but growing role in clinical neuroimaging. The best developed clinical application involves the use of fMRI for presurgical evaluation of functional areas prior to brain surgery [44]. Preoperative mapping has revolutionized the neurosurgical care of brain tumor patients and is now a valid and widely available clinical application of fMRI [45]. By mapping, for example, brain auditory, visual, motor and language areas, and identifying healthy brain tissue near a site of operable brain abnormality, it serves as a tool to determine resectability, to estimate surgical risk and the necessity for intraoperative monitoring [46-48]. Maximizing resections more safely have improved diagnosis, optimized treatment algorithms, and significantly decreased potentially devastating postoperative deficits associated with injury to functional brain networks [49, 50]. Although fMRI is a useful preoperative tool, it is not perfect. Tumors and vascular malformations can affect the normal vascular coupling of neuronal activity, the basis of BOLD fMRI, and thereby produce false-negative fMRI results. Due to this limitation fMRI is typically used as a complement to other methods, typically integrated into neuronavigation systems. To cross-validate fMRI results, each fMRI activation cluster is usually verified by intraoperative electrocortical stimulation during awake surgery [51, 52].
8
2.2 - EEG-fMRI
The multimodal EEG-fMRI approach, by combining evoked potentials with fMRI, presents an accurate way to detect eloquent cortical areas, assisting in the planning of neurosurgery or rehabilitation, and overcoming the previously mentioned limitation of fMRI, especially concerning its temporal resolution. Currently, the most promising application of this technique lies in epileptic surgery, through the detection of cortical areas involved in epileptic activity [53-55].
2.3 - Radiotherapy
The identification of functionally critical areas by fMRI, complemented by Diffusion Tensor Imaging (DTI), allows target delineation and critical organ avoidance when constructing treatment plans for brain radiotherapy. It constitutes a major step forward as conventional radiotherapy of brain tumor is ineffective, due to imprecisions in target delineation, inadequate radiation dose, and difficulties in identifying radio-resistant high-grade tumor for dose escalation [56-58].
2.4 - Consciousness disorders
An emerging field of clinical application for fMRI (specifficaly resting-state) is the evaluation of cerebral function in patients with consciousness disorders such as coma, vegetative states or minimally conscious state [59-61]. Neuroimaging, including fMRI, has started a new era of coma and consciousness science. It is transforming the clinical care, diagnosis, and prognosis of patients suffering such disorders, with profound implications in the ethical and medical–legal decision-making process. It is also starting to address more basic scientific questions regarding the nature of consciousness and the neural representation of thoughts and intentions [62, 63].
2.5 - Resting-State fMRI
The study of consciousness and differential diagnosis of its disorders is supported, in between others, by an emerging method of fMRI which is resting state
9 fMRI (RS-fMRI). It is distinctive for measuring spontaneous low-frequency fluctuations in the BOLD signal, occurring in the absence of a task or stimulus, and investigates synchronous activations between regions that are spatially distinct, in order to identify resting state networks (RSNs).
Though clinical applications of RS-fMRI are still limited, many prospective clinical applications are being explored, including presurgical planning for brain tumor and epilepsy patients, and the identification of biomarkers for the diagnosis of Alzheimer disease and various other neurologic and psychiatric illnesses (e.g. Multiple Sclerosis, Parkinson) [27, 64-67]. In addition, RS-fMRI is used in combination with other MRI techniques to study in vivo human brain development, perinatal brain injury and developing brain of premature births. Being noninvasive and not demanding patient collaboration makes RS-fMRI particularly advantageous for use with patients who are not capable of following the currently available methods of fMRI paradigm studies [68, 69]. A novel approach has just been published, and it is believed to finally widespread the clinical application by reliably providing a unique, personalized map of the different functional networks of an individual’s brain [70].
2.6 - Real-time fMRI and neurofeedback
Another technique that received increased attention in recent years is real-time fMRI (rtfMRI) and specifically its application to neurofeedback, i.e. biofeedback of neuronal responses. In rtfMRI technique, the fMRI data is simultaneously processed and presented, as it is being acquired, in nearly real-time, and in an incremental way (new incoming data is included in the statistical model as it is acquired) [71]. This can be used as immediate data quality assurance; control changes of subject’s attention and performance; rapid functional localizers guiding the main fMRI experiment or surgical interventions; and brain–computer interfaces (BCI) for neurofeedback, in which the subject sees images of its own brain activations, in real time while laying in the scanner. rtfMRI allows for BCI with a high spatial and temporal resolution and whole-brain coverage, which is capable of translating brain activity into digital code and be used for communication and control of devices. Its clinical application with the most potential is the use of rtfMRI-BCI to neurofeedback, allowing the subjects to acquire control over
10 their own brain activity. In patients with neuropsychiatric disorders, this control can potentially have therapeutic implications. Promising results have been achieved in disorders such as chronic pain, Parkinson disease, tinnitus, stroke, depression, and schizophrenia. The potential use of neurofeedback as a supplementary treatment is not limited to psychiatric diseases but might also be applied to lifestyle diseases such as obesity or addiction [71-80].
2.7 - Pharmaco-fMRI
As mentioned already, fMRI has the potential to provide biomarkers for several diseases and disorders, thus facilitating diagnosis and helping to predict which individuals are at higher risk to later develop the disorder. In addition, it provides a scientific basis for the development of novel pharmacological approaches [81-83]. fMRI offers an unparalleled opportunity to assess and compare how different drugs affect human brain activity and to provide systems-level predictions for how new drugs will affect the brain. Such key metric can increase confidence in early decision-making, thereby improving success rates, reducing risk, development times and costs of drug development, ultimately accelerating drug discovery [84-90]. The growing interest in pharmaco-fMRI is confirmed by the more than 455 different drugs being investigated worldwide in 438 fMRI clinical studies, out of a total of 1423 currently registered at the U.S. National Institutes of Health [91].
2.8 - Commercial applications
There have been several projects to capitalize on fMRI, all being quite controversial and raising social, ethical and legal issues [92]. Investigation in the neurolaw field is increasing, and some tentative have been made to bring fMRI to the court, though not being yet considered sufficiently reliable to be considered as evidence. Lie detection using fMRI has been performed, and even two companies have been set up in North America offering this service [93-97]. On a purely business field, several neuromarketing companies are using fMRI to gain insights into consumer thought and behavior [98, 99].
11
3 - fMRI Signals
The human brain represents only 2% of the total body mass, however, it consumes 20 to 25% of all the energy that the body produces in its basal state. For all the neural signaling processes it requires energy in the form of adenosine triphosphate (ATP). Despite this vital high cerebral energetic demand the brain has very limited means of energy storage, therefore, normal brain activity depends on the continuous supply of oxygen and glucose through cerebral blood flow (CBF). To enable neuronal function and respond to peaks of energy demand, the brain has developed mechanisms that increase the flow of blood to regions in which neurons are active, a process designated as hemodynamic response to the neural event. Hence, local brain activity has to be matched with a concomitant increase in local CBF, the neurovascular coupling, constituting this phenomenon the key of fMRI signal [100-103].
The exact mechanisms of neurovascular coupling are unknown, but one well-accepted theory is that, as mentioned before, when a task activates a region or network of brain regions there is a local increase in energy demand, resulting in increased cerebral metabolic rate of oxygen (CMRO2) in the vicinities of active brain region(s)
[104]. As glycolysis transiently consumes the local reserves of oxygen in tissues adjacent to capillaries, byproducts build up, and various chemical signals (CO2, NO, H+) trigger a
vasomotor reaction in arterial sphincters upstream of the capillary bed, with consequential dilation of these vessels. The increased blood flow acts to restore the local [O2] level required to overcome the momentary deficit. However, still inexplicably,
more oxygen is delivered than what’s needed to simply balance the increase in CMRO2.
This results in an initial build-up of deoxygenated hemoglobin [Hb] and a decrease in oxygenated hemoglobin [HbO2] in the intra- and extravascular spaces. Followed, within
a second or two, by a vasodilatory response that reverses the situation to result in a decrease in [Hb] and a significant increase in [HbO2] compared to the resting condition
[100, 105, 106]. This locally increased CBF and changes in hemoglobin oxygenation (BOLD contrast) can be detected by MRI and are the source of fMRI signals.
12
3.1 - BOLD
S. Ogawa has first demonstrated BOLD contrast in 1990 [11, 107, 108] and since then it was adopted by most of the fMRI studies. Such that it is commonly mistakenly assumed that ‘fMRI’ means ‘BOLD’, and vice-versa, when in fact these have two very different meanings.
The exact mechanisms of neurovascular coupling are unknown, but the physical origins of the BOLD signal are reasonably well understood. The BOLD contrast is closely linked to a physical phenomenon called magnetic susceptibility, and its difference in oxy- and deoxy- hemoglobin. Susceptibility quantifies the degree to which a substance becomes magnetized when it is placed in an external magnetic field, in this case, the MRI scanner. When matter interacts with the magnetic field, an internal magnetization or polarization (J) is created that either opposes (diamagnetism) or augments the external field (paramagnetism) [109].
Nearly all biological tissues are weakly diamagnetic. This includes fully oxygenated hemoglobin (HbO2) which consequently is
magnetically indistinguishable, in terms of susceptibility, from brain tissue. However, fully deoxygenated hemoglobin (Hb) has four unpaired electrons and is highly paramagnetic [110] being then a natural contrast agent for MRI [11, 108]. Its presence in the blood leads to susceptibility gradients, i.e. local non-uniformities in the magnetic field. These gradients exist mainly near the vessels because of their high Hb
content, and their size and strength depend on the vessel size and Hb concentration among other things. Spins within these microscopic gradients experience additional dephasing, which leads to MRI T2* based signal loss, as represented in figure 2 [13].
Figure 3: Schematic illustration of the origins of the BOLD effect in fMRI [46].
13 Thus, by making the MRI acquisition sensitive to T2* it is possible to detect tiny signal variations, caused by brain activity, which follow the hemodynamic response function (HRF) profile. The maximum signal variation is typically in the order of ~2 to 3% and is delayed of around ~5 to 6s from the stimulus. Subsequently, when the stimulus is turned off, the signal takes ~10 to 12s to return to baseline. However, instead of returning directly back to baseline, the BOLD signal decreases below its initial level for a short period, referred to as the post-undershoot [105]. This relatively long hemodynamic response was initially considered a limiting factor for the temporal resolution of fMRI studies. Though with experimental design techniques, it is possible to improve significantly the temporal resolution [111].
It is important to highlight that the activation signal measured with BOLD fMRI is based on indirectly measuring changes in the concentration of deoxyhemoglobin that arise from the increase in blood oxygenation in the vicinity of neural firing. This signal is dependent on both the underlying physiological events and the imaging physics. BOLD contrast, although sensitive, is not a quantifiable measure of neural activity [112].
Figure 4: Canonical hemodynamic response function (HRF). This is the typical BOLD response to a single, impulse stimulation [111].
14
3.2 - ASL
Another way to sense brain activity is by detecting changes in local CBF. These changes can be observed using an injected contrast agent and perfusion-weighted MRI, first demonstrated by Belliveau [113], or non-invasively by arterial spin labeling (ASL) [100, 114].
ASL is a magnetic resonance method for the measurement of cerebral blood flow. In this technique, intravascular water flowing to the brain is saturated in the neck region with a slice-selective saturation imaging sequence, generating an endogenous tracer in the form of proximally saturated spins. These magnetically labeled water molecules flow to the activated brain region and interact with tissue water, altering the tissue magnetization and consequently the MR signal [114]. In its simplest form, the perfusion contrast revealed by this technique comes from the subtraction of two sequentially acquired images: one with, and the other without, proximal labeling of arterial water spins [115].
The utility of ASL perfusion fMRI in drug development and validation is currently being explored. ASL methods are quantitative, stable over time and less variable across subjects. These properties make ASL an especially useful noninvasive method to measure CBF in longitudinal and treatment studies [116]. It is also well suited for examining neural responses to pharmacological agents and abstinence states as these are sustained effects lasting hours or longer [117].
However, compared with the BOLD contrast method, ASL suffers from reduced sensitivity, presents longer acquisition time, and increased sensitivity to motion. Therefore, its use is more centered in modeling the neurobiological mechanisms of activation and vasoreactivity, rather than in standard mapping of brain function [33, 100, 104, 106].
3.3 - VASO
Vascular-Space-Occupancy (VASO) fMRI is a non-invasive, dynamic, and repeatable method for mapping brain function based on changes in Cerebral Blood Volume (CBV). It explores the T1 differences between blood and adjacent tissue and
15 uses an inversion recovery pulse sequence to attenuate blood signal while maintaining part of the tissue signal. When neural activation causes CBV to increase, the VASO signal shows a decrease, allowing the detection of activated regions in the brain. This technique complements the previously referred fMRI methods, BOLD and ASL, providing a better understanding of the metabolic and hemodynamic changes resultant from neural activation and also improving the quantification of extravascular BOLD signals. Its sensitivity is the primary disadvantage when compared with BOLD but with technical developments in image acquisition and processing, VASO fMRI has the potential to be a valuable tool in neuroscience and clinical applications [118, 119].
3.4 - SEEP
Signal enhancement by extravascular water protons (SEEP) is a contrast mechanism for fMRI that rose from the findings that at short echo times, spin-echo sequences showed signal changes with significant deviations from the BOLD model, suggesting a second, non-BOLD component of signal change [120].
SEEP contrast is based on variations in tissue water content that result from the increased production of extracellular fluid, together with neuron and neuroglia cellular swelling at sites of neuronal activity [121]. As the primary sources of MRI signal in biological tissues are water and lipids, a rise in tissue water content leads to a local increase in MR signal intensity. These image contrast changes correspond to changes in neuronal activity, and as such changes are independent of magnetic susceptibility, SEEP
16 offers new and improved possibilities for carrying out fMRI in regions that may not be ideal for BOLD imaging. Such as those near air–tissue and bone–tissue interfaces as well as regions close to large blood vessels [122].
3.5 – Detecting Neuronal or Glial activity?
In the neuroscience community, there is a consensus that despite its immense complexity, the human nervous system, in its most elementary form, is composed of two general cell types – neurons and neuroglia. However, concepts of how neuronal activity is coupled with the vascular supply of glucose and oxygen are the subject of intense debate and are changing rapidly.
Traditionally, it was thought that active neurons generate a metabolic signal (CO2, NO, H+) which triggers an increase in blood flow. This idea has recently been
challenged, following the discovery that neurotransmitter-mediated signaling, particularly by glutamate, has a major role in regulating cerebral blood flow and that much of this control is mediated by astrocytes – a particular type of neuroglia [101]. Furthermore, it is suggested that astrocytes are responsible for the metabolic and hemodynamic changes detected with fMRI [123].
Several studies [101, 103, 123-126] have revealed that most functional neuroimaging techniques (including those based on BOLD, VASO, ASL, SEEP) are, in fact, more closely tied to the underlying functioning and metabolic activity of astrocytes than of neurons [127]. Additional findings by Yevgeniy B. Sirotin, also contest the current understanding of the connection between brain hemodynamics and local neuronal activity. They suggest the existence of a mechanism in the brain that brings additional arterial blood to cortex in anticipation of expected tasks [128].
In light of these recently reported disparities between hemodynamic and neurophysiological changes some investigators are suggesting that a revised interpretation of functional neuroimaging signals is necessary and that it might involve going beyond the traditional assumption that these signals are based exclusively on neuronal processes [123].
17
4 - Experimental Design
fMRI is based on detecting the slight MR signal variations indirectly caused by neural activity. Therefore, it is crucial to induce a signal that is as strong as possible. A key concept that is common to every fMRI study is that the neuronal activity of interest must be systematically optimized so that any voxels that change signal intensity in relation to this activity can be detected. Typical fMRI studies compare sets of images, acquired during two or more different conditions, using some form of statistical analysis. Multiple recordings of the MRI signal allow a degree of signal averaging that increase the statistical reliability of the results. The focus of fMRI study design is, therefore, to determine which tasks or stimuli can be compared to reveal the optimal neuronal activity of interest, and the most efficient timing for applying it [34, 46, 129].
It is important to design the study to detect specifically the function(s) of interest, unambiguously from other neuronal functions or other sources of signal change, such as random noise and physiological motion (respiration and cardiac pulsatility). The choices of tasks or stimuli and how they will be compared must be guided by a clear hypothesis, which is a statement of the proposed result, formed in a way that it can be tested, and shown to be either true or false. By having a clearly defined question to answer, the expected result can often be stated as the hypothesis, being often this the first step to take when defining a new fMRI study [129].
Commonly, an fMRI task activation experiment utilizes visual, auditory or other stimuli to alternately induce two or more different mental states in the subject while continuously collecting MRI volumes. With a two-condition design, one state is called the experimental condition, while the other is denoted the control/baseline condition, and the goal is to test the hypothesis that the signals differ between the two states [100]. There is no single fMRI study design that is optimal for all situations. Therefore, researchers have developed different approaches to design the fMRI studies. The main ones will be discussed in this chapter. By understanding the key elements that affect the sensitivity and effectiveness of fMRI results, and by having a precise question to investigate, many of the design choices become clear. It is important to remark that there are several software packages that, in addition to present the stimuli to the subjects, help the researcher to define and simulate the intended study design [129].
18
4.1 - Block paradigm
The classic design of an fMRI experiment is a block design of stimulus presentation, with individual trials or events tightly clustered into “on” periods of activation alternated with equally long “off” control/baseline periods [130]. In a typical study, task blocks duration range from ~16s to a minute and, multiple task blocks will be presented in a single fMRI run (continuous period of data acquisition), to allow the contrast of fMRI signals [131]. With this design, the neural activity produces a relatively strong BOLD response that reaches a peak after about 6s and images can be obtained at multiple time points during the response so that it can be detected with high sensitivity [129].
The voxels within the brain that are affected by the stimulus provide a set of data points in which the signal intensity alternate in synchrony with the stimulation, as a result of the BOLD effect. By detecting which voxels show this alternating pattern, different functional areas of the brain can be identified [46].
Figure 6: Representation of a Voxel (volume element). Represented in red the voxels where functional activation was detected [145].
The block design is easy to implement and can be used to identify and localize several basic functions as: (i) primary sensory areas, e.g., by presenting auditory stimuli versus silence; (ii) motor areas, by finger tapping versus no movement; (iii) higher-order visual areas, by displaying faces versus objects and identify regions that respond
19 preferentially to faces; and (iv) higher-order language areas by presenting speaking versus other complex sounds [46].
Furthermore, while this method provides optimum statistical power, it also presents a variety of potential confounds, including changes in attention, alertness, expectancy, task habituation and practice effects within and between blocks [132].
4.2 - Event-related paradigms
An alternative to block design is to present the stimulus in an unpredictable and randomized sequence, the event-related paradigm. This technique is used since decades by EEG studies, and while it offers many advantages, it comes with certain costs. Each stimulus will evoke BOLD activity that is only a fraction of the maximum possible. Therefore, by reducing the mean number of stimuli presented per second, there is a reduction both in the absolute magnitude of BOLD signal and the resulting signal contrast between conditions [132]. Many repetitions are necessary to compensate for the lower signal-to-noise ratio. Consequently, it frequently takes longer to acquire sufficient data in event-related designs than for blocked studies, which can lead to fatigue of the subjects and, particularly in clinical patients, less tolerance and compliance with the fMRI paradigm [32].
The temporal dispersion of BOLD fMRI activity makes it challenging to perform rapid event-related paradigms using fMRI. If the interval between stimuli is sufficiently long (i.e., greater than about 10 s), the hemodynamic response decays to baseline after each stimulus. However, when events are considerably close together, special analysis procedures are used to separate their hemodynamic responses [43], in which the fMRI response is modeled as the linear summation of the hemodynamic response of discrete events [133].
By modeling brain function as a series of transient changes, rather than as an ongoing state, event-related fMRI allowed researchers to create much more complex paradigms and more dynamic analysis methods [134]. This flexibility is possible due to the assumption that the fMRI response to external stimuli is approximately the response of a linear time-variant system [133]. However, some contradict this
20 assumption, as it will not account for the (in particular higher level) neuronal processing occurring in most cases. There is also evidence of an upper limit for the maximum BOLD response, which implies that various cognitive processes cannot simply add up linearly or nonlinearly to ever-increasing BOLD responses [32, 135].
Although presenting some limitations, event-related designs are now a standard part of the fMRI experimental repertoire.
21
4.3 - Mixed block/event-related paradigm
Although block and event-related designs brought many insights into brain functions, researchers identified that these fMRI design types ignored components of the BOLD signal that could provide additional information. The development of the mixed block/event-related fMRI design allowed for a broader characterization of nonlinear and time-sensitive neuronal responses [19].
In the mixed design, control blocks are interleaved with task blocks, during which trials are presented at varying intervals. Mixed designs allow researchers a mean to examine brain activity associated with continuous processes, potentially related to task-level control signals. Neural activity linked to task state can be distinguished from activity related to individual trials. This dissociation of effects with different temporal profiles should allow researchers to determine better which functions are served by particular activation patterns [136].
4.4 - BOLD Ceiling fMRI
The need of repetitive ON-OFF periods demonstrates a limitation of standard fMRI when mapping continuous activations, such as, for example, in subjects suffering chronic tinnitus (subject continuously hears noise or ringing even when no external sound is present). One solution to circumvent this limitation is to apply carbon dioxide (CO2) as a potent vasodilator. CO2 induces a BOLD response in the entire brain. The
neurovascular coupling in conjunction with the limited cerebral vasodilation implies a limitation or ceiling of the BOLD response. Since the cerebral vasodilatation is limited, active areas with a preexisting BOLD response related to the task or stimulation can be detected because these areas have a diminished CO2-induced BOLD response. This
concept of BOLD ceiling fMRI was successfully demonstrated for continuous auditory activations in healthy volunteers. BOLD ceiling fMRI offers a complement to standard fMRI for those conditions where ON–OFF paradigms are impossible [32, 135].
22
4.5 - Resting state paradigm
Resting state fMRI (RS-fMRI) has become widely accepted as a viable technique for studying functional connectivity of the human brain [137]. Several electrophysiology studies aided in the acceptance of the resting-state paradigm as a valid neuroscience method for functional connectivity. RS-fMRI focuses on spontaneous low-frequency fluctuations (~0.1 Hz) in the BOLD signal and in some of these studies, it was shown that an extended coherent network of neurons activates simultaneously in the absence of any external stimulus [138]. This observation of the spontaneous firing of a group of neurons was direct evidence that, at rest, the brain is capable of activating coherent networks of neurons, the so-called resting state networks (RSNs) [137]. However the concrete meaning of these inherent processes, seemingly fundamental to the human neural functional architecture, remains elusive [66].
Numerous group resting-state studies have since then consistently reported the formation of functionally linked RSNs during task-free paradigms. These studies, although all using distinct groups of subjects, methods, and types of MR acquisition protocols, show significant concordance between their results, indicating the robust formation of functionally linked RSNs in the brain during rest. The amount and precise spatial pattern of distinct RSNs vary in the literature. Figure 7 displays the surface plots of the most consistent reported RSNs [139].
A relatively reduced number of data points, compared to task fMRI, are sufficient to identify RSNs, with the additional advantage that multiple functional networks can be derived from the same dataset. Therefore less scanning time is necessary, with typical resting experiments lasting approximately 5-10 min, in during which the subjects are instructed to relax and “think about nothing in particular” while keeping their eyes either closed or fixated on a crosshair for the duration of the scan. There is little consensus on the optimal length of a resting state session and if multiples sessions are needed. Having eyes open or close in awake subjects or having asleep subjects is also point of discussion among researchers [66, 140].
23 Resting state is characterized by its simple experimental design and short time to acquire a dataset from which multiple RSNs can be identified. The minimal demands on clinician and patient allow its implementation for patients with neurological deficits that are not capable of following the other currently available methods of fMRI experimental design paradigms.
Figure 8: A- Default mode network. B- Somatomotor network. C- Visual network. D- Language network. E- Dorsal attention network. F- ventral attention network. G- Frontoparietal control network [65].
25
5 - Data Acquisition and Artifacts
In this chapter the data acquisition and common image artifacts are discussed. Starting by describing the hardware used, basic physical principles of MRI acquisition, and considering the bioeffects of this acquisition and the necessary safety precautions. To finalize the specifics of fMRI data acquisition and common image artifacts are described. The success of the fMRI study and its outcomes is deeply connected to the quality of the data acquired.
5.1 - Hardware
For the data acquisition, fMRI uses the same equipment used for clinical MRI with often some specific extra accessories needed for stimulus presentation and response collection.
5.1.1- Environment
The MRI scanner should be placed in a controlled temperature and humidity environment; typical requisites are variability of less than 3°C per hour and 5% per hour, respectively. Normal operating ranges are in the 15–25°C temperature range and 30– 75% humidity range [34].
Although modern scanners have very efficient shielding, that can drop the magnetic field strength to 0.5 mT at a four meters radius from the magnet, the scanner should be placed in a shielded room able to contain the magnetic field inside it. Doing so, prevents it from interfering with other medical or electronic equipment, for example, pacemakers, CRT monitors, that might be or pass near the scanning room.
MRI scanners construct images from RF electromagnetic signals. Thus, radio stations, mobile phones, and other wireless communications will interfere with the MRI experiment and severely degrade image quality unless they are properly isolated. MRI rooms are usually encased in a copper shield box that blocks external RF radiation and contains the MRI’s RF radiation as well. The quality of the shield is crucial to the performance of the scanner [34].
26 5.1.2 - Magnet
Some atoms, such as 1H or 13C have a nuclear spin, and associated with the
nuclear spin is a magnetic moment. In its natural state their orientation is random, neutralizing each other. However, in the presence of a static magnetic field, B0, slightly
more magnetic moments align parallel to B0, and thus produce, what can be
represented in a classical way, as longitudinal magnetization, Mz. Another effect is that
the magnetic moments will precess (spin with a motion in which their axis sweeps out a cone, like a toy spinning top), with a Larmor (resonance) frequency [141].
𝜔0=γ𝐵0 Equation 1: Larmor equation in MRI [142].
𝜔0 is the Precessional or Larmor frequency. (MHz)
γ is the Gyro Magnetic Ratio, a constant specific to each nucleus. (MHz/T) 𝐵0 is the Magnetic field strength. (T)
To create this potent static magnetic field, B0, three main magnet types can be
used: permanent, resistive and superconducting. Each has advantages and disadvantages regarding cost, ease of siting, patient and physician friendliness, and image quality. The one that is mostly used and offers the best characteristics, though being the most expensive, is the superconducting magnet [143].
Superconducting magnets use the special properties of certain materials, which at temperatures approaching absolute zero (-273.16°C, 0 K) have zero electrical resistance [143]. To create the static magnetic field a current is introduced to large solenoid coils made of superconducting metal (niobium alloys, typically) that are kept cooled at approximately 4K by liquid Helium to achieve and maintain superconductivity. Once the specified current has been built up, the circuit is closed such that the current “recirculates” through the coil constantly and there is no need to supply more power to it. It is crucial to maintain the low temperature to prevent the coil from resisting the current flow [34].
The static magnetic field is oriented horizontally, defined as the z-axis, and its strength B0 is measured in tesla (T). A 1.5 T system provides a magnetic field of ≈30,000 times that of the
earth, with no permanent effects on human physiology and negligible temporary alterations [141, 144]. Typically the scanner used for fMRI will have a magnetic field strength of 1.5T or greater (3T or 7T) as BOLD contrast increases with field strength, though not linearly.
27 Besides the strength, one must consider the spatial homogeneity and temporal stability of the magnetic field. All magnets suffer from some degree of inhomogeneity as a consequence of design limitations and compromises. Fixed shimming is used to improve the magnet homogeneity and to correct for field distortions induced by nearby ferromagnetic structures and may be performed either passively, actively, or as a combination of both. The homogeneity achievable using these fixed shims is usually adequate for imaging over relatively large volumes. One challenge is that the shape of the magnetic field changes when an object (i.e., the patient) is introduced into the field. The homogeneity may be further adjusted on a per-patient basis using dynamic shimming [143].
In addition to being homogeneous, it is quite important that the magnetic field is as constant as possible over time. The field tends to drift over time due to some factors, among them the temperature of the room and the equipment. Thus, the room temperature specifications mentioned previously. These drifts are typically subtle and slow enough that they do not affect clinical/structural imaging. fMRI, however, is based on signal subtle changes over time and therefore, field drifts act as a significant confound, especially in slow paradigms. Statistical and signal processing tools do exist to reduce these drifts effects, but it is much more desirable to minimize it during acquisition [34].
Figure 9: A superconducting magnet 1.5 T Siemens Magnetom Avanto MRI scanner (Siemens, Erlangen, Germany) at Hospital de Braga.
28 Superconducting magnets are usually cylindrical in shape with the patient being placed inside the bore. The bore has a size of approximately 0.4–0.6 m to accommodate the patient comfortably. Although both ends are open, patients may experience claustrophobia from being inside this ‘tunnel’ [143].
5.1.3 - Radiofrequency system
The RF system comprises a transmitter, coil and receiver units. The transmitter generates an oscillating magnetic field (pulse), through the RF coil, during a determined time. If the frequency, or range of frequencies, match the Larmor frequency (63.855 MHz at 1.5T for Hydrogen nucleus) resonance occurs which causes the longitudinal magnetization vector Mz to flip into the transverse plane Mxy. That will then generate a
current (following Faraday’s law of induction), the MRI signal, in the same coil, which also works as a receiver [142-145].
5.1.4 - Gradient system
Magnetic field gradients are applied for slice selection and spatial encoding. A set of three separate gradient coils (Gx, Gy, Gz), usually magnetically decoupled from the main magnet through the use of a shield, is needed to alter the magnetic field strength along the x-, y-, and z-axes [144]. These three independent sets of fields are superimposed on the main static field being switched on separately or in combination, e.g. to define an oblique slice. The isocenter is the geometric center of the main magnetic field, where the field strength is not affected by any of the three gradients [146]. Currents driven through a gradient coil provide a linear change in magnetic field strength along one direction, causing the magnetic moments to have different precessional frequencies depending on location. An RF pulse with a predefined frequency range, bandwidth, can then be applied, with the result being that only those magnetic moments in resonance with these frequencies will be excited. This is the fundamental principle of slice selective excitation. The slice thickness is determined by the slope of the gradient and the RF bandwidth [141, 145].
Then two additional gradients, in the direction of the two other axes, and RF pulses are applied for spatial encoding (phase and frequency encoding). The spatial linearity of the gradients must be maintained over the volume of the sample to be
![Figure 3: Schematic illustration of the origins of the BOLD effect in fMRI [46].](https://thumb-eu.123doks.com/thumbv2/123dok_br/17567722.817862/25.892.512.788.540.846/figure-schematic-illustration-origins-bold-effect-fmri.webp)
![Figure 4: Canonical hemodynamic response function (HRF). This is the typical BOLD response to a single, impulse stimulation [111]](https://thumb-eu.123doks.com/thumbv2/123dok_br/17567722.817862/26.892.240.674.479.780/figure-canonical-hemodynamic-response-function-typical-response-stimulation.webp)
![Figure 5: Signal enhancement by extravascular water protons, SEEP [122].](https://thumb-eu.123doks.com/thumbv2/123dok_br/17567722.817862/28.892.466.794.498.865/figure-signal-enhancement-extravascular-water-protons-seep.webp)
![Figure 6: Representation of a Voxel (volume element). Represented in red the voxels where functional activation was detected [145]](https://thumb-eu.123doks.com/thumbv2/123dok_br/17567722.817862/31.892.184.688.634.861/figure-representation-voxel-element-represented-functional-activation-detected.webp)