See discussions, stats, and author profiles for this publication at: https://www.researchgate.net/publication/314096017
Can concurrent teaching promote equal biomechanical adaptations at front
crawl and backstroke swimming?
Article in Acta of bioengineering and biomechanics / Wroclaw University of Technology · January 2017 DOI: 10.5277/ABB-00511-2015-03 CITATION 1 READS 121 5 authors, including:
Some of the authors of this publication are also working on these related projects:
PhD Projeto - Longitudinal interventions in elite swimming.View project
The assessment of a world-ranked wheelchair sprinter aerodynamics analysis by Computer Fluid DynamicsView project Mário Costa
Polytechnic Institute of Guarda
96PUBLICATIONS 490CITATIONS
SEE PROFILE
Jorge E Morais
Instituto Politécnico de Bragança
66PUBLICATIONS 243CITATIONS
SEE PROFILE
All content following this page was uploaded by Mário Costa on 20 April 2017.
Vol. 19, No. 1, 2017
DOI: 10.5277/ABB-00511-2015-03
Can concurrent teaching promote
equal biomechanical adaptations at front crawl
and backstroke swimming?
MÁRIO J. COSTA1, 5*, TIAGO M. BARBOSA2, 3, 5, JORGE E. MORAIS3, 5,
SÉRGIO MIRANDA4, DANIEL A. MARINHO4, 5
1 Department of Sports Sciences, Polytechnic Institute of Guarda, Guarda, Portugal.
2 Department of Physical Education and Sports Sciences, Nanyang Technological University, Singapore.
3 Department of Physical Education and Sports Sciences, Polytechnic Institute of Bragança, Bragança, Portugal.
4 Department of Sports Sciences, University of Beira Interior, Covilhã, Portugal.
5 Research Centre in Sports Sciences, Health Sciences and Human Development (CIDESD), Vila Real, Portugal.
Purpose: The biomechanical adaptations in front crawl and backstroke swimming, as influenced by the implementation of a
concur-rent teaching programme were analysed. Methods: Sixteen participants (19.75 ± 1.13 years) underwent a 30 weeks intervention charac-terized by an increasing complexity to accomplish motor skills in the following order: (i) lower limbs propulsion; (ii) lower limbs propul-sion synchronized with breathing cycle; (iii) lower limbs propulpropul-sion synchronized with one upper limb action; (iv) lower limbs propulsion synchronized with both breathing cycle and one upper limb action; (v) full swimming stroke; (vi) motor trajectory of the arms stroke. Performance and biomechanics were measured at front crawl and backstroke during three time points throughout the programme.
Results: There were improvements in performance over time at front crawl (21.49 s to 19.99 s, p < 0.01) and backstroke (27.15 s to 24.60 s, p = 0.01). Significant improvements were found for velocity at front crawl (1.13 m/s to 1.22 m/s, p < 0.01) and backstroke (0.92 m/s to
1.00 m/s, p < 0.01). Stroke frequency increased at backstroke (0.64 to 0.73 Hz, p = 0.01), while the intra-cyclic variation of the velocity decreased at front crawl (0.13 to 0.12%, p = 0.02). There was also a moderate-high inter-subject variability in response to the pro-gramme. Conclusions: These findings prove that a programme of 30 weeks teaching concurrently front crawl and backstroke is effective to promote similar biomechanical adaptations in low-tier swimmers. However, each subject shows an individual response to better adapt the biomechanical actions and to reach a higher level of expertise.
Key words: expertise, kinematics, swimmers, programme
1. Introduction
Swimming is quite a complex movement that im-plies non-common actions in terms of balance and propulsion. There is a need to have a horizontal bal-ance without plantar support suffering an effect from weight and buoyancy forces. The arms predominantly allow propulsion, while the feet act as balancers dur-ing the entire motion. Together, those integrated ac-tions characterize the biomechanical ability of the swimmer and will define the final level of expertise.
Expertise in the water has been assessed by ex-perimental testing and numerical methods [2]. Nu-merical methods are characterized by the introduction of selected input data, processing data according to given mechanical equations and thereafter collecting the output data. Mean swimming velocity (v) is con-sidered the best variable to assess learning outcome. Front crawl is considered the fastest swim stroke, followed by butterfly, backstroke and breaststroke [10]. However, the interpretation of v should be ac-companied by its basic elements that characterize the swimming stroke cycle: stroke length (SL) and stroke
______________________________
* Corresponding author: Mário J. Costa, Ph.D., Av. Dr. Francisco Sá Carneiro, 6300-559, Polytechnic Institute of Guarda, Portugal. Phone: +351 271 220 100, fax: +351 271 222 325, e-mail: [email protected]
Received: November 9th, 2015
M.J. COSTA et al. 82
frequency (SF). SL is defined as being the horizontal distance that the body travels during a full stroke cy-cle. SF is defined as being the number of full strokes performed within a given period of time. For Craig and Pendergast [9] the front crawl has the greatest SL and SF in comparison with the remaining swimming techniques. Authors suggested similar behavior for the backstroke except that at a given SF, the SL and v were less than for the front crawl.One other variable often used to assess the quality of the stroke cycle is the stroke index (SI). This index assumes that, at a given v, the swimmer with greater SL has the most
efficient swimming technique [8]. Front crawl has
been considered the technique with the highest SI, followed by backstroke, butterfly and breaststroke [17]. Finally, there is the intra-cyclic variation of the
velocity (dv) which is interpreted as a measure that
quantifies increases and decreases of the body’s ve-locity due to the limb’s actions over the stroke cycle. While front crawl and backstroke show a similar multi-peak more smooth profile, the breaststroke and butterfly present a two-peak and three-peak model, respectively, due to constant changes in instantane-ous v [2].
The structure of any swimming programme is sup-ported on the reasoning that the path to reach a higher level of expertise should be structured taking into account: (i) the transfer from the terrestrial motion; both front-crawl and backstroke have alternate actions compared to the simultaneous actions in breaststroke and butterfly stroke, and; (ii) the energy cost of swimming; front crawl is considered the more eco-nomical stroke followed by backstroke, breaststroke and butterfly. The swimming community has accepted the paradigm that swimming programs should start by teaching front crawl followed by backstroke, then breaststroke and finally butterfly. However, for re-semblance reasons, several coaches teach concurrently front crawl and backstroke and then the remaining swimming strokes. Although differences between front crawl and backstroke may rely on body position (prone vs supine), there are tiny aspects such as breathing cycles and/or underwater propulsive paths that, at the end, can take a longer time to be learned, and may influence the overall biomechanical ability in each one of those swimming strokes. To the best of our knowledge, there are no reports until regarding similar approaches within the swimming science community.
Thus, the aim of this study was to analyse the ad-aptations in front crawl and backstroke biomechanics, as influenced by the implementation of a concurrent teach-ing programme. There were hypothesized: (i) similar
trends and magnitude of response in front crawl and backstroke biomechanics; (ii) a high inter-individual variability over the programme.
2. Materials and methods
ParticipantsAn “a priori” sample power analysis was
calcu-lated using G-power [12] for an error probability of
0.05, effect size of 0.8 and a power of (1 – β) of 0.90, suggesting a total sample size of 16 subjects to be recruited. Inclusion criteria were defined for subjects’ participation: (i) have the stage of the aquatic envi-ronment adaptation fully consolidated; (ii) should not demonstrate previous experience in oriented swim-ming lessons or not having those in a period longer than 2 years, (iii) attend all of the testing moments; (iv) attend at least 80% of the swimming sessions that comprised the swimming program; (v) being recruited at a university campus. A total of 20 subjects were initial included for participation in this study. Taking into consideration the inclusion criteria, only 16 sub-jects (19.75 ± 1.13 years of age, 66.4 ± 8.62 kg of body mass and 1.71 ± 9.38 m in height) remained for further analysis. Written informed consent was ob-tained from the participants. The study was approved by the ethics committee of the University of Beira Interior and was performed according to the Declara-tion of Helsinki.
Study design
The experiment had a duration of 30 weeks split into two stages of 15 weeks each. The swimming pro-gramme comprised weekly swimming classes (first stage, one swimming session per week of 1 h 30 min; second stage two sessions per week of 1 h 30 min each). The discrepancy on learning hours between stages was mainly due to schedule constraint by the institution where the sessions were held. According to the teaching paradigm, the main goal of the pro-gramme was to teach front crawl and backstroke con-currently. The programme was conducted by an in-structor coach with at least 10 years of experience, working with a broad rage of swimmers from different levels of expertise besides being the head coach of several swimming squads.
The programme was characterized by an increasing complexity encompassing analytical and global motor skills to accomplish the required contents in the fol-lowing order: (i) lower limbs propulsion; (ii) lower
limbs propulsion synchronized with breathing cycle; (iii) lower limbs propulsion synchronized with one upper limb action; (iv) lower limbs propulsion syn-chronized with both breathing cycle and one upper limb action; (v) full swimming stroke; (vi) motor tra-jectory of the arms stroke. Subjects spent approxi-mately three weeks practicing each motor skill re-ported earlier. The remaining weeks were aimed at trimming and polishing minor technical details. Al-though both swimming strokes were taught concur-rently, the front crawl partial contents were introduced first than those from backstroke, mostly due to a lower energy cost [1]. In parallel with visual inspection done by the coach, some intermediate objectives were set. Subjects must swim at least 15 m to be considered as having achieved the main goal. Attention was given to possible errors of asymmetry, lack of dynamic balance and/or mistakes during breathing and propulsion ac-tions. Those were requirements taken into considera-tion to advance to the next learning content the order of which was established previously. In order to fa-cilitate skills acquisition, floating (e.g., boards and pull-boys) and propulsion (e.g., fins and paddles) equipment was used.
Data collection
The subjects were assessed at three moments throughout the 30 weeks: (i) beginning of the program (M1); (ii) end of 15 weeks (M2), and; (iii) end of 30 weeks (M3). At each testing point, subjects were asked to swim a 25m all-out effort of front crawl and backstroke on a short swimming pool in order to ob-tain swimming velocity (v), stroke frequency (SF) stroke length (SL), stroke index and horizontal intra-cyclic velocity fluctuation (dv) as biomechanical vari-ables. The time to cover the 25-m distance was used as performance score (Perf). The two sets (one at front crawl and backstroke) with push-off start (30 minutes rest between trials) were completed in a randomize order. Subjects performed the trials alone with no other swimmer in the lane or nearby lanes to reduce drafting and pacing effects, or being affected by extra drag force due to exogenous factors. The swimmers were advised to reduce gliding phase during the start to allow data collection at the 15 m of the total swim-ming distance.
Biomechanical variables were manually assessed and mathematically estimated. SF (in cycles/min) was measured with a chrono-frequency counter (Golfinho Sports MC 815, Aveiro, Portugal), during three con-secutive strokes by two expert evaluators (ICC = 0.97). The SF values were then converted to International System units (Hz). SL was then calculated as follows [9]
SF
SL v (1)
where SL is the stroke length (in m), v is the mean swimming velocity (in m/s), and SF is the stroke fre-quency (in Hz). The SI referred to was calculated as follows [8]
SL
SI v (2)
where SI represents stroke index (in m2/c/s), SL
repre-sents stroke length (in m) and v is the mean swimming velocity (in m/s).
Both v (in m/s) and dv (in %) were directly as-sessed using a speedo-meter (Swim speedo-meter, Swimsportec, Hildesheim, Germany). From a mathe-matical standpoint, the dv is described with non-linear functions. Nevertheless, determination coefficients from these models are moderate, since swimmers present different individual dv curves. So, there was used an integrated system (speedo-meter plus soft-ware) already validated [3] and described in previous researches [4], [16]. The cable was attached to the swimmer’s hip, while the speedo-meter box was placed on the forehead-wall of the swimming pool, about 0.2 m above water surface. During data collec-tion an evaluator inspected visually the velocity curves being drawn in the software’s interface while the swimmer performed the trial. If some techni-cal/methodological issue happened (e.g., bumping feet on the cable), the swimmer was asked to repeat the trial. Bio-signal was acquired on-line at a sampling
rate of 50 Hz. A LabVIEW® (v. 2009) software’s
in-terface was used to acquire, display and process pair-wise speed-time data on-line during the trials. To transfer data from the speed-meter to the software application, a 12-bit resolution acquisition card (USB-6008, National Instruments, Austin, Texas, USA) was used as well.
At the end both front crawl and backstroke per-formances were also considered. The time to complete the 25-m distance (in s) was used as a score to define the performance in both swimming techniques
Statistical procedures
The Kolmogorov–Smirnov and the Levene tests were used to assess normality and homocedasticity assumptions, respectively. Due to the low value of N (i.e., N < 30) and the rejection of the null hypothesis
(H0) in the normality assessment, nonparametric
pro-cedures were selected. Data was expressed as mean and standard deviation for each testing point. Rate of change (%) between evaluation moments and throughout the overall programme was also reported.
M.J. COSTA et al. 84
Changes over time were analyzed computing the Friedman test and differences between testing points were obtained using the Wilcoxon signed-rank test (P 0.05). Effect sizes were computed based on
eta-squared (2) procedure, and the following values were
interpreted according to Ferguson [13]: without effect
if 0 < 2 ≤ 0.04, minimum if 0.04 < 2 ≤ 0.25,
moder-ate if 0.25 < 2 ≤ 0.64 and, strong if 2 > 0.64. Data
were reported to have a “meaningful variation” if
significant (P 0.05) with a medium/moderate or
large/strong effect size (2 > 0.25) and a “significant
variation” if significant (P 0.05) with a small effect
size (2 ≤ 0.25) [18]. Between-swimmer coefficient of
variation (CV) was computed and interpreted as: low variability if 0 < CV < 15, moderate variability if 15 ≤ CV < 30 and high variability if 30 ≤ CV.
3. Results
Table 1 presents the variation between testing points in the performance and biomechanics. Per-formance showed significant improvements at front
crawl ( p < 0.01; 2 = 0.03) and backstroke ( p = 0.01;
2 = 0.05). Significant variations were also found in v
for both swimming strokes ( p < 0.01; 2 = 0.04).
There was a significant variation in the SF at
back-stroke ( p = 0.01; 2 = 0.16) and the dv at front crawl
( p < 0.02; 2 = 0.07). Despite trivial changes,
re-maining variables were statistically unchanged throughout the programme.
Table 2 presents the rate of change from perform-ance and biomechanics throughout the programme.
Table 1. Descriptive and inferential statistics on variation of performance and selected biomechanical variables between testing points
M1 M2 M3 Perf (s) 21.49 ± 4.50 21.28 ± 4.25 19.99 ± 3.80 b v (m/s) 1.13 ± 0.23 1.14 ± 0.21 1.22 ± 0.20 b SF (Hz) 0.81 ± 0.14 0.83 ± 0.11 0.88 ± 0.15 SL (m) 1.42 ± 0.31 1.39 ± 0.25 1.41 ± 0.26 SI (m2/c/s) 1.64 ± 0.55 1.61 ± 0.51 1.74 ± 0.51 Front crawl dv (%) 0.13 ± 0.04 0.16 ± 0.08 0.12 ± 0.06 b Perf (s) 27.15 ± 4.91 25.46 ± 4.76 a 24.60 ± 4.47 c v (m/s) 0.92 ± 0.16 0.96 ± 0.15 a 1.00 ± 0.17 c SF (Hz) 0.64 ± 0.10 0.71 ± 0.07 a 0.73 ± 0.10 c SL (m) 1.45 ± 0.24 1.37 ± 0.21 1.40 ± 0.32 SI (m2/c/s) 1.36 ± 0.40 1.35 ± 0.38 1.44 ± 0.53 Backstroke dv (%) 0.12 ± 0.03 0.11 ± 0.03 0.10 ± 0.05
a different from M1, b different from M2, c different from M1 and M2.
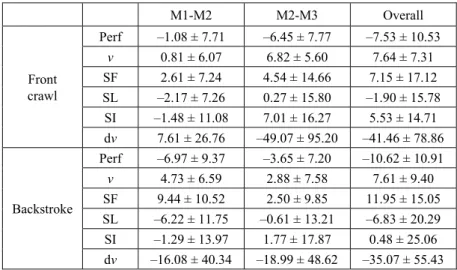
Table 2. Rate of change (%) in performance and selected biomechanical variables between testing points and throughout the overall programme
M1-M2 M2-M3 Overall Perf –1.08 ± 7.71 –6.45 ± 7.77 –7.53 ± 10.53 v 0.81 ± 6.07 6.82 ± 5.60 7.64 ± 7.31 SF 2.61 ± 7.24 4.54 ± 14.66 7.15 ± 17.12 SL –2.17 ± 7.26 0.27 ± 15.80 –1.90 ± 15.78 SI –1.48 ± 11.08 7.01 ± 16.27 5.53 ± 14.71 Front crawl dv 7.61 ± 26.76 –49.07 ± 95.20 –41.46 ± 78.86 Perf –6.97 ± 9.37 –3.65 ± 7.20 –10.62 ± 10.91 v 4.73 ± 6.59 2.88 ± 7.58 7.61 ± 9.40 SF 9.44 ± 10.52 2.50 ± 9.85 11.95 ± 15.05 SL –6.22 ± 11.75 –0.61 ± 13.21 –6.83 ± 20.29 SI –1.29 ± 13.97 1.77 ± 17.87 0.48 ± 25.06 Backstroke dv –16.08 ± 40.34 –18.99 ± 48.62 –35.07 ± 55.43
Backstroke presented the highest rate of change from M1 to M2 in almost all variables. Contrarily, an oppo-site trend was found from M2 to M3, with higher val-ues found at front crawl. The variable with highest rate of change through the overall programme was the dv in both swimming techniques.
Figures 1 and 2 depict the individual trajectories at front crawl and backstroke, respectively. As far as front crawl goes, a low-moderate inter-subject variability was
found for Perf (CV = 19–21%), v (CV = 17–21%), SF (CV = 13–18%), SL (CV = 19–22%) and SI (CV = 29–33%). The only exception was the dv with a high variability between swimmers (CV = 30–55%). Similar trend was found for backstroke having a low-moderate variability in Perf (CV = 18–19%), v (CV = 16–18%), SF (CV = 10–16%) and SL (CV = 15–23%). A mod-erate-high variability was found for both SI (CV = 28–37%) and dv (CV = 23–45%).
Fig. 1. Individual trajectories of performance and biomechanical variables at front crawl throughout the swimming program
M.J. COSTA et al. 86
4. Discussion
This study is the first to report data about biome-chanical adaptations of low-tier swimmers to an ex-tended swimming programme with concurrent teach-ing of front crawl and backstroke. Major findteach-ings showed similar changes in front crawl and backstroke biomechanics and hence better performances at the 25-m time trial. There was also a moderate-high
inter-individual variability in the biomechanical response to reach a higher level of expertise.
There were found improvements in v for both swimming techniques. At front crawl v increased from M2 to M3, while at backstroke there was an increase between the three testing points. Differences may be due to environmental constraints experienced previ-ously to the programme, which defined the initial technical behaviour of the swimmer. As far as fitness and leisure settings, non-expert swimmers chose often
Fig. 2. Individual trajectories of performance and biomechanical variables at backstroke throughout the swimming program
the prone rather than the supine position. There are some concerns linked to supine dynamic balance mainly related to anatomical and visual constraints. Thus, for safety reasons, beginners perform more of-ten swimming strokes in the prone position. This ex-plains why this kind of swimmers show better biome-chanics in the prone than in supine position before the beginning of the programme, allowing a higher im-provement at backstroke comparing to front crawl.
The v represents a unique combination between SF and SL [9]. While SL remained fairly constant in both swimming strokes, increases in v from baseline to M1 were mostly derived from increases in SF. The basic contents related to teaching arm stroke were covered in the first stage of the programme. Since arms actions account for 90% of propulsion with consequence to v [15], less skilled swimmers seemed to rely more on a shorter than a larger stroke to reach a higher veloc-ity. This leads to a higher number per strokes to per-form the 25 m distance. Previous studies suggested that, as the upper limb’s velocity increase, the hori-zontal velocity of the swimmers increase as well [11]. So, this initial adaptation cannot be considered detri-mental at this stage of the programme. Higher SF values can be the consequence of muscular adaptations to swimming motion, which indicates a higher ability to generate power on water [14]. However, when em-phasized the motor trajectory of the arms stroke start-ing at the 15th week, the rate of increase in SF was not so obvious. The working on the “S” shape of the hand’s path increased the partial duration and the pro-pulsive force during the final actions of the underwa-ter curvilinear trajectories culminating in a more pro-nounced stroke.
SI values showed similar trend in both techniques with a higher rate of change in the second stage of the programme. The SI is an estimation based on the v-SL relationship [8]. Moreover, higher SI values are attributed to subjects with higher expertise in the water [17]. Since learning contents were acquired until the 18th week, there was some space to im-prove less good aspects of both techniques. This was done based on tasks where v was imposed by the instructor, while at the same time there was an at-tempt to maintain/reduce the number of strokes in each trial. Exercises constrained when imposing v have already been used in the past on subjects from similar background, and showed to be effective for biomechanical and energetic parameters [6]. So, as was expected for our subjects, there was a motor re-organization of the SL taking into account a more demanding v over the program, increasing the effec-tiveness of their stroke.
The dv showed decreases at front crawl, mainly in the second stage of the programme. There was a similar trend for backstroke but without statistical meaning. In fact, dv was the variable with highest rate of change through the overall program in both swimming techniques. The dv describes the ability to avoid unnecessary drag by minimizing the in-stantaneous acceleration/deceleration of the swim-mer’s body through the water. The lower the dv value is, the less energy is spent in the stroke cycle [1]. As it happens in high level swimmers, our sub-jects exhibited a more uniform profile regarding the increases and decreases of the body’s velocity within the stroke cycle. This culminated in a lower loss of energy and a better economy of swimming at each stage of the program.
A moderate/high variability was found in this study. The variability by each subject was higher than the average variability of the pooled sample.
The dynamical systems theory
encompasses the
concept that there is an individual behaviour
inthe way on how swimmers adapt their biomechanics in the water [16]. This means that every swimmer followed his most comfortable path to acquire the learning contents and to coordinate stroke actions. Visual inspection of Figs. 1 and 2 shows an in-creased SF and dein-creased SL, or vice-versa for each swimmer to reach a given swimming velocity. Swim-mers also exhibited different individual dv curves, which express differences in comparison with the mean curves from several subjects, but represented his/her own interpretation of the swimming tech-nique. This phenomenon was already found in high level swimmers in previous interventions [5], [7]. In this research with low-tier swimmers, the SI and dv are the variables with the highest variability. Figures 1 and 2 pointed out an increase in variabil-ity mostly in the final stage of the programme. So, we might consider that SI and dv are the variables that, in the end, will define cohorts of expertise within a population. Swimming instructors should sustain the key idea that there is not a single ideal expert model to be imitated, but rather that each swimmer adapt his/her behaviour to reach a final outcome.
Some limitations should be considered: (i) the ab-sence of an imposed test velocity during a mid-pool 15 m distance to estimate changes on biomechanical measures. There was used an all-out effort that may have imposed some bias; (ii) no data on more analyti-cal actions (e.g., trunk incline) that will help us to understand adaptations more deeply according to the learning contents.
M.J. COSTA et al. 88
5. Conclusions
Our findings suggest that a swimming programme teaching concurrently front crawl and backstroke is effective and promotes similar adaptations in the front crawl and backstroke biomechanics. Despite the similar trend of improvement, there seems to exist a moder-ate-high variability in response to the program. So, swimming coaches should be aware of different indi-vidual adaptations by the swimmers over the pro-gramme. There is not a single model to be imitated, but rather each subject uses the most freely chosen voluntary response to better adapt his swimming movement throughout the program and reach a higher level of expertise.
References
[1] BARBOSA T.M., FERNANDES R.J., KESKINEN K.L., VILAS-BOAS J.P.,
The influence of stroke mechanics into energy cost of elite swimmers, Eur. J .Appl. Physiol., 2008, 103, 139–149.
[2] BARBOSA T.M., MARINHO D.A., COSTA M.J., SILVA A.J.,
Biomechanics of competitive swimming strokes, [in:] V. Klika
(ed.), Biomechanics in Aplications, Intech, Rijeka, 367–388.
[3] BARBOSA T., COSTA M., MORAIS J., JESUS S., SILVA J.,
BATISTA J. et al., Validation of an integrated system to
as-sess horizontal intra-cyclic velocity with a mechanical speedo-meter, Portuguese Journal of Sports Science, 2011,
29, 833–835.
[4] BARBOSA T., MOROUÇO P., JESUS S., FEITOSA W., COSTA M.,
MARINHO D. et al., Interaction between speed fluctuation
and swimming velocity in young competitive swimmers, Int.
J. Sports Med., 2013, 34, 123–130.
[5] BIDEAULT G., HERAULT R., SEIFERT L., Data modelling
reveals inter-individual variability of front crawl swimming,
J. Sci. Med. Sport, 2013, 16, 281–285.
[6] CHOLLET D., MORETTO P., PELAYO P., SIDNEY M., Energetic
effects of velocity and stroke rate control in non-expert swim-mers, Biomechanics and Medicine in Swimming, 1996, VII,
172–176.
[7] COSTA M.J., BRAGADA J.A., MEJIAS J.E., LOURO H.,
MARINHO D.A., SILVA A.J., BARBOSA T.M., Effects of swim
training on energetics and performance, Int. J. Sports Med.,
2013, 34, 507–513.
[8] COSTILL D., KOVALESKI J., PORTER D., KIRWAN R., FIELDING R., KING D., Energy expenditure during front crawl
swim-ming: predicting success in middle-distance events, Int. J.
Sports Med., 1985, 6, 266–270.
[9] CRAIG A., PENDERGAST D., Relationship of stroke rate,
dis-tance per stroke, and velocity in competitive swimming, Med.
Sci. Sports Exerc., 1979, 11, 278–283.
[10] CRAIG A., SKEHAN P., PAWELCZYK J., BOOMER W., Velocity,
stroke rate and distance per stroke during elite swimming competition, Med. Sci. Sports Exerc., 1985, 17, 625–634.
[11] DESCHODT V., ROUARD A., MONTEIL K., Relationship
be-tween the three coordinates of the upper limb joints with swimming velocity, [in:] J.P. Troup, A.P. Hollander, D.
Strasse, S.W. Trappe, J.M. Cappaert, T.A. Trappe (eds.),
Biomechanics and Medicine in Swimming VII, E & FN Spon,
London 1996, 52–58.
[12] FAUL F., ERDFELDER E., LANG A.G., BUCHNER A., G*Power
3: A flexible statistical power analysis program for the so-cial, behavioral, and biomedical sciences, Behav. Res.
Meth., 2007, 39, 175–191.
[13] FERGUSON C.J., An effect size primer: a guide for clinicians
and researchers, Profes. Psychol., 2009, 40, 532–538.
[14] GIROLD S., JALAB C., BERNARD O., CARETTE P., KEMOUN G., DUGUÉ B., Dry-land strength training vs. electrical
stimula-tion in sprint swimming performance, J. Strength Cond. Res.,
2012, 26, 497–505.
[15] HOLLANDER A.P., de GROOT G., van INGEN SCHENAU G.,
KAHMAN R., TOUSSAINT H., Contribution of the legs to
pro-pulsion in Front Crawl swimming, [in:] V.B. Ungerechts,
K. Wilke, K. Reischle, (eds.), Swimming Science, Human Kinetics Books, Illinois, 1988, 39–43
[16] MORAIS J., SAAVEDRA J., COSTA M., SILVA A., MARINHO D., BARBOSA T., Tracking young talented swimmers: follow-up
of performance and its biomechanical determinant factors,
Acta Bioeng. Biomech., 2013, 15, 129–138.
[17] SÁNCHEZ J., ARELLANO R., Stroke index values according to
level, gender, swimming style and event race distance, [in:]
K. Gianikellis (ed.), XXth International Symposium on Bio-mechanics in Sports, Cáceres: Universidad de Extremadura, 2002, 56–59.
[18] WINTER E., Use and misuse of the term “significant”, J. Sports Sci., 2008, 26, 429–430.
View publication stats View publication stats