Against all odds: a tale of marine
range expansion with maintenance
of extremely high genetic diversity
Joana i. Robalo
1, Sara M. francisco
1, catarina Vendrell
1,2, cristina S. Lima
1, Ana pereira
1,
Benedikt p. Brunner
3, Mamadou Dia
4, Leonel Gordo
2& Rita castilho
3,5*the displacement of species from equatorial latitudes to temperate locations following the increase in sea surface temperatures is among the significant reported consequences of climate change. Shifts in the distributional ranges of species result in fish communities tropicalisation, i.e., high latitude colonisations by typically low latitude distribution species. these movements create new interactions between species and new trophic assemblages. the Senegal seabream, Diplodus bellottii, may be used as a model to understand the population genetics of these invasions. in the last decades, this species has undergone an outstanding range expansion from its African area of origin to the Atlantic coast of the iberian peninsula, where now occurs abundantly. Mitochondrial and nuclear markers revealed a striking high haplotypic nucleotide and genetic diversity values, along with significant population differentiation throughout the present-day geographical range of the Senegal seabream. These results are not consistent with the central-marginal hypothesis, nor with the expectations of a leptokurtic distribution of individuals, as D. bellottii seems to be able to retain exceptional levels of diversity in marginal and recently colonised areas. We discuss possible causes for hyperdiversity and lack of geographical structure and subsequent implications for fisheries.
Tropicalisation, the displacement of species from equatorial latitudes to temperate locations, is one of the major reported consequences of climate changes1–3. The increase of sea surface temperatures (SSTs) in the last
dec-ades has promoted shifts in the distributional ranges of species (e.g.,4,5) with individuals moving into areas best
corresponding to their physiological optimum. Additionally, the ability of a species to colonise new habitats is influenced by oceanographic currents, the existence of adequate resource availability (i.e., habitat and food) and life-history patterns (e.g., number of eggs produced, age or parental care). These movements lead to the colonization of more poleward habitats by low latitude species, and create new interactions between species and new trophic assemblages. In commercial species, these shifts due to climate change can be magnified by fishing pressures, as reported for the North Sea cod (e.g.,6).
Poleward colonization by organisms with a typically equatorial distribution was described almost three dec-ades ago for terrestrial organisms in association with postglacial recolonisation routes (e.g.,7–10). As a general
rule, organisms follow a leptokurtic distribution type, in which the majority of individuals stay at or near the original area, and only a fraction disperse to longer distances. This range extension is usually done in a stepping-stone manner, implying that each settlement has fewer individuals compared with the previous one. Theoreti-cally, this process corresponds to multiple successive genetic founder events associated with the corresponding genetic implications of the downsize in the effective population numbers: the erosion of the genetic diversity by genetic drift induces allele loss, the “southern richness and northern purity” paradigm11. Additionally, the
“central-marginal hypothesis”12 posits that populations at the centre of the distribution have higher population
sizes and gene flow, and peripheral (leading edge) populations, are smaller in size, have lower genetic diversity and will be more genetically differentiated12.
Phylogeographic studies using mitochondrial and nuclear genes revealed that species with similar environ-mental requirements and life-history traits often present distinct genetic and demographic historical patterns13,14.
open
1MARE – Marine and Environmental Sciences Centre, ISPA Instituto Universitário, Rua Jardim do Tabaco 34, 1149-041 Lisbon, Portugal. 2MARE – Marine and Environmental Sciences Centre, Faculdade de Ciências da Universidade de Lisboa, Lisbon, Portugal. 3Universidade do Algarve, Campus de Gambelas, Faro, Portugal. 4Institut Mauritanien de Recherches Océanographiques et des Pêches, 22, Nouadhibou, Mauritania. 5Centre of Marine Sciences (CCMAR), Campus de Gambelas, Faro, Portugal. *email: [email protected]
Among fish species of the northeast Atlantic, we can find the co-existence of: (1) panmictic populations without latitudinal variation in genetic diversity (e.g. Lipophrys pholis15); (2) significant population structure with similar
levels of genetic diversity throughout the entire species range (e.g. Taurulus bubalis16); and (3) sharp decline
of genetic diversity from south (west European) to northern (Scandinavian) populations (e.g. Pomatoschistus
microps17; Symphodus melops18; Labrus bergylta19). It is less common the observation of geographical range
expansion of marine species without loss of genetic diversity but, for examples, see16,20,21. Contemporary and
increasingly visible tropicalization will contribute to more records of fast range expansion events.
The Senegal seabream, Diplodus bellottii Steindachner, 1882 (Sparidae), displayed an outstanding range expansion from its endemic origin (Senegal to Cape Blanco in Mauritania22) to the Atlantic coast of the Iberian
Peninsula within a decade (see Fig. 1 for specific dates). There are no records from the archipelagos of Madeira, Canaries or Cape Verde23. However, its presence is reported in Mauritania24 and Morocco25 during the late 60’s.
In the 1970’s, the species was consistently recorded in the Iberian Peninsula, first in Cadiz26 then in Algarve27,
−20
−10
0
10
10
20
30
40
50
0.1
0.2
0.3
0.4
0.5
0.6
0.7
Latitude
MAU
perennial
range
1969
1971
1978
1981
2005
1995
CAD
ALG
SES
LIS
Longitude
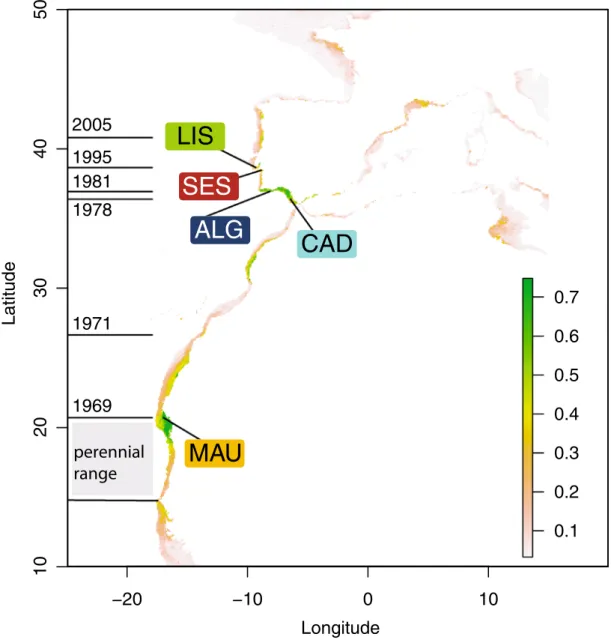
Figure 1. Present-day distributional range, sample locations and consensus modeled distribution of the Senegal seabream (Diplodus bellottii) in Northern West Africa and Iberia. Locations: MAU—Mauritania; CAD—Cadiz; ALG—Algarve; SES—Sesimbra; LIS—Lisbon. Perennial range in grey and year of first record of expanded range in horizontal lines. Color-coded sampled locations over-layed on the consensus current modeled probability of occurrence distribution (see “Material and methods” section). Note: The original estimated suitability value was divided by 1000 to convert the suitability value into a probability of occurrence. As a rule of thumb, sites with suitability higher than 0.5 predict presence, while sites with suitability lower than 0.5 indicate absence. Figure generated using the Biomod2 package (https ://cran.r-proje ct.org/web/packa ges/biomo d2) implemented in the R32 (version 3.5.3), and Adobe Illustrator CC2019 (version 23.0.1) (https ://www.adobe .com/products/illustrator.
moving progressively towards North to Sado and Tagus (1995) estuaries28, and Ria de Aveiro in the north
Atlantic coast of Portugal29 (Fig. 1). These movements are thought to result from the sea temperature rise30. The
Tagus estuary experienced a major increase in the abundance of the Senegal seabream between 1979–1981 and 1995–199728. Presently, the species is a common bycatch species of the artisanal fisheries around the Lisbon area31.
The species is therefore a good candidate to illustrate the effect of tropicalisation on the genetic make-up of the species, and on the relationship between colonisation success and genetic diversity, without the contamination of past recolonisation events.
Diplodus bellottii breeding is synchronous and occurs mostly from April to June and sexual maturity is
reached at 1 year old for females and two for males31. The same study analysed the otoliths of this species and
found that the oldest specimens were 9 years old, corresponding to females with at least seven reproductive seasons31.
In this study, we used the documented expansion of D. bellottii as an opportunity to assess putative founder effects by looking for evidence of reductions in the number of mitochondrial or nuclear singleton haplotypes (haplotypes seen only once in a sample, i.e. an unshared haplotype) coherent with a predictable loss of overall genetic diversity. We hypothesise that similarly to several other marine fish species in this area of the Northeast-ern Atlantic such as Halobatrachus didactylus33, Symphodus melops34 or Labrus bergylta19, the recent observed
range expansion will lead to a substantial loss of diversity. Also, the expanding low-density leading edge is by definition constituted by edge patches, which are most typically affected by founder events35, where demographic
and allelic composition stochasticity36 is predictably stronger. If no significant reduction in singleton
haplo-types is observed, and no differences among haplotype frequencies are found, there would be no evidence for a founder event or genetic bottleneck and the species may be panmictic. Alternatively, if no significant reduction in singleton haplotypes is observed but there are differences among haplotype frequencies, the species may be genetically structured. This study is the first appraisal on the genetic variability of this species across its range, a key information to understand its astonishing northward expansion. Additionally, we used species distribution modelling with present-day conditions to evaluate suitable areas for potential colonization, and explored whether the sampling coverage allowed an effective representation of the genetic diversity of the species.
Results
A total of 357 base pairs of the mitochondrial control region were sequenced for 124 individuals, defining 118 haplotypes and 548 base pairs of the S7 first intron were resolved for 96 individuals, defining 69 haplotypes, from five sampling locations (Fig. 1). Haplotype and nucleotide diversities were high in all locations (Table 1), except in Cadiz where diversities were low. Haplotype diversities were close to 1.000 (hCR = 0.997 to 1.000 and
hS7 = 0.960 to 1.000) and nucleotide diversities were high, ranging from πCR = 0.4% (Cadiz) to 10.4%
(Maurita-nia) and πS7 = 0.0% (Cadiz) to 2.7% (Maurita(Maurita-nia) with πCR = 7.9 and πS7 = 0.1% for the entire data set (Table 1). In the entire data set the three estimates of fixation GST, G′ST, θ and the differentiation estimate D reveal
sig-nificant values for CR (GST = 0.068, CI = 0.053–0.089; G′ST = 0.981, CI = 0.940–0.999; θ = 0.045, CI = 0.032–0.062;
D = 0.979, CI = 0.936–0.999) and for S7 (GST = 0.233, CI = 0.203–0.292; G′ST = 0.990, CI = 0.979–0.998; θ = 0.076,
CI = 0.054–0.105; D = 0.988, CI = 0.972–0.997). The same parameters behaved differently in pairwise comparisons for both markers (Table 2), with GST and θ revealing largely non-significant comparisons, and G′ST and D showing
all comparisons statistically significant. This means that haplotypes are usually distinct among the five sampling sites, with complete haplotypic differentiation (D = 1) involving four pairs of sampling sites in CR and six in S7, including locations that are not the most distant ones, such as Algarve and Cadiz.
The haplotype accumulation curves failed to reach the asymptote for any of the markers (Fig. 2), indicat-ing that only part of the actual genetic diversity was captured. Both markers had largely overlappindicat-ing haplotype rarefaction curves and confidence intervals, although the Chao 1 estimated total diversity for the CR region of 690 haplotypes and 206 for the S7.
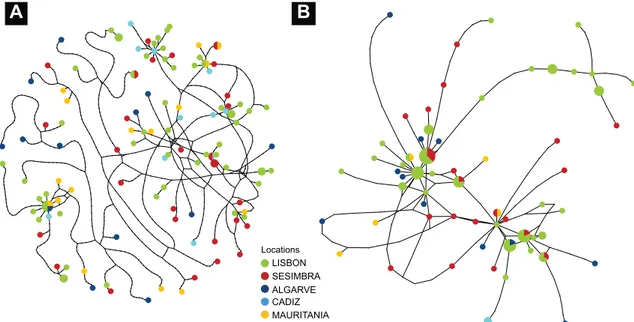
The main characteristic exhibited by the two markers’ haplotype networks is their bush-like complexity, with no central or otherwise extremely abundant haplotype. The networks displayed a large number of singleton haplotypes and very few shared haplotypes among sampling sites (coloured circles), a pattern characteristic of DNA hyperdiversity (Fig. 3). The CR region had only five shared haplotypes, with the most frequent haplotype Table 1. Sample locations, sample abbreviations, collection dates, sample sizes and summary statistics for one mitochondrial fragment of mtDNA control region (CR) and first intron of the S7 ribosomal protein (S7) of
Diplodus bellottii. Code map and figure location codes, Lon longitude, Lat latitude, N number of individuals, nh number of haplotypes, np number of private haplotypes, ns number of singletons, np/h the proportion of
private haplotypes, h haplotype diversity, π nucleotide diversity.
Location Code Lon Lat
Mitochondrial D-Loop S7
N nH nP ns nP/N h π (%) N nH nP ns nP/N h π (%)
Lisbon, Portugal LIS 38.645 − 9.233 55 50 47 43 0.94 0.997 7.77 56 28 25 19 0.89 0.960 0.08 Sesimbra, Portugal SES 38.438 − 9.106 29 28 25 24 0.89 0.998 7.27 22 19 14 13 0.74 0.987 0.28 Algarve, Portugal ALG 37.132 − 8.541 11 11 10 10 0.91 1.000 5.17 11 11 10 10 0.91 1.000 1.77
Cadiz, Spain CAD 36.527 − 6.289 16 16 13 13 0.81 1.000 0.41 2 1 1 0 NA 0.000 0.00
Cape Blanc, Mauritania MAU 20.985 − 17.003 13 13 12 12 0.92 1.000 10.37 5 5 3 3 0.60 1.000 2.74
shared among Mauritania, Cadiz and Lisbon, and the others between Lisbon–Sesimbra (the closest locations), Sesimbra–Algarve, Sesimbra–Cadiz and Lisbon–Cadiz. The S7 intron has seven shared haplotypes, four between Lisbon and Sesimbra (the closest locations), and one between Lisbon and Algarve, Lisbon and Mauritania, and Sesimbra and Mauritania.
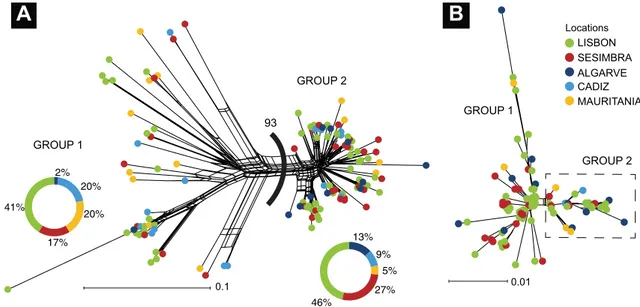
The neighbour-net network (Fig. 4) showed two lineages diverging from an unresolved polytomy, as repre-sented by the box-like appearance of the internal branches, evident in the CR less so in the S7 network. The two lineages occurred at all sampling sites, but the χ2 test of the total frequencies of individual membership per sam-pling site yielded significant results only for the CR (χ2 = 10.31, p = 0.036) and not for the S7 (χ2 = 5.70, p = 0.222). One of the main features of the BIOMOD2 software is the ability to combine predictions made in single models in an ensemble. The species distribution modelling produced six models (ANN, FDA, GBM, GLM, MARS, and RF) that can be considered good to excellent while CTA, Maxent and SRE have a poor fit with TSS and ROC values under 0.7 (Fig. 5). Among the best performance models were RF (ROC = 0.950, TSS = 0.826) and GBM (ROC = 0.951, TSS = 0.822).
The percentage of the correctly predicted presence (sensitivity) ranged from 65 to 92% considering all models individually, with the highest value for the GBM model and the lowest for SRE (Fig. 5). Specificity (i.e., the % of absences correctly predicted) ranged between 79 and 90%, with the highest value for the MAXENT.Phillips model and the lowest for ANN. The visual assessment showed that the predictions of the consensus model reflected realistic spatial patterns of distribution of D. bellottii without apparent anomalies (Fig. 1). The highest probabilities of occurrence were in the Mauritania southern coast and Morocco, with discontinuous distribution patches, in contrast with south Iberia, that is associated with areas of high habitat suitability, and the Lisbon area. The overall model did not predict suitable habitats north of the Lisbon region, although the species is present in Aveiro, and predicted the area corresponding to the west Alboran Sea as a suitable habitat.
Discussion
Remarkably high haplotype and nucleotide genetic diversities, and significant population differentiation were consistently found throughout the present-day geographical range of the Senegal seabream. These results are not consistent with the central-marginal hypothesis nor with the expectations of a leptokurtic distribution, and the Senegal seabream seems to be able to maintain very high levels of diversity in marginal and recently-colonised areas. Before dissecting these results, it is appropriate to address three main caveats regarding this work. Firstly, sample sizes are small, considering the observed hypervariability of the mitochondrial control region and even smaller in the nuclear S7, as many individuals failed to amplify. This limitation constrains the breadth of the discussion, and results are therefore interpreted with caution. Moreover, no inferences on dispersal patterns can be made from the genetic data here presented. Secondly, there is a geographic sampling gap between Mauritania and Cadiz, where the species may be present, albeit in small numbers. We could not obtain any samples from that region, and species distribution modelling may be affected by that gap. Thirdly, the small number of existing Table 2. Pairwise CR and S7 differentiation in Diplodus bellottii. Values in bold represent significant values, in which the 95% confidence interval does not overlap with zero.
Pairwise Gst 95% CI G′ST 95% CI θ 95% CI D 95% CI Control region ALG–CAD 0.020 0.0027–0.0481 1.000 1.0000–1.0000 0.000 − 0.0324–0.0502 1.000 1.0000–1.0000 ALG–MAU 0.022 0.0011–0.0542 1.000 1.0000–1.0000 0.000 − 0.0394–0.0575 1.000 1.0000–1.0000 ALG–SES 0.016 − 0.0010–0.0389 0.908 0.7586–0.9395 − 0.002 − 0.0318–0.0379 0.907 0.7512–0.9395 ALG–LIS 0.015 0.0006–0.0380 1.000 1.0000–1.0000 0.002 − 0.0238–0.0396 1.000 1.0000–1.0000 CAD–MAU 0.016 − 0.0031–0.0401 0.869 0.6292–0.9152 − 0.005 − 0.0409–0.0394 0.867 0.6184–0.9152 CAD–SES 0.012 0.0002–0.0262 0.918 0.7872–0.9474 − 0.001 − 0.0237––0.0251 0.917 0.7834–0.9473 CAD–LIS 0.010 − 0.0003–0.0232 0.848 0.6895–0.9054 − 0.002 − 0.0203–0.0228 0.847 0.6841–0.9055 MAU–SES 0.015 0.0027–0.0368 1.000 1.0000–1.0000 0.001 − 0.0218–0.0386 1.000 1.0000–1.0000 MAU–LIS 0.012 − 0.0002–0.0316 0.894 0.7369–0.9330 − 0.001 − 0.0227–0.0329 0.893 0.7299–0.9330 SES–LIS 0.008 0.0034–0.0137 0.962 0.8838–0.9778 0.002 − 0.0063–0.0134 0.961 0.8821–0.9778 S7 ALG–CAD 0.304 0.2773–0.3489 1.000 1.0000–1.0000 0.233 0.1961–0.2938 1.000 1.0000–1.0000 ALG–MAU 0.041 − 0.0119–0.1518 1.000 1.0000–1.0000 0.000 − 0.0847–0.1461 1.000 1.0000–1.0000 ALG–SES 0.020 0.0027–0.0510 1.000 1.0000–1.0000 0.005 − 0.0272–0.0578 1.000 1.0000–1.0000 ALG–LIS 0.019 0.0015–0.0462 0.852 0.6374–0.9218 0.010 − 0.0212–0.0568 0.849 0.6265–0.9219 CAD–MAU 0.347 0.2505–0.5787 1.000 1.0000–1.0000 0.286 0.1552–0.5641 1.000 1.0000–1.0000 CAD–SES 0.292 0.2809–0.3121 1.000 1.0000–1.0000 0.221 0.2057–0.2486 1.000 1.0000–1.0000 CAD–LIS 0.293 0.2851–0.3025 1.000 1.0000–1.0000 0.225 0.2149–0.2387 1.000 1.0000–1.0000 MAU–SES 0.032 − 0.0185–0.1418 0.874 0.6514–0.9268 − 0.004 − 0.0838–0.1324 0.870 0.6365–0.9269 MAU–LIS 0.034 − 0.0126–0.1443 0.906 0.7612–0.9501 0.011 − 0.0595–0.1397 0.902 0.7422–0.9502 SES–LIS 0.012 0.0023–0.0247 0.658 0.4418–0.8119 0.008 − 0.0105–0.0318 0.654 0.4348–0.8117
0 20 40 60 80 100 120 02 04 06 08 01 00 Individuals 12 0 CHAO1 CR = 690 CHAO1 S7 = 205 1:1 haplotypes
Figure 2. Haplotype rarefaction curves and the Chao 1 estimated total haplotypes for each marker in Diplodus
bellottii. Shaded areas indicate 95% confidence interval from 1000 permutations. The 1:1 line indicates the
maximum where each new sample represents a new haplotype. Figure generated using the chaoHaplo function (https ://CRAN.R-proje ct.org/packa ge=spide r) of the spider package implemented in R language32 (version
3.5.3), and Adobe Illustrator CC2019 (version 23.0.1) (https ://www.adobe .com/produ cts/illus trato r.html).
Locations
A
B
LISBON SESIMBRA MAURITANIA ALGARVE CADIZFigure 3. Statistical parsimony network illustrating the genealogical relationships of Diplodus bellottii among CR (a) and S7 (b) haplotypes (threshold of statistical significance = 95%). The size of the circle corresponds to the haplotype frequency. Pie charts indicate the proportion at which each haplotype occurs at each location. Black dots indicate the number of mutational differences separating sampled haplotypes or hypothetical (unsampled) haplotypes. Figure generated using the TCSBU37 and Adobe Illustrator CC2019 (version 23.0.1)
geo-referenced presence records limited the use of more than four environmental predictors to be included in the consensus prediction D. bellottii potential distribution model.
Hyperdiversity in Diplodus bellottii.
Benthopelagic fish such as D. bellottii usually display genetic diver-sity levels typically lower than pelagic species, due to differences in population sizes (e.g.40). Nevertheless, thediversity levels recorded in D. bellottii were similar to values observed in widely distributed pelagic species such as sardines (e.g.41) or other fish species with larger population sizes (see Table 1 in42). Interestingly, in the
con-generic D. vulgaris43 and D. puntazzo13, the overall CR haplotype (0.983 and 0.998 respectively), and nucleotide
0.01 0.1 GROUP 2 GROUP 1 GROUP 1 GROUP 2
A
B
93 46% 27% 5% 9% 13% 41% 17% 20% 20% 2% Locations LISBON SESIMBRA MAURITANIA ALGARVE CADIZFigure 4. Neighbour-net networks based on 124 mitochondrial DNA CR sequences (a) and 96 S7 nuclear DNA (b) of Diplodus bellottii. Value between groups in CR corresponds to bootstrap replicates. Figure generated using the Splitstree38 and Adobe Illustrator CC2019 (version 23.0.1) (https ://www.adobe .com/produ cts/illus trato
r.html). 0.5 0.6 0.7 0.8 0.9 0.80 0.85 0.90 0.95 1.00 ROC TSS 0.4 0.6 0.8 0.7 0.8 0.9 ROC TSS ANN MAXENT.Phillips CTA MARS RF GBM SRE GLM FDA Runs 1-20
Figure 5. Performance statistics of all the species distribution models. Plot of the mean (dot) and standard deviation (horizontal and vertical lines) of evaluation scores for the different modeling algorithms used with Biomod2, by algorithm (a) or cross-validation (b). Best models are closer to the top-right corner of the graph. TSS: true skill statistics; ROC: area under the receiver operating characteristic curve. Figure generated using the Biomod2 package39 implemented in the R language32 (version 3.5.3), and Adobe Illustrator CC2019 (version
diversity (1.8% and 4.1%) are also very high. Contrariwise, in another species of Diplodus, D. sargus, diversity measures were much lower (h = 0.700 and π = 0.8%)13. The differences between D. puntazzo and D. sargus genetic
diversity values were attributed to a suite of fortuitous occurrences such as extinction and colonisation rather than to ecological differences between the two species13.
The results of the four statistics (GST, G’ST, θ, and D) were very different with GST; and θ, showing few pairwise
significant differences, and G’ST, and D returning all pairwise comparisons significant. It is important to refer
that both θ and GST suffer from the fact that this dataset is hypervariable, therefore restricting these estimators
to values close to zero and overestimating gene flow (for a review see44). On the other hand, both G’
ST and D,
because they measure differentiation as the fraction of a deme’s population that consists of private or near-private alleles45, will always be significantly different from zero. The hypervariable mtDNA in D. bellottii leads to a lack
of shared haplotypes (with rare exceptions) among locations (Supplementary Table S1), but this does not neces-sarily reflect population genetic differentiation by fixation of alternative haplotypes as previously reported by46.
This result may be explained by a single or a combination of small sampling sizes and very high mutation rates. Also, effective population size and demographic stability can be contributing factors, not in the recent colonised locations which may still be locally expanding in numbers, but in the putative source, the most southern location. We have shown that with the number of singletons present, to capture all the haplotypes in the species we would need to elevate the sampling to almost 700 individuals (see Fig. 2) which makes the first explanation plausible but does not rule out the other ones.
The high diversity recorded in D. bellottii is mainly due to a large proportion of singletons (91% and 74%, for CR and S7, respectively) and very few among-location shared haplotypes, 4% and 13%, for CR and S7, respec-tively. This fact makes all locations virtually significantly different from one another, with statistically significant values of D ranging between 0.847–1.000 and 0.849–1.000 for CR and S7, respectively. The expanding low-density leading edge is by definition constituted by edge patches, which are typically affected by founder events35, where
demographic36 and allelic composition stochasticity are predictably stronger. However, alleles present in the
leading edge patches, even if absent from other marginal locations are frequently shared with sites at the centre of the distribution47, which is not observed in our results.
The extremely high level of genetic diversity found across the entire distribution of D. bellottii and the paucity of shared haplotypes throughout all the sampled locations, including the native southern site, place our findings in apparent conflict with “southern richness and northern purity”11 and the peripheral populations
(“central-marginal hypothesis”12) hypotheses. Non-expected high diversity was also found in the leading edge population
of other species (e.g. Taurulus bubalis) suggesting that marine organisms with a long planktonic stage and high numbers of colonisers can travel long distances and export their diversity to the newly colonised areas16. In
these cases, bottlenecks may not occur because populations are not close to the carrying capacity of the habitats.
Diplodus bellottii is a prolific species at least in its southern distribution limit48 and it may have sufficiently large
numbers of individuals to colonise in significantly large waves of individuals.
possible causes of hyperdiversity.
The hyperdiversity displayed by both CR and S7 markers does not automatically suggest restricted gene flow and/or population genetic differentiation. The sampling size did not capture the entire genetic diversity of the species as shown by the rarefaction curve, and did not provide a rea-sonable number of shared haplotypes. Moreover, abnormally high mutation rates may obscure the signal of gene flow49. The haplotype network (Fig. 2) with many unsampled haplotypes and haplotype accumulation curves(Fig. 4) indicate an acute subsampling of haplotypes, despite sampling sizes ranging from 11 to 55 per site, in a total of 124 specimens. As the expected diversity is ca. 690 haplotypes for the CR region and ca. 206 for the S7, many more individuals would be needed to capture a representative level of the genetic diversity of the species. It is therefore plausible that with increased sample sizes, one could detect more haplotypes in more southern locations, such as Mauritania, and shared haplotypes between these locations and the more recent colonised northern sites.
High genetic diversity in CR may have several explanations. The most plausible hypotheses involve: (1) the mutation rate of the fragment, (2) the evolutionary rates hypothesis, or (3) the metabolic rate theory (e.g.50). The
mitochondrial control region is a high-mutation region organized in hypervariable regions flanking a central conserved region and is considered the most variant non-coding gene in fishes (e.g. for groupers51). This
mito-chondrial region is a marker of choice in phylogeographic and connectivity studies (but on the use of hyperdi-verse mtDNA for population differentiation see46). The gastropod Melarhaphe neritoides revealed hypervariable
mitochondrial DNA markers (16S, COI and Cytb) as a consequence of high mutation rates49. The second
hypoth-esis used to explain high mutation rates in tropical areas (D. bellottii is considered a subtropical fish species), suggests that temperature and UV tend to generally increase mutation rates in the mtDNA of vertebrates52. The
third hypothesis, the metabolic rate theory, posits that smaller animals accumulate mutations quicker than large animals53,54. However, it has been shown in the cold-water blue crab Callinectes sapidus, that in each recruitment
event, the genetic diversity could be just as high as the one found in the adult population, although with differ-ent composition55. This would be exactly the opposite of a ‘sweepstakes effect,’ in which a small proportion of
the gene pool contributes to the recruitment of the population56, therefore promoting reduced genetic diversity
of populations. This way, in each seasonal recruitment, a new combination of alleles may constitute the new generation, which could help to explain the high genetic diversity in this blue crab species, even in populations near the limits of the species range55. Indeed, a similar pattern was found in two fish species, Lipophrys pholis and Atherina presbyter, with contrasting life-history patterns in a nursery rocky coastal area in Portugal57. In L. pholis
only two out of 171 haplotypes were shared between three sampling periods, and in A. presbyter 25 haplotypes out of 155 were shared, which reveals an increase of private alleles in the gene pool over the years, even without a significant corresponding increase in diversity indices.
Geographic structure.
Despite the results of this study in which all sampling sites are significantly dif-ferent from each other, no geographical associated structure could be inferred from the networks. Lack of geo-graphic genetic structure can be rooted in large effective population sizes, high potential for dispersal and weak physical barriers to gene flow58,59, all of which possible in D. bellottii. Regarding population sizes, some sparidspresent low effective size (e.g. Pagrus auratus,60), while other species present contrasting high values (as the
congeneric D. sargus61). While the dispersal distance is often used as a function of the pelagic larval duration
(PLD)62,63, there is ample controversy on the subject, with studies finding evidence for uncorrelated individuals’
PLDs and net distance travelled64,65. Although the exact PLD for our species is unknown, it is expected to be
around 17 days, value reported for other Diplodus species (e.g.66); this value may however vary with latitude (a
proxy of sea temperature). Finally, there are no apparent physical barriers between sampled locations, which may promote considerable admixture among individuals from different origins. However, the species distribution modelling evidenced stretches of coast along northwestern Africa that seem to be an unsuitable habitat for the species, which could theoretically foster some level of geographical isolation. Apparently, D. bellottii overreaches those soft barriers keeping its genetic diversity undisturbed.
The concept of “spatial selection” includes the idea that more available resources coupled with less competition may lead to spatial allele sorting and increased growth at the invasion front, with the corresponding increase in reproduction67. Spatial selection would favour dispersal, and since both dispersal and reproductive rate limit
invasion (colonisation) speed, high reproductive rates promote faster range expansions. Because D. bellottii is under thermal stress at 30 °C68, a scenario of spatial selection in the most southern range is rather probable. The
reduced tolerance to higher temperatures, coupled with the species preference for estuaries with large areas and high volumes but low depth nursery grounds, means that an increase in sea surface temperatures may result in habitat loss for juveniles, as the estuaries of southern Europe may get too warm. During the summer of 2006, D.
bellottii was first detected at 40° N (north of Portugal;69) showing the quick continued northward expansion of
this species. Although the results from the species distribution modelling do not show a particular affinity of this species for areas north to Lisbon, the continued raising of sea surface temperature will make these areas suitable for continual range expansion of D. bellottii. The impacts of this species in the recently colonised ecosystems, mainly in what concerns interactions with other species occupying the same ecological niche, has not been fully evaluated. The spatial overlap of D. bellottii with other sparid species is not consistent, across the literature, ranging from 47%69 to 94%30. These large differences may be explained by the dynamics of the estuaries, which
suffer major changes in their hydrological features across the years. A noteworthy observation is that the spatial niche overlap between D. bellottii and D. vulgaris has been shown to increase with latitude69.
origin of the two groups.
The origin of the two groups (Fig. 4) is debatable and somewhat challenging to explain. When an isolation scenario is plausible, the existence of sister groups is easy to envisage. However, it is difficult to propose an allopatric (or peripatric) origin for the geographically co-distributed groups. Their distribution encompasses a continuous coastline with an apparent lack of geographical hard or soft barriers. Moreover, the observed northwards expansion of the two groups makes it difficult to conclude that they have dispersed independently along the Atlantic coastline. Without isolation, different lineages in a continuously distributed coast can arise in a large panmictic population with a long history70. Sometimes it is hard to realizethat any particular genealogy is the single outcome of an infinite number of equally possible genealogies result-ing from stochastic outcome71.
future work and management implications.
This species is an important commercial species in Mau-ritania, but its smaller length in the Lisbon region31, and the existence of more valuable commercial species, hasnot made the Senegal seabream a main fisheries target. In Lisbon, the species is mostly a bycatch of a traditional shallow artisanal fishery31 and for official statistics, D. bellottii is merely recorded as Diplodus sp. The fact of this
species may constitute a future target fishery should prompt an adequate biological survey to assist its proper management. The unexpected pattern of very high diversity in recently-colonised areas within a climate change scenario, deserves further investigation and this species can serve as a useful model for studying the impact of a changing environment on the genetic diversity of a coastal species. Surveys need to be implemented, ecologi-cal implications evaluated, and a genomic temporal approach assessed to understand the causes for a successful colonisation without the loss of genetic diversity levels.
Materials and methods
Sampling.
Adult specimens of D. bellotti were collected from five locations along its distributional range in the northeastern Atlantic (Fig. 1 and Table 1). These sites included: Mauritania, MAU; Cadiz, CAD in South Spain; Algarve, ALG in South Portugal, and Sesimbra, SES and Lisbon, LIS in Central Portugal. After asserting the species identification, fin clips were provided by fishermen. Samples were preserved in 96% ethanol.DNA extraction, amplification and sequencing.
Total genomic DNA was extracted with the REDEx-tract-N-Amp Kit (Sigma-Aldrich) following the manufacturer’s instructions. The mitochondrial control region (CR) and the first intron of the nuclear S7 ribosomal protein gene (S7) were amplified, with the same kit, in a Bio-Rad Mycycler thermal cycler, using L-pro1 and H-DL172, and S7RPEX1F and S7RPEX2R73, using thefol-lowing PCR conditions: initial denaturation at 94 °C for 7′, followed by 35/30 cycles (denaturation at 94 °C for 30/45ʺ, annealing at 55 °C for 30/45ʺ, and extension at 72 °C for 1′; values CR/S7, respectively) and a final exten-sion at 72 °C for 7′. The same primers were used for the sequencing reaction, and the PCR products were purified and sequenced in STABVIDA (Sanger sequencing, https ://www.stabv ida.net/).
Chromatograms were edited with Codon Code Aligner (Codon Code Corporation, https ://www.codon code. com/index .htm) and sequences were aligned with Clustal X 2.174. For the S7 gene forward and reverse strands
were obtained and some samples were sequenced twice for error checking. All sequences were deposited in GenBank (Accession Numbers MF120288-MF120372; and MF120408-MF120464, respectively to CR and S7).
Genetic diversity and geographic structure.
The standard measures of genetic diversity were com-puted for the five location sites separately and after pooling (referred to as “total population”). We used a variety of packages developed for R v.3.6.132 to estimate population genetic statistics. We used pegas75 R-package32 toestimate standard descriptive measures of genetic diversity, including number of haplotypes and private haplo-types, haplotype diversity (h)76,77 and nucleotide diversity (π)76 and respective standard deviations.
To assess population structure, we estimated FST‐like statistics78, such as: (1) Nei’s GST,77, (2) Hedrick’s G′ST79,
(3) Weir and Cockerham θ80 and (4) Jost’s D81 using diveRsity R-package82. While the first three estimators
measure nearness to fixation, the last quantifies the relative degree of allelic differentiation45. We report these
four estimates to provide complementary information on the genetic structure among the Senegal seabream sampled locations. The diveRsity R-package was used to estimate 95% confidence intervals for all estimators using 10,000 bootstrap iterations.
Haplotype accumulation curves.
The spider R-package83 was used to obtain haplotype accumulationcurves by 1000 random permutation subsampling using the functions haploAccum() and plot.haploAccum() supplied in the spider R-package83 and the Chao 1 estimator84, with chaoHaplo() function. Haplotype
accu-mulation curves provide a graphical way to assess the extent of haplotype sampling by representing the extent of saturation as a function of the number of individuals sampled and the number of haplotypes accumulated. Curves displaying weak asymptotic behaviour suggest further sampling is necessary to capture the genetic varia-tion of the species, while curves with rapid saturavaria-tion indicate that much of the intraspecific haplotype diversity was sampled. The Chao1 estimates the appropriate minimum sample size to account for all haplotype diversity based on the sample size and number of detected haplotypes as well as the number of singleton and doubleton sequences (those occurring once and those appearing twice) in the dataset.
Genetic connectivity.
Population genetic connectivity in D. bellottii was investigated by reconstructing haplotype networks using a statistical parsimony algorithm85, implemented in TCS v.1.2186. The raw output wasvisualized in the web implementation of tcsBU37. Additionally, an unrooted neighbour-net network was
con-structed using SplitsTree 487 to investigate the genealogical relationships among haplotypes. The network was
built using HKY + I + G nucleotide substitution model for both markers, as the best selected with the modelTest function of the phangorn88 R-package according to the Akaike Information Criterion89 and compatible with
the distance algorithms available in SplitsTree 4, and equal-angle split transformation90 with 1000 bootstrap
replicates.
Species distribution data: occurrence data.
The georeferenced locations of the observed distribution of Diplodus bellottii was obtained from occurrence records from two databases: OBIS (http:// www.iobis .org/) and GBIF (https ://data.gbif.org/). We used 94 records of Diplodus bellottii compiled from the Global Biodiversity Information Facility (GBIF, https ://www.gbif.org/) and 72 points lifted from the Ocean Biogeographic Infor-mation System (OBIS, http:// www.iobis .org/) and added five own records. Spurious geo-reference errors and duplications were deleted from the initial data. Presence points were limited to within 200 m depth to consider the recorded depth range for this species (between 10 and 90 m depth)91. Finally, the remaining 39 presence cellswere georeferenced to a 0.083° × 0.083° (= 5 arc min ~ 9.2 km) grid resolution.
Species distribution data: environmental data.
The occurrence data was linked to 43 environmen-tal variables available from Bio‐ORACLE92 and MARSPEC93 with a spatial resolution of 5 arcmin using the Rpackage sdmpredictors94. All predictors were delimited up to 200 m depth, given the species known bathymetric
preference95, which enhances modelling performances by limiting the extent of extrapolation.
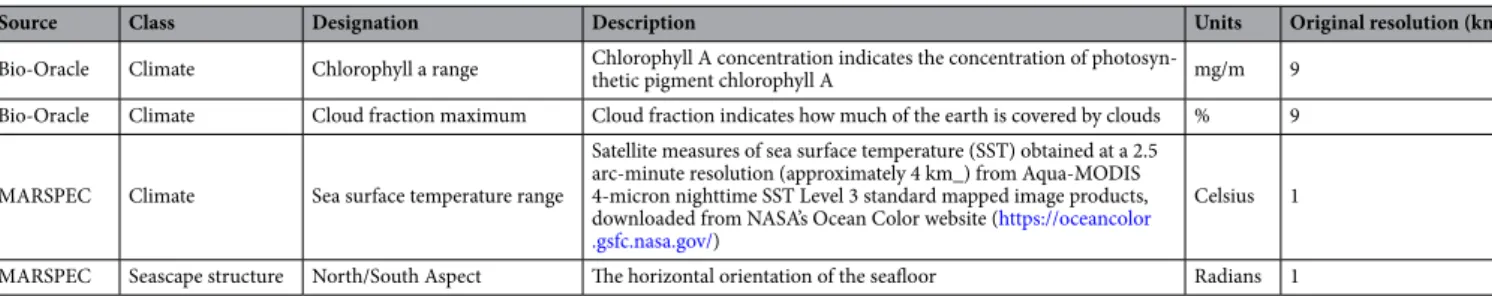
Table 3. Environmental variables used to model current potential distribution of the Senegal seabream (Diplodus bellottii).
Source Class Designation Description Units Original resolution (km)
Bio-Oracle Climate Chlorophyll a range Chlorophyll A concentration indicates the concentration of photosyn-thetic pigment chlorophyll A mg/m 9 Bio-Oracle Climate Cloud fraction maximum Cloud fraction indicates how much of the earth is covered by clouds % 9 MARSPEC Climate Sea surface temperature range
Satellite measures of sea surface temperature (SST) obtained at a 2.5 arc-minute resolution (approximately 4 km_) from Aqua-MODIS 4-micron nighttime SST Level 3 standard mapped image products, downloaded from NASA’s Ocean Color website (https ://ocean color .gsfc.nasa.gov/)
Celsius 1 MARSPEC Seascape structure North/South Aspect The horizontal orientation of the seafloor Radians 1
Species distribution data: variable selection.
The first level of predictor selection, was done by reduc-ing collinearity between predictors, with variance inflation factor (VIF)96 implemented in R package uSDM97,98.We used a stringent VIF value (< 2) to retain predictors, as recommended for ecological studies see99. The final
set of variables was reduced to four (chlorophyll a range, cloud fraction maximum, North–South aspect and sea surface temperature range) complying with two criteria: being conceptually meaningful variables100 and
propor-tion of occurrences to predictors obeying to the general rule of thumb of 10 to 1101 (Table 3).
Species distribution data: modelling approach.
We produced an ensemble approach to obtain predic-tions for the current distribution implemented in biomod2 package102 (v. 3.3–7) for R32. One of the main featuresof the BIOMOD2 software is the ability of producing an ensemble model by combining predictions from single models nine different methods: maximum entropy (MAXENT), general linear models (GLM), general boosted models (GBM, also referred to as boosted regression trees), classification tree analysis (CTA), artificial neural networks (ANN), surface range envelope (SRE), flexible discriminant analysis (FDA), multiple adaptive regres-sion splines (MARS), random forests (RF), with default settings39. Explicit D. bellottii absence records were not
available so we used two sets of pseudo-absences (background data) extracted at random in a proportion of ten pseudo-absences per presence cell103. Data (presences and pseudo-absences) were split at random into a
calibra-tion (70%) and a validacalibra-tion set (30%). We evaluated 140 models: 2 pseudo-absence sets × 10 iteracalibra-tions × 7 mod-els. Models’ performance was evaluated using two measures: the true skill statistic (TSS104) and the area under
the receiver operating characteristic (ROC) curve (AUC)105. For the ensemble modeling, only those models with
a TSS and ROC scores above 0.8, and 0.9, respectively (i.e., with minimum ‘good’ rating) were considered104,106.
All calculations and analyses were performed with R version 3.0.3, with the following R packages raster107,
rgdal108, dismo109, vegan110, sp111, rJava112, performed in R32 using the R2C2 computational facility (https ://rcast
ilho.pt/R2C2/R2C2_clust er.html).
Received: 19 December 2019; Accepted: 7 July 2020
References
1. Vergés, A. et al. The tropicalization of temperate marine ecosystems: climate-mediated changes in herbivory and community phase shifts. Proc. R. Soc. B Biol. Sci. 281, 20140846 (2014).
2. Cheung, W. W., Watson, R. & Pauly, D. Signature of ocean warming in global fisheries catch. Nature 497, 365–368 (2013). 3. López, C., Moreno, S., Brito, A. & Clemente, S. Distribution of zooxanthellate zoantharians in the Canary Islands: potential
indicators of ocean warming. Estuar. Coast. Shelf Sci. 233, 106519 (2020).
4. Perry, A. L., Low, P. J., Ellis, J. R. & Reynolds, J. D. Climate change and distribution shifts in marine fishes. Science 308, 1912–1915.
https ://doi.org/10.1126/scien ce.11113 22 (2005).
5. Encarnação, J., Morais, P., Baptista, V., Cruz, J. & Teodósio, M. A. New evidence of marine fauna tropicalization off the south-western Iberian Peninsula (southwest Europe). Diversity 11, 48 (2019).
6. Engelhard, G. H., Righton, D. A. & Pinnegar, J. K. Climate change and fishing: a century of shifting distribution in North Sea cod. Glob. Change Biol. 20, 2473–2483 (2014).
7. Hewitt, G. M. Some genetic consequencies of ice ages, and their role in divergence and speciation. Biol. J. Lin. Soc. 58, 247–276.
https ://doi.org/10.1111/j.1095-8312.1996.tb014 34.x (1996).
8. Ibrahim, K. M., Nichols, R. A. & Hewitt, G. M. Spatial patterns of genetic variation generated by different forms of dispersal during range expansion. Heredity 77, 282–291. https ://doi.org/10.1038/hdy.1996.142 (1996).
9. Kot, M., Lewis, M. A. & van den Driessche, P. Dispersal data and the spread of invading organisms. Ecology 77, 2027–2042 (1996).
10. Nichols, R. A. & Hewitt, G. M. The genetic consequences of long distance dispersal during colonization. Heredity 72, 312–317 (1994).
11. Hewitt, G. M. The genetic legacy of the Quaternary ice ages. Nature 405, 907–913 (2000).
12. Eckert, C. G., Samis, K. E. & Lougheed, S. C. Genetic variation across species’ geographical ranges: the central–marginal hypoth-esis and beyond. Mol. Ecol. 17, 1170–1188. https ://doi.org/10.1111/j.1365-294X.2007.03659 .x (2008).
13. Bargelloni, L. et al. The Atlantic–Mediterranean transition: discordant genetic patterns in two seabream species, Diplodus pun-tazzo (Cetti) and Diplodus sargus (L.). Mol. Phylogenet. Evol. 36, 523–535. https ://doi.org/10.1016/j.ympev .2005.04.017 (2005). 14. Bargelloni, L. et al. Discord in the family Sparidae (Teleostei): divergent phylogeographical patterns across the
Atlantic–Mediter-ranean divide. J. Evol. Biol. 16, 1149–1158. https ://doi.org/10.1046/j.1420-9101.2003.00620 .x (2003).
15. Francisco, S. M. et al. Phylogeography of the shanny Lipophrys pholis (Pisces: Blenniidae) in the NE Atlantic records signs of major expansion event older than the last glaciation. J. Exp. Mar. Biol. Ecol. 403, 14–20 (2011).
16. Almada, V. C., Almada, F., Francisco, S. M., Castilho, R. & Robalo, J. I. Unexpected high genetic diversity at the extreme Northern geographic limit of Taurulus bubalis (Euphrasen, 1786). PLoS ONE 7, e44404 (2012).
17. Gysels, E. S., Hellemans, B., Pampoulie, C. & Volckaert, F. A. M. Phylogeography of the common goby, Pomatoschistus microps, with particular emphasis on the colonization of the Mediterranean and the North Sea. Mol. Ecol. 13, 403–417 (2004). 18. Robalo, J. I. et al. Northern refugia and recent expansion in the North Sea: the case of the wrasse Symphodus melops (Linnaeus,
1758). Ecol. Evol. 2, 153–164. https ://doi.org/10.1002/ece3.77 (2012).
19. Almada, F. et al. Historical gene flow constraints in a northeastern Atlantic fish: phylogeography of the ballan wrasse Labrus bergylta across its distribution range. Proc. R. Soc. Open Sci. 4, 160773 (2017).
20. Ramos, J. E. et al. Population genetic signatures of a climate change driven marine range extension. Sci. Rep. 8, 9558 (2018). 21. Silva, G., Horne, J. B. & Castilho, R. Anchovies go north and west without losing diversity: post-glacial range expansions in a
small pelagic fish. J. Biogeogr. 41, 1171–1182. https ://doi.org/10.1111/jbi.12275 (2014).
22. Froese, R. and Pauly, D. FishBase. World Wide Web Electron. Publ. Available from: https ://www.fishb ase.org/ (version 01/2020). 23. Wirtz, P. et al. The coastal fishes of the Cape Verde Islands—new records and an annotated check-list. Spixiana 36, 113–142
(2013).
24. Bonnet, M. Les sparidés des côtes nord-ouest africaines. Rev. Trav. Inst. Pêches Marit. 33, 97–116 (1969).
25. Aloncle, H. Note sur un petit Diplodus des cotes du Maroc. Bulletin de l’Institut des Pêches Maritimes du Maroc 13, 39–50 (1965). 26. Rucabado, J. & LLoris, D. Sobre la presencia de Diplodus senegalensis Cadenat, 1964, en el area de afloramiento del NW de Africa
27. Monteiro, C., Lam Hoai, T. & Lasserre, G. Distribution chronologique des poissons dans deux stations de la lagune Ria Formosa (Portugal). Oceanol. Acta 10, 359–371 (1987).
28. Cabral, H., Costa, M. & Salgado, J. Does the Tagus estuary fish community reflect environmental changes?. Clim. Res. 18, 119–126 (2001).
29. Vinagre, C., França, S. & Cabral, H. Diel and semi-lunar patterns in the use of an intertidal mudflat by juveniles of Senegal sole, Solea senegalensis. Estuar. Coast. Shelf Sci. 69, 246–254 (2006).
30. Horta, M., Costa, M. J. & Cabral, H. Spatial and trophic niche overlap between Diplodus bellottii and Diplodus vulgaris in the Tagus estuary, Portugal. J. Mari. Biol. Assoc. U. K. 84, 837–842 (2004).
31. Henriques, C. V. L. V. Biologia, filogeografia e história demográfica do Sargo-do-Senegal, Diplodus bellotti (Steindachner, 1882) no sul do Nordeste Atlântico. (2018).
32. R Core Team. R: A Language and Environment for Statistical Computing (R Foundation for Statistical Computing, Vienna, Austria, 2019). https ://www.R-proje ct.org/. Accessed February 2019.
33. Robalo, J. I. et al. Are local extinctions and recolonizations continuing at the colder limits of marine fish distributions? Haloba-trachus didactylus (Bloch & Schneider, 1801), a possible candidate. Mar. Biol. 160, 2461–2467 (2013).
34. Knutsen, H. et al. Climate change and genetic structure of leading edge and rear end populations in a northwards shifting marine fish species, the corkwing wrasse (Symphodus melops). PLoS ONE 8, e67492 (2013).
35. Excoffier, L. & Ray, N. Surfing during population expansions promotes genetic revolutions and structuration. Trends Ecol. Evol.
23, 347–351. https ://doi.org/10.1016/j.tree.2008.04.004 (2008).
36. Snyder, R. E. How demographic stochasticity can slow biological invasions. Ecology 84, 1333–1339 (2003).
37. Múrias dos Santos, A., Cabezas, M. P., Tavares, A. I., Xavier, R. & Branco, M. tcsBU: a tool to extend TCS network layout and visualization. Bioinformatics 32, 627–628 (2015).
38. Huson, D. H. SplitsTree: analyzing and visualizing evolutionary data. Bioinformatics 14, 68–73 (1998).
39. Thuiller, W., Lafourcade, B., Engler, R. & Araújo, M. B. BIOMOD—a platform for ensemble forecasting of species distributions. Ecography 32, 369–373. https ://doi.org/10.1111/j.1600-0587.2008.05742 .x (2009).
40. Hauser, L. & Ward, R. D. Population identification in Pelagic fish: the limits of molecular markers. Adv. Mol. Ecol. 306, 191–224 (1998).
41. Bowen, B. W. & Grant, W. S. Phylogeography of the sardines (Sardinops spp.): assessing biogeographic models and population histories in temperate upwelling zones. Evolution 51, 1601–1610 (1997).
42. Neilson, M. E. & Wilson, R. R. Jr. mtDNA singletons as evidence of a post-invasion genetic bottleneck in yellowfin goby Acan-thogobius flavimanus from San Francisco Bay, California. Mar. Ecol. Prog. Ser. 296, 197–208 (2005).
43. Stefanni, S. et al. Establishment of a coastal fish in the Azores: recent colonisation or sudden expansion of an ancient relict population?. Heredity 115, 527–537 (2015).
44. Meirmans, P. G. & Hedrick, P. W. Assessing population structure: F(ST) and related measures. Mol. Ecol. Res. 11, 5–18. https :// doi.org/10.1111/J.1755-0998.2010.02927 .X (2011).
45. Jost, L. et al. Differentiation measures for conservation genetics. Evol. Appl. 11, 1139–1148 (2018).
46. Fourdrilis, S. & Backeljau, T. Highly polymorphic mitochondrial DNA and deceiving haplotypic differentiation: implications for assessing population genetic differentiation and connectivity. BMC Evol. Biol. 19, 92 (2019).
47. Maggs, C. A. et al. Evaluating signatures of glacial refugia for North Atlantic benthic marine taxa. Ecology 89, S108–S122. https ://doi.org/10.1890/08-0257.1 (2008).
48. Sloterdijk, H. et al. Composition and structure of the larval fish community related to environmental parameters in a tropical estuary impacted by climate change. Estuar. Coast. Shelf Sci. 197, 10–26 (2017).
49. Fourdrilis, S. et al. Mitochondrial DNA hyperdiversity and its potential causes in the marine periwinkle Melarhaphe neritoides (Mollusca: Gastropoda). PeerJ 4, e2549 (2016).
50. Canales-Aguirre, C. B., Ferrada-Fuentes, S., Galleguillos, R., Oyarzun, F. X. & Hernandez, C. E. Population genetic structure of Patagonian toothfish (Dissostichus eleginoides) in the Southeast Pacific and Southwest Atlantic Ocean. PeerJ https ://doi. org/10.7717/peerj .4173 (2018).
51. Zhuang, Z. R., Yang, X. D., Huang, X. Z., Gu, H. X., Wei, H. Y., He, Y. J., & Deng, L. Three new piscidins from orange-spotted grouper (Epinephelus coioides): Phylogeny, expression and functional characterization. Fish Shellfish Immunol. 66, 240–253 (2017).
52. Evans, K. & Gaston, K. Can the evolutionary-rates hypothesis explain species-energy relationships?. Funct. Ecol. 19, 899–915 (2005).
53. Martin, A. P. & Palumbi, S. R. Protein evolution in different cellular environments: cytochrome b in sharks and mammals. Mol. Biol. Evol. 10, 873–891 (1993).
54. Rand, D. M. Thermal habit, metabolic rate and the evolution of mitochondrial DNA. Trends Ecol. Evol. 9, 125–131 (1994). 55. Feng, X., Williams, E. P. & Place, A. R. High genetic diversity and implications for determining population structure in the blue
crab Callinectes sapidus. J. Shellfish Res. 36, 231–243 (2017).
56. Hedgecock, D. Does variance in reproductive success limit effective population sizes of marine organisms. Genet. Evol. Aquat. Org. 122, 122–134 (1994).
57. Francisco, S. & Robalo, J. Genetic structure and effective population size through time: a tale on two coastal marine species with contrasting life-history patterns. Phylogenet. Evol. Biol. 3, 155 (2015).
58. Avise, J. C. in Proceedings of Stock Identification Workshop (eds Kumpf, E. H., Vaught, R. N., Grimes, C. B. & Johnson, A. G.) 105–136 (Panama City Beach, Florida, NOAA Technical Memorandum NMFS-SEFC-199).
59. Gold, J. R., Richardson, L. R., Furman, C. & Sun, F. Mitochondrial DNA diversity and population structure in marine fish species from the Gulf of Mexico. Can. J. Fish. Aquat. Sci. 51, 205–214 (1994).
60. Hauser, L., Adcock, G. J., Smith, P. J., BernalRamirez, J. H. & Carvalho, G. R. Loss of microsatellite diversity and low effective population size in an overexploited population of New Zealand snapper (Pagrus auratus). Proc. Natl. Acad. Sci. 99, 11742–11747 (2002).
61. Francisco, S. M., & Robalo, J. I. Time matters: genetic composition and evaluation of effective population size in temperate coastal fish species. PeerJ 8, e9098 (2020).
62. Bremer, J. R. A., Viñas, J., Mejuto, J., Ely, B. & Pla, C. Comparative phylogeography of Atlantic bluefin tuna and swordfish: the combined effects of vicariance, secondary contact, introgression, and population expansion on the regional phylogenies of two highly migratory pelagic fishes. Mol. Phylogenet. Evol. 36, 169–187 (2005).
63. Søren, F. & Barber, P. H. Theoretical limits to the correlation between pelagic larval duration and population genetic structure. Mol. Ecol. 21, 3419–3432 (2012).
64. Weersing, K. & Toonen, R. Population genetics, larval dispersal, and connectivity in marine systems. Mar. Ecol. Prog. Ser. 393, 1–12 (2009).
65. D’Aloia, C. C. et al. Patterns, causes, and consequences of marine larval dispersal. Proc. Natl. Acad. Sci. 112, 13940–13945 (2015). 66. Raventós, N. & Macpherson, E. Planktonic larval duration and settlement marks on the otoliths of Mediterranean littoral fishes.
Mar. Biol. 138, 1115–1120 (2001).
67. Ochocki, B. M. & Miller, T. E. Rapid evolution of dispersal ability makes biological invasions faster and more variable. Nat. Commun. 8, 14315. https ://doi.org/10.1038/ncomm s1431 5 (2017).
68. Vinagre, C., Narciso, L., Cabral, H. N., Costa, M. J. & Rosa, R. Thermal sensitivity of native and invasive seabreams. Mar. Ecol.
35, 292–297 (2014).
69. Vinagre, C., Cabral, H. & Costa, M. Relative importance of estuarine nurseries for species of the genus Diplodus (Sparidae) along the Portuguese coast. Estuar. Coast. Shelf Sci. 86, 197–202 (2010).
70. Rogers, A. R. & Harpending, H. Population growth makes waves in the distribution of pairwise genetic differences. Mol. Biol. Evol. 9, 552–569 (1992).
71. Grant, W. S., Liu, M., Gao, T. & Yanagimoto, T. Limits of Bayesian skyline plot analysis of mtDNA sequences to infer histori-cal demographies in Pacific herring (and other species). Mol. Phylogenet. Evol. 65, 203–212. https ://doi.org/10.1016/j.ympev .2012.06.006 (2012).
72. Ostellari, L., Bargelloni, L., Penzo, E., Patarnello, P. & Patarnello, T. Optimization of single-strand conformation polymorphism and sequence analysis of the mitochondrial control region in Pagellus bogaraveo (Sparidae, Teleostei): rationalized tools in fish population biology. Anim. Genet. 27, 423–427. https ://doi.org/10.1111/j.1365-2052.1996.tb005 10.x (1996).
73. Chow, S. & Hazama, K. Universal PCR primers for S7 ribosomal protein gene introns in fish. Mol. Ecol. 7, 1255–1256 (1998). 74. Larkin, M. A. et al. Clustal W and Clustal X version 2.0. Bioinformatics 23, 2947–2948 (2007).
75. Paradis, E. pegas: an R package for population genetics with an integrated–modular approach. Bioinformatics 26, 419–420. https ://doi.org/10.1093/bioin forma tics/btp69 6 (2010).
76. Nei, M. in Population Genetics & Fishery Management (eds Ryman, N. & Utter, F. W.) 193–223 (Washington Sea Grant Program, University of Washington, 1987).
77. Nei, M. Molecular Evolutionary Genetics (Columbia University Press, New York, 1987).
78. Wright, S. The interpretation of population structure by F-statistics with special regard to systems of mating. Evolution 19, 395–420 (1965).
79. Hedrick, P. W. A standardized genetic differentiation measure. Evolution 59, 1633–1638 (2005).
80. Weir, B. S. & Cockerham, C. C. Estimating F-statistics for the analysis of population structure. Evolution 38, 1358–1370. https ://doi.org/10.2307/24086 41 (1984).
81. Jost, L. D vs. GST: response to Heller and Siegismund (2009) and Ryman and Leimar (2009). Mol. Ecol. 18, 2088–2091 (2009). 82. Hastie, T., Tibshirani, R. & Buja, A. Flexible discriminant analysis by optimal scoring. J. Am. Stat. Assoc. 89, 1255–1270 (1994). 83. Brown, S. D. et al. Spider: an R package for the analysis of species identity and evolution, with particular reference to DNA
barcoding. Mol. Ecol. Res. 12, 562–565 (2012).
84. Chao, A. Nonparametric estimation of the number of classes in a population. Scand. J. Stat. 11, 265–270 (1984).
85. Templeton, A. R., Crandall, K. A. & Sing, C. F. A cladistic analysis of phenotypic associations with haplotypes inferred from restriction endonuclease mapping and DNA sequence data. III. Cladogram estimation. Genetics 132, 619–633 (1992). 86. Clement, M., Snell, Q., Walke, P., Posada, D. & Crandall, K. TCS: estimating gene genealogies. In HICOMB-First International
Workshop on High Performance Computational Biology, 184–190 (2002).
87. Bryant, D. & Moulton, V. Neighbor-net: an agglomerative method for the construction of phylogenetic networks. Mol. Biol. Evol. 21, 255–265 (2004).
88. Schliep, K. P. phangorn: Phylogenetic analysis in R. Bioinformatics 27, 592–593 (2011).
89. Sakamoto, Y., Ishiguro, M. & Kitagawa, G. Akaike Information Criterion Statistics Vol. 81 (D. Reidel, Dordrecht, 1986). 90. Dress, A. W. & Huson, D. H. Constructing splits graphs. IEEE/ACM Trans. Comput. Biol. Bioinf. 1, 109–115 (2004).
91. Santos, M. N., Monteiro, C. C., Erzini, K. & Lasserre, G. Maturation and gill-net selectivity of two small sea breams (genus Diplodus) from the Algarve coast (south Portugal). Fish. Res. 36, 185–194 (1998).
92. Assis, J. et al. Bio-ORACLE v2.0: extending marine data layers for bioclimatic modelling. Glob. Ecol. Biogeogr. 27, 277–284 (2018).
93. Sbrocco, E. J. & Barber, P. H. MARSPEC: ocean climate layers for marine spatial ecology: ecological archives E094-086. Ecology
94, 979–979 (2013).
94. Bosch, S., Tyberghein, L., & De Clerck, O. sdmpredictors: Species distribution modelling predictor datasets. R package version 0.9. Available at: https ://githu b.com/lifew atch/sdmpr edict ors (2016).
95. Froese, R. & Pauly, D. FishBase. World Wide Web Electronic Publication. www.fishb ase.org (version 08/2019).
96. Neter, J., Kutner, M. H., Nachtsheim, C. J. & Wasserman, W. Applied Linear Statistical Models Vol. 4 (Irwin, Chicago, 1996). 97. Naimi, B. usdm: Uncertainty analysis for species distribution models. R Package Version 1, 1–12 (2015).
98. Naimi, B., Hamm, N. A., Groen, T. A., Skidmore, A. K. & Toxopeus, A. G. Where is positional uncertainty a problem for species distribution modelling?. Ecography 37, 191–203 (2014).
99. Steen, V., Sofaer, H. R., Skagen, S. K., Ray, A. J. & Noon, B. R. Projecting species’ vulnerability to climate change: which uncer-tainty sources matter most and extrapolate best?. Ecol. Evol. 7, 8841–8851 (2017).
100. Guisan, A. & Zimmermann, N. E. Predictive habitat distribution models in ecology. Ecol. Model. 135, 147–186 (2000). 101. Harrell, F. E., Lee, K. L. & Mark, D. B. Tutorial in biostatistics multivariable prognostic models: issues in developing models,
evaluating assumptions and adequacy, and measuring and reducing errors. Stat. Med. 15, 361–387 (1996).
102. Thuiller, W., Georges, D., Engler, R., Breiner, F., Georges, M.D., Thuiller, C.W. Package ‘biomod2’. Available at: https ://cran.rproj ect.org/web/packa ges/biomo d2 (2016).
103. Chefaoui, R. M., Assis, J., Duarte, C. M. & Serrão, E. Landscape metrics as indicators of coastal morphology and its use in ecological niche modelling of seagrass species. Ecol. Interface 39, 448–448 (2015).
104. Allouche, O., Tsoar, A. & Kadmon, R. Assessing the accuracy of species distribution models: prevalence, kappa and the true skill statistic (TSS). J. Appl. Ecol. 43, 1223–1232. https ://doi.org/10.1111/j.1365-2664.2006.01214 .x (2006).
105. Fielding, A. H. & Bell, J. F. A review of methods for the assessment of prediction errors in conservation presence/absence models. Environ. Conserv. 24, 38–49 (1997).
106. Shabani, F., Kumar, L. & Ahmadi, M. Assessing accuracy methods of species distribution models: AUC, specificity, sensitivity and the true skill statistic. GJHSS Geo Geo-Sci. Eviron. Sci. Dis. Manag. 18, 6–18 (2018).
107. Hijmans, R. J. Package “raster”: Geographic Data Analysis and Modeling. R package version 2.1-48. https ://cran.r-proje ct.org/ web/packa ges/raste r. (2013). Accessed February 2019.
108. Bivand, R. et al. Package ‘rgdal’: Bindings for the Geospatial Data Abstraction Library. R package version 1.4-6. https ://cran.r-proje ct.org/web/packa ges/rgdal . (2015). Accessed February 2019.
109. Package ‘dismo’: Species Distribution Modeling. R package version 1.1-4. https ://cran.r-proje ct.org/web/packa ges/dismo (R pack-age version 1.0-12) (2014). Accessed February 2019.
110. Oksanen, J. et al. The vegan package. Community Ecol. Package 10, 631–637 (2007).
111. Pebesma, E., Bivand, R., Pebesma, M. E., RColorBrewer, S. & Collate, A. Package ‘sp’: Classes and methods for spatial data in R. R package version 1.3-2. R News 5. https ://cran.r-proje ct.org/web/packa ges/sp. (2012). Accessed February 2019.
112. Urbanek, S. Package ‘rJava’: rJava: Low-Level R to Java Interface. R package version 0.9-11. https ://cran.r-proje ct.org/web/packa ges/rJava . (2019). Accessed February 2019.
Acknowledgements
This study was funded by Fundação para a Ciência e Tecnologia (FCT) Portugal, through the strategic project UID/MAR/04292/2019 granted to MARE (MARE-ISPA) and UID/Multi/04326/2019 granted to CCMAR. C.V.H. was supported by a Ph.D. FCT Grant (SFRH/BD/65078/2009). We thank the IT Services of the University of Algarve for hosting and maintaining the R2C2 (http://rcast ilho.pt/R2C2/R2C2_clust er.html) computational cluster facility. Acknowledgement to the R-community for the unselfish support given while analysing data.
Author contributions
J.I.R. and R.C. drafted the manuscript; J.I.R. designed and planned the study; S.M.F., A.P. and R.C. analysed the data; B.P.B. developed custom R-scripts for analysis under R.C. suggestions; R.C. designed all the figures; C.V.H, M.D. and L.G. were responsible for field work, C.S.L. has performed lab work. All authors reviewed and edited the final version of the manuscript.
competing interests
The authors declare no competing interests.
Additional information
Supplementary information is available for this paper at https ://doi.org/10.1038/s4159 8-020-69374 -4. Correspondence and requests for materials should be addressed to R.C.
Reprints and permissions information is available at www.nature.com/reprints.
Publisher’s note Springer Nature remains neutral with regard to jurisdictional claims in published maps and institutional affiliations.
Open Access This article is licensed under a Creative Commons Attribution 4.0 International License, which permits use, sharing, adaptation, distribution and reproduction in any medium or format, as long as you give appropriate credit to the original author(s) and the source, provide a link to the Creative Commons license, and indicate if changes were made. The images or other third party material in this article are included in the article’s Creative Commons license, unless indicated otherwise in a credit line to the material. If material is not included in the article’s Creative Commons license and your intended use is not permitted by statutory regulation or exceeds the permitted use, you will need to obtain permission directly from the copyright holder. To view a copy of this license, visit http://creat iveco mmons .org/licen ses/by/4.0/.