E-mail: [email protected]
Rev. Ambient. Águavol. 9 n. 2 Taubaté - Apr. / Jun. 2014
Production and use of biogas in Europe: a survey of current status and
perspectives
doi: 10.4136/ambi-agua.1324
Received: 21 Feb. 2014; Accepted: 03 Jun. 2014
Massimo Raboni1;Giordano Urbini2*
1
Politecnico di Milano, Milan, Italy
Department of Chemistry, Materials, Chemical Engineering “Giulio Natta” 2
University of Insubria, Varese, Italy Department of Biotechnologies and Life Sciences *Corresponding author: e-mail:[email protected],
ABSTRACT
The article presents the results of a survey carried out in the European Union (EU) regarding the production and use of biogas from different sources. The EU is a world leader in the field of biogas, with a production of 10,085.8 ktoe y-1 (in 2011) in terms of primary energy, accounting for about 60% of the world’s production. Germany is the EU country that has made the greatest progress in this field with a production of as much as 5,067.6 ktoe y-1, of which a share of 4,414.2 ktoe y-1 results from anaerobic digestion (and co-digestion) processes of selected organic matrices. UK is the second largest producer with 1,764.8 ktoe y-1, determined for 84% by landfill biogas and the remainder by biogas produced in sewage treatment plants (sludge digestion). Italy (1,095.7 ktoe y-1) and France (349.6 ktoe y-1) follow in the list of the largest producers. The trend of biogas production, in accordance with the action lines of the EU, is characterized by a progressive increase from anaerobic digestion (and co-digestion) of selected organic matrices and a progressive decrease from landfills. Production in 2020 is estimated at 28.0 Mtoe y-1 in accordance with the EU Renewable Energy National Plans. The uses of biogas are mainly directed to the production of electricity and heat. There are, however, several cases of conversion of biogas into biomethane injected into the natural gas grids or used as biofuel in vehicles. In this last direction, worthy of note are a few north-central EU countries which have implemented an effective policy to promote the use of biomethane for public and private transport.
Keywords: natural gas, biofuels, renewable energies.
Produção e utilização de biogás na Europa: um levantamento da
situação atual e perspectivas
RESUMO
mundial. A Alemanha é o país europeu que tem feito os maiores progressos neste domínio, com uma produção tanto quanto 5.067,6 ktoe ano-1, dos quais uma parte de 4.414,2 ktoe ano-1 resulta dos processos de digestão anaeróbia (e co-digestão) de matrizes orgânicas selecionadas. O Reino Unido é o segundo maior produtor da Europa com uma quota de 1.764,8 ktoe ano-1, com 84% do biogás proveniente de aterros sanitários e o restante produzido em estações de tratamento de esgotos (digestão do lodo). Itália (1.095,7 ktoe ano-1) e França (349,6 ktoe ano-1) seguem na lista dos maiores produtores europeus de biogás. A tendênciade produção de biogás, de acordo com as linhas de ação da UE, é caracterizada por um aumento progressivo na produção de biogás em plantas de digestão anaeróbica (e co-digestão) de matrizes orgânicas selecionadas e uma diminuição progressiva da produção de aterros sanitários, com uma estimativa de 28,0 Mtoe ano-1 a serem produzidos em 2020, de acordo com os Planos Nacionais de Energias renováveis da UE. Os usos do biogás são direcionados principalmente para a produção de eletricidade e calor. Há, no entanto, vários casos de conversão de biogás em biometano a ser injetado na rede de gás natural ou para ser usado diretamente como gás biocarburante em veículos. Esta tendência ocorre principalmente em alguns países do centro-norte da UE, que têm implementado uma política eficaz para promover o uso de biometano para transportes públicos e privados.
Palavras-chave: gás natural, biocarburantes, energia renovável.
1. INTRODUCTION
Biogas is a renewable source of energy, whose consumption amounts to 19% (at 2011) of global energy consumption (REN21, 2013). The largest renewable energy consumption is given by the traditional biomass (9.3% of the total consumption of renewable energy), while the share of biofuels in the energy market is still limited to 0.8%.
The global market of biofuels, which produced about 62 Mtoe y-1 in 2011 (Raboni et al., 2013) is notoriously dominated by bioethanol and biodiesel. Bioethanol is industrially produced from sugar cane, wheat, corn and sugar beet. Instead, biodiesel is made from vegetable oils and, in limited cases, from fats and waste cooking oils (Torres et al., 2013). The share of biogas amounts to 17.2 Mtoe y-1, which corresponds to about 0.25% of the global energy market.
Despite this small market share, since 2000 the EU policies in support of renewable energy have promoted and developed programs and strategies to implement the production of biofuels (European Commission, 2000; 2011a; 2011b; Commission of the EU, 2007) also issuing specific directives (EU Parliament, 2001; 2003; 2009). Estimates predict that the production of biofuels in the EU, currently amounting to 16.9 million tonnes y-1, should reach 41 million tonnes y-1 in 2025 (Commission of the EU, 2007). In fact, the production of biodiesel in the EU will grow from the current 9.0 million tonnes y-1 up to a maximum of about 20-25 million tonnes y-1, almost saturating its production capacity. Instead, the production of bioethanol could be hardly increased because the EU strategy is focused on the conversion of ligno-cellulosic biomass, with rather complex chemical-biological processes. In any case, these processes will not be cost-competitive with bioethanol from sugar cane produced in large quantities in Brazil. From this, we can understand why the EU must rely on the contribution of biogas to be used primarily for the production of electricity and heat, but in some cases upgraded to biomethane for vehicle refuelling or to feed natural gas grids.
Rev. Ambient. Águavol. 9 n. 2 Taubaté - Apr / Jun. 2014 oriented to the implementation of anaerobic digestion plants of selected organic matrices and can be considered an important aspect of the modern EU policy for waste disposal.
2. SURVEY METHODS
The following methods were used for the survey:
Bibliographic research on the production and use of biogas in different EU countries as well as a comparison with world production;
Collection of documents concerning legislation and planning (or strategies) issued by the EU and its Member States, aimed at promoting and encouraging the production of biogas and its conversion into energy;
Collection of technical information about plants constructed in Italy and other EU countries (e.g.: type of waste fed; process and technology; material and energy balances; design criteria; operating costs). The collection was supported with a visit to 225 installations selected by type of waste treated, process and technology, capacity, presence of biogas upgrading to biomethane systems);
Check of the biogas treatment processes and its conversion into energy.
The results presented in this paper are a concise part of the more complex work produced by the research team.
3. RESULTS AND DISCUSSION
3.1. The leading role of the EU in biogas world production
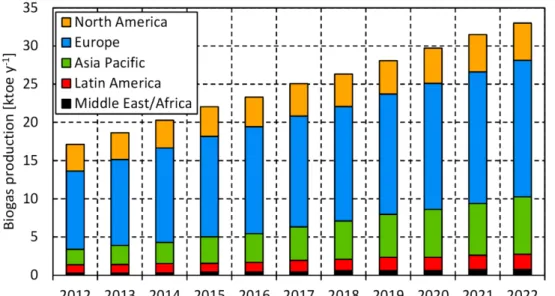
Figure 1 shows the world biogas production at 2012 and its trend till 2022 (Pike Research, 2012). In 2012, this production amountedto 17,200ktoey-1: about 60%is given by Europe (about 10,500 ktoe y-1), while the contribution of North America is limited to approximately 22.0%. Minor contributions are given by the Asia-Pacific (about 11%), Latin America (6%) and the Middle East-Africa (about 1.0%).
Figure 1. Biogas production at 2012 and trend to 2022 in different areas of the world (Pike Research, 2012).
(EU Parliament, 1991; 2008a), waste landfills (EU Parliament, 1999) and other regulations concerning agricultural and zootechnical waste (Commission of the EU, 2006; EU Parliament, 2008b), which have promoted the policy of waste recovery and recycling, restricting landfill disposal only to final residues. The first-mentioned directives have strongly encouraged the separate collection of MSW (in many EU cities it has exceeded 60% by weight) and have subsequently increased interest in the construction of digestion plants fed by the selected organic fraction of MSW (or co-digestion of the same in combination with residues from agriculture, sewage sludge as well as food industry and livestock waste). According to National Renewable European Action Plans (NREAP), biogas production in the EU is expected to reach approximately 28,000 ktoe y-1 by 2022 (Beurskens et al., 2011; Van Foreest, 2012). The EU will drive global biogas production growth to about 33,000 ktoe y-1 by 2022. Significant growth is also estimated for the Asia-Pacific area, whereas smaller increases are foreseen for Latin America and especially for Africa, where the biogas will continue to be limited to the satisfaction of the primary energy needs (light and cooking) of rural areas.
3.2. Production and use of biogas in the different EU countries
3.2.1. Current biogas production
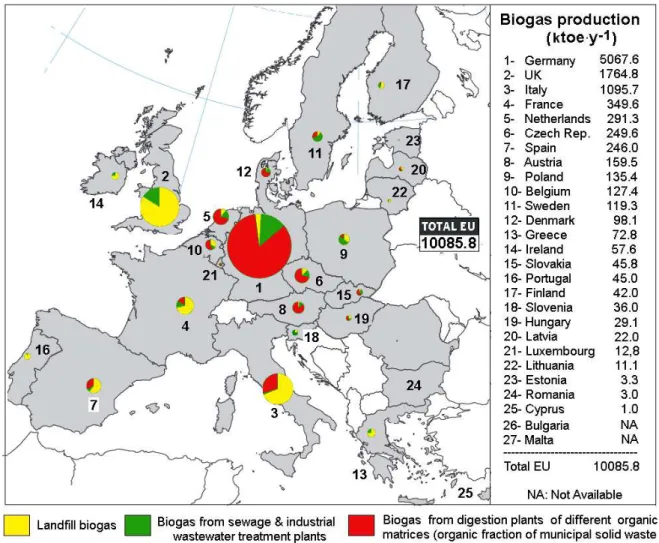
Figure 2 provides an overview of immediate understanding regarding biogas production in the EU countries at 2011.
Rev. Ambient. Águavol. 9 n. 2 Taubaté - Apr / Jun. 2014
Production is assessed in relation to the three main sources:
Landfill gas;
Biogas from municipal and industrial wastewater treatment plants;
Biogas from anaerobic digestion plants fed by different organic matrices (mainly organic fraction of municipal solid waste, food and agro industry, agricultural residues, livestock manure).
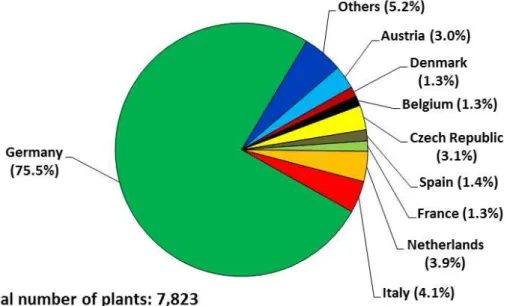
Total production of biogas, in terms of primary energy, amounts to 10,085.8 ktoe y-1. This value represents the production of biogas effectively converted into energy, and thus excludes the quantities of biogas destroyed in torch. As much as 50.2% of the whole production is done by Germany (5,067.6 ktoe y-1). United Kingdom (1,764.8 ktoe y-1) is the second EU producer, followed by Italy (1,095.7 ktoe y-1) and France (349.6 ktoe y-1). Unlike Germany, in Italy, France, Spain, and even more in UK, biogas production is still strongly bound to old landfills. In the last decade, Germany has promoted the more reliable and effective policy for the promotion of this form of renewable energy through the construction of numerous digestion plants fed by selected organic matrices. In this country, the number of operating plants (anaerobic digester for selected organic matrices) reached 5,905 in 2011 (out of total 7,823 built in the whole EU), while in the same year 1,305 new plants were commissioned. Figure 3 shows the distribution of digestion plants in the different EU countries.
Figure 3. Digestion plants distribution in the EU countries.
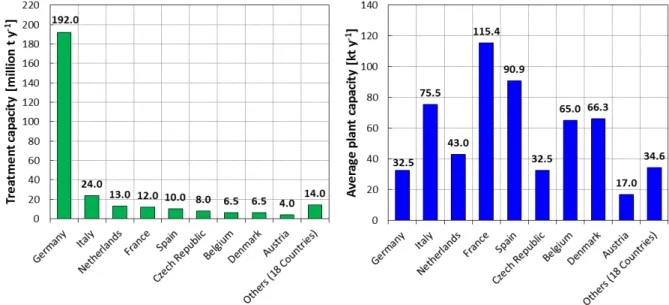
Figure 4. Distributions of the total digestion plants capacity (green) and average plant capacity (blue) in the EU countries.
A more detailed comparison of biogas production (by source and as total) in the different EU countries is shown in Figure 5. It can be seen how Germany and Austria are the countries that have made the most progress towards the biogas production from anaerobic digestion plants fed by selected matrices (respectively 87.1% and 87.4%). Also of interest are the percentages concerning Denmark (74.6%), Czech Republic (71.8%) and the Netherlands (71.4%). This percentage lowers to 54.9% for Belgium, while Italy, despite its considerable progress in recent years, shows only 29.5%, practically on the same level of Spain (33.3%).
Figure 5. Primary Energy production of biogas in the European Union in 2011, by country and source (EurObserv’ER, 2012a, adapted by the Authors).
Rev. Ambient. Águavol. 9 n. 2 Taubaté - Apr / Jun. 2014
In general, the incentives granted to the producers and users of biogas and biomethane, are of this kind:
Renewables Obligation (RO), introduced to support renewable electricity generation by requiring suppliers to increase the generators production, through the purchase of tradable Renewable Obligation Certificates (ROCs);
Feed-in Tariff (FiT), which provides an extra payment for renewable electricity producers, mainly addressed to support small generation plants;
Renewable Heat Incentive (RHI), which provides a guaranteed payment for heat used from biogas combustion and also all the biomethane injected into the grid of natural gas;
Renewable Transport Fuels Obligation (RTFO), which places an obligation on fuel suppliers to source 5% of their transport fuels from renewable sources by 2014. Biomethane is eligible for Renewable Transport Fuel Certificates (RTFC), which can be bought by fuel suppliers to meet the RTFO;
Various incentives and tax breaks introduced in a few countries to promote the use of biomethane in transport.
3.2.2. Energy recovery from biogas
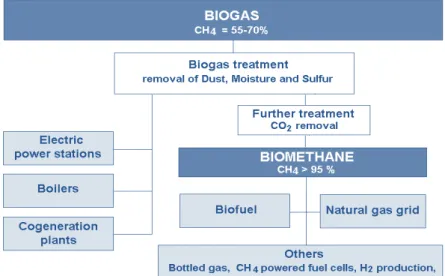
Figure 6 shows the feasible alternatives for the conversion of biogas into energy. For the production of electricity and heat, biogas is used after simple treatments for the removal of dust, moisture, and hydrogen sulfide. For this purpose, boilers (heat), electric power stations (electricity), gas turbines and gas engines for cogeneration (combined heat and power production, CHP) are used. The upgrading of biogas to biomethane is instead used for the production of biofuel for vehicles or to be injected into the natural gas grid for domestic and industrial uses. Figure 6 also shows the options of compressing the gas in bottles (for domestic use or as biofuel for vehicles) and the innovative energy applications, such as the conversion into hydrogen and powered fuel cells.
Figure 6. Options for biogas conversion into energy.
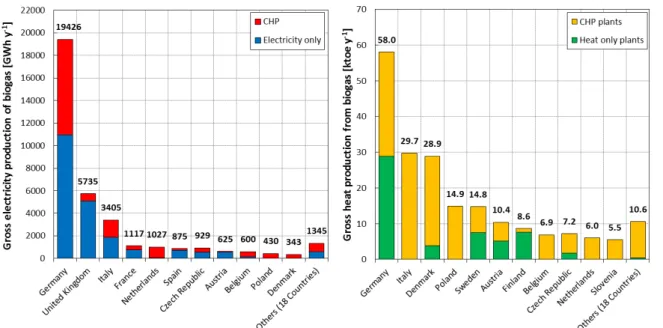
Particularly relevant is the use of cogeneration plants in Germany for which the electricity production amounted to 8,491 GWh y-1 in 2011, with an increase of as much as 525% compared to 2010 (EurObserv’ER, 2012b). Of course, Germany is noted as the largest EU producer of electricity from biogas with an annual production of 19,426.0 GWh y-1 in 2011 and an increase of 21.2% compared to 2010 (EurObserv’ER, 2012b).
Figure 7. Gross electricity and heat generation from biogas in EU countries in 2011 (EurObserv’ER, 2012a, adapted by the Authors).
Figure 7 also shows the production of heat from biogas (sold to the district heating network or to the industry) in 2011, amounting to 201.6 ktoe y-1, with an increase of 16% compared to 2010 (EurObserv’ER, 2012b). Germany has the greatest heat production (58.0 ktoe y-1) but with a less pronounced gap with respect to other EU countries. This last data confirms that at present the main target is the production of electricity. It is noted that some countries, such as Italy, Belgium and the Netherlands, produce heat only through cogeneration plants, unlike Germany, which uses cogeneration plants and heat only plants to the same extent.
Figure 8 shows the trend of growth for the production of electricity and heat from biogas until the year 2020, comparing the NREAP road map and the EU growth trend.
Rev. Ambient. Águavol. 9 n. 2 Taubaté - Apr / Jun. 2014
It is noted that for both electricity and heat, the current trend is slightly higher than that officially planned, providing for the year 2020 an estimate of 65,000 GWh y-1 for electricity and 4,500 ktoe y-1 for heat.
The use of biogas as biofuel in vehicles is still limited, although someEU countries are strongly implementing an effective policy in this direction. Countries that stand out in this respectare Germany, the Netherlands, Austria, Finland and, above all,Sweden.
In Sweden, all new digesters fed by organic matrices are equipped with systems able to upgrade biogas to biomethane which is then injected into the natural gas grid or bottled to be used as fuel in vehicles. In this country, thousands of light-duty vehicles as well as several fleets of vehicles for public transport are currently circulating fed by biomethane mixed with natural gas. In many Swedish cities, the use of methane for transport is favored by different forms of incentives (e.g. free parking, tax breaks for bio-methane purchase, toll exemption, dedicated lanes for biomethane taxies, financial support for the purchase of biomethane fed vehicles), which created an excellent level of acceptance for this kind of biofuel (Jonsson and Person, 2003). In 2010, around 56 million m3 of biomethane were produced and 94% of it was sold to the transport sector. But Sweden plans to have a fossil fuel free vehicle fleet in 2030. This policy makes Sweden the world leader with respect to the introduction of biomethane in transport.
A further option practiced in some cases consists of injecting the biomethane into the natural gas grid. Germany is the most advanced country in this practice. In 2011, a total of 77 plants have injected 275 million m3 of biomethane into the gas grid. Germany plans to inject 6 billion m3 y-1 of biomethane by 2020 and 10 billion m3 y-1 by 2030.
4. CONCLUSIONS
The results of this survey prove that the world production of biogas is a negligible value compared to the global energy needs and small even compared to the same global production of biofuels (mainly bioethanol and biodiesel). However, since 2000, the European Union has implemented several policies in order to promote its production. The same EU Member States have developed over the last decade various forms of incentives to encourage the production
of biogas and its conversion into energy. The EU’s interest in pursuing these goals is
connected with its firm intention to produce renewable energy in order to improve European energy market stability and reduce carbon dioxide emissions that are responsible for climate change. For these reasons, the EU, already the world leader in the field of biodiesel, in the last twenty years has become the world leader in the production of biogas with a share production currently equal to 60% of the world market. This production currently amounts to 10,500 ktoe y-1 and it is expected to reach 28,000 ktoe y-1by the year 2022, in accordance with the National Renewables Energy Plans.
organic matrices. UK, Italy and France follow in the ranking of the EU’s largest producers,
but with a total amount that reaches only 31.8%. It is also necessary to point out that in these three countries biogas production is still heavily dependent on landfill biogas, although they are making encouraging efforts (especially Italy and France) toward the construction of anaerobic digestion plants fed by selected biomasses.
As an alternative to these kinds of reuses, several instances of biogas upgrading to biomethane (fed into natural gas grid or used as fuel) are beginning to occur in many EU countries. The use of biogas in transport is particularly favored in Germany, Netherlands, Finland, Austria, and especially in Sweden, which upgrades about 64.4% of its total production of biogas to biomethane. In this country, thousands of light-duty vehicles as well as several fleets of vehicles for public transport fueled by biomethane (or biomethane mixed with natural gas) are currently circulating. In many Swedish cities, the use of biomethane for transport is favored through different types of incentives (e.g. free parking, tax breaks for bio-methane purchase, toll exemption, dedicated lanes for bio-methane taxies, financial support for the purchase of bio-methane fed vehicles) which created an excellent level of acceptance for this kind of biofuel. Sweden plans to have a fossil fuel free vehicle fleet by 2030. This policy makes Sweden the world leader with respect to the introduction of biomethane in transport. Germany is the mostnotedcountry for injecting biomethane into the natural gas grid. Germany plans to inject 6 billion m3 y-1 of biomethane by 2020 and 10 billion m3 y-1 by 2030.
Finally it is noted that the programs of the EU will lead in the near future to significant increases in the production of biogas through anaerobic digestion plants fed by selected organic matrices. This will result in noticeable energy and environmental benefits. The positive results achieved in the EU are a valuable reference model for the others areas of the world.
5. REFERENCES
BEURSKENS, L. W. M.; HEKKENBERG, M.; VETHMAN, P. Renewable energy
projections as published in the National Renewable Energy Action Plans of the European Member States. Report ECN-E-10-069. EEA-ECN. Copenhagen: European Environmental Agency, 2011. 270 p.
COMMISSION OF THE EUROPEAN COMMUNITIES - EU. Regulation amending
annexes VI and VIII to regulation (EC) No 1774/2002 of the EU Parliament and of the Council as regards processing standards for biogas and composting plants and requirements for manure. EU Commission Regulation 208/2006. Brussels, 2006.
COMMISSION OF THE EUROPEAN COMMUNITIES - EU. An energy policy for
Europe. Report SEC(2007) 12. Brussels, 2007.
COMMISSION OF THE EUROPEAN COMMUNITIES - EU. Biofuels Progress Report. Report on the progress made in the use of biofuels and other renewable fuels in the Member States of the European Union. Report COM(2006) 845 final. Brussels, 2007.
EUROBSERV’ER. Biogas barometer. Le Journal des Énergies Renouvelables, Paris, v.
212, p. 67-79, 2012a.
EUROBSERV’ER. The state of the renewable energies in Europe 2012. 12th edition. Paris:
2012b. 241 p.
EUROPEAN COMMISSION. A European strategy for sustainable, competitive and
Rev. Ambient. Águavol. 9 n. 2 Taubaté - Apr / Jun. 2014
EUROPEAN COMMISSION. Recent progress in developing renewable energy sources
and technical evaluation of the use of biofuels and other renewable fuels in transport in accordance with Article 3 of Directive 2001/77/EEC and Article 4(2) of Directive 2003/30/EC - Accompanying document to the Communication from
the Commission to the European Parliament and the Council “Renewable Energy:
progressing towards the 2020 rarget”. Report SEC(2011) 130 final. Brussels, 2011a.
EUROPEAN COMMISSION. White paper 2011 - Roadmap to a Single European
Transport Area - Towards a competitive and resource efficient transport system. Report COM(2011) 144 final. Brussels, 2011b.
EUROPEAN PARLIAMENT. Council of the European Union. Directive 91/156/EEC of 18
March 1991 amending Directive 75/442/EEC on waste. Brussels, 1991.
EUROPEAN PARLIAMENT. Council of the European Union. Directive 1999/31/EC. Brussels, 1999.
EUROPEAN PARLIAMENT. Council of the European Union. Directive 2001/77/EC of the
European Parliament and of The Council of 27 September 2001 on the promotion of electricity produced from renewable energy sources in the internal electricity market. Brussels, 2001.
EUROPEAN PARLIAMENT. Council of the European Union. Directive 2003/30/EC of the
European Parliament and of the Council of 8 May 2003 on the promotion of the use of biofuels or other renewable fuels for transport. Brussels, 2003.
EUROPEAN PARLIAMENT. Council of the European Union. Directive 2008/98/EC of the
European Parliament and of the Council of 19 November 2008 on waste. Brussels, 2008.
EUROPEAN PARLIAMENT. Council of the European Union. DIRECTIVE 2009/28/EC of
the European Parliament and of the Council of 23 April 2009 on the promotion of the use of energy from renewable sources. Brussels, 2009.
EUROPEAN PARLIAMENT. Resolution on sustainable agricolture and biogas: a need ofr review of the EU legislation. Brussels, 2008.
JONSSON, O.; PERSON, M. Biogas as transportation fuel. In: FACHTAGUNG REGENERATIVE KRAFTSTOFFE, 13-14 November 2003, Stuttgard, Germany.
Proceedings…. [S.l.]: [s.n.], 2003. p.37-43.
PIKE RESEARCH. Renewable biogas. Methane Recovery and Utilization in Landfills and Anaerobic Digesters: Municipal Solid Waste, Agricultural, Industrial, and Wastewater Market Report on Analysis and Forecasts. Boulder, 2012. 87 p.
RABONI, M.; TORRETTA, V.; URBINI, G. The future of biofuels for a sustainable mobility. In: World Sustainability Forum, 3., 1-30 November 2013. Sciforum
Electronic Conference Series, v. 3, 2013. http://dx.doi.org/10.3390/wsf3-f009
REN21. Renewables 2013 - global status report. Paris, 2013. 177 p.