Nonlinear models for fitting growth curves of Nellore cows reared in the
Amazon Biome
Kedma Nayra da Silva Marinho1, Alfredo Ribeiro de Freitas2, Alencariano José da Silva Falcão1, Francisca Elda Ferreira Dias1
1 Escola de Medicina Veterinária e Zootecnia, Universidade Federal do Tocantins, Campus de Araguaína. 2 Universidade Federal de São Carlos - UFSCar, Programa de Pós-Graduação em Genética e Evolução.
ABSTRACT - Growth curves of Nellore cows were estimated by comparing six nonlinear models: Brody, Logistic, two alternatives by Gompertz, Richards and Von Bertalanffy. The models were fitted to weight-age data, from birth to 750 days of age of 29,221 cows, born between 1976 and 2006 in the Brazilian states of Acre, Amapá, Amazonas, Pará, Rondônia, Roraima and Tocantins. The models were fitted by the Gauss-Newton method. The goodness of fit of the models was evaluated by using mean square error, adjusted coefficient of determination, prediction error and mean absolute error. Biological interpretation of parameters was accomplished by plotting estimated weights versus the observed weight means, instantaneous growth rate, absolute maturity rate, relative instantaneous growth rate, inflection point and magnitude of the parameters A (asymptotic weight) and K (maturing rate). The Brody and Von Bertalanffy models fitted the weight-age data but the other models did not. The average weight (A) and growth rate (K) were: 384.6±1.63 kg and 0.0022±0.00002 (Brody) and 313.40±0.70 kg and 0.0045±0.00002 (Von Bertalanffy). The Brody model provides better goodness of fit than the Von Bertalanffy model.
Key Words: beef cattle, maturity rate, modeling
Introduction
Studying beef cattle growth curves is essential because it supplies relevant information to establish strategic plans to obtain subsidies for the areas of nutrition and genetic breeding such as improved management, nutritional requirement determination, knowledge of the genetic variability of the characteristics linked to growth and assessment of the genetic potential of the animals for growth, contributing to the process of decision making to adopt a certain technology.
Growth curve study in cattle has mainly used non-linear models that relate the animal weights and ages (Garnero et al., 2006; Forni et al., 2009; Souza et al., 2010). The advantages of growth curves in animal production include: a) summarizing, in three or four parameters, the most important characteristics of the population, because some parameters of the non-linear models used have biological interpretation; b) assessing the treatment response profile over time; c) identifying the heaviest animals at younger ages in a population by investigating the relationship between growth curve parameter K and the limit weight of the animal or asymptotic weight (A); and d) obtaining the individual within and among variance, that is of great interest in genetic assessments (Freitas, 2005).
Several studies have suggested that the Brody model provides the best fit to describe beef cattle growth curves (Arango & Van Vleck, 2002; Garnero et al., 2005; Forni et al., 2009). However, the literature has also reported studies where other models fit beef cattle data more satisfactorily. Oliveira et al. (2000) selected the Von Bertalanffy model to represent the mean growth curve of Nellore cattle. Souza et al. (2010) reported that the Logistic equation presented the best goodness of fit for the growth curve in the Indubrasil breed.
The objective of the present study was to assess and compare the non-linear models by Brody, Richards, Von Bertalanffy, Logistic and two Gompertz alternatives, for goodness of fit of the weight-age data for Nellore cows.
Material and Methods
We used weight-age data from 29,221 Nellore cows born between 1976 and 2006, from farms located in the Brazilian states of Acre, Amapá, Amazonas, Pará, Rondônia, Roraima and Tocantins, weighed from birth until 750 days of age, supplied by the Brazilian Zebu Breeders Association (ABCZ). The animals were weighed at approximately 3-month intervals, totaling nine weight records per animal.
ISSN 1806-9290
www.sbz.org.br R. Bras. Zootec., v.42, n.9, p.645-650, 2013
Data from commercial beef cattle reared in extensive, semi-intensive and intensive production systems were used (Table 1). The predominant climate on the farms is characterized by two seasons: dry (May to October) and rainy (November to April), with a mean annual rainfall ranging from 1500 to 1700 mm. In the regions with low to medium soil fertility, in general, pasture grasses are
Brachiaria decumbens and Brachiaria humidicola, while
on medium fertility soils the Brachiaria decumbens,
Brachiaria brizantha and Andropogon gayanus grasses
predominate. On soils with medium to high fertility, the
Brachiaria brizantha grasses, belonging to the Panicum
genus, Panicum maximum (colonial and Tanzania), is found more frequently.
The properties associated with the non-linear models used in the present study (Table 2) such as instantaneous growth rate, absolute maturity rate, relative instantaneous growth rate and inflection point are described in Freitas (2005).
In the mathematical expressions, yt represents the weight of the animal at a given age (t); parameter A is the asymptotic weight, if t → ∞; when the adult weight of the animal is not reached, this reflects in an estimate of the weight of the last weighings; b is a constant without biological interpretation, but it is important to model the sigmoidal format of the growth curve from birth (t = 0) until the adult age of the animal (t → ∞); K is the maturity index, which expresses the ratio of the maximum growth rate in relation to the adult size, where lower k values indicate delayed maturities and higher k values indicate accelerated maturity; M is the parameter that shapes the curve; e is the natural base logarithm; the L parameter has no biological meaning, but together with K constitutes b, which has the function of modeling the sigmoidal curve; and ε represents the random error associated with each weighing.
Four properties obtained from the fitted models were analyzed: 1) instantaneous growth rate - IGR (∂yt/∂t): estimates
the increase in weight of the animal for each time unit t; 2) relative instantaneous growth rate - RIGR (y−1(∂y
t/∂t)): estimates
the instantaneous growth rate in relation to the weight of the individual in the particular time t; 3) absolute maturity rate - AMR (A−1∂y
t/∂t): the IGR ratio in relation to the
asymptotic weight (A), which represents the instantaneous growth rate in relation to the global size, which varies on a scale from 0 to 1; and 4) inflection point - IP (∂2y
t/∂t2):
corresponds to the point at which the IGR changes from increasing to decreasing, given by the equation yt/A = 8/27,
yt/A =½, yt/A=1/e, and yt/A=m1/(1−m), for Von Bertalanffy,
Logistic, Gompertz and Richards, respectively.
The non-linear models were fitted to the weight-age data by the NLIN procedure of the statistical package SAS (Statistical Analysis System, version 8.1), and the parameters of the models were estimated by the interactive Gauss-Newton process, adopting the criterion of 10−8
convergence.
To compare the non-linear models for goodness of fit, the statistical criteria and biological interpretation of the parameters were used.
The statistical criteria were: 1) mean square error; 2) adjusted coefficient of determination (R2
aj), where R2aj =
1- (sum of squares error/corrected total sum of squares); 3) prediction error: PE= (y y )
i n
1 i
i
, where n = number ofweight-age data pairs, and the test hypothesis was: Ho: PE = 0
Table 1 - Summary for the weight-age data set, from birth to 750 days of age, of Nellore cows, born from 1976 to 2006 reared on farms in the northern region of Brazil
Weighing class Number of animals Mean (kg) Standard deviation (kg) Coefficient of variation (%) Skewness Kurtosis
1 37,611 29.64 2.59 8.76 2.13 9.28
2 28,990 87.93 23.15 26.32 0.10 −0.80
3 21,110 133.52 27.64 20.70 0.24 −0.25
4 17,714 180.02 30.95 17.19 0.73 0.51
5 14,376 206.91 38.41 18.56 0.73 0.51
6 11,928 234.79 47.00 20.02 0.89 0.78
7 9,070 268.72 54.13 20.07 0.86 0.49
8 7,368 294.82 50.54 17.16 0.89 1.56
9 710 327.93 29.63 9.03 −0.46 0.25
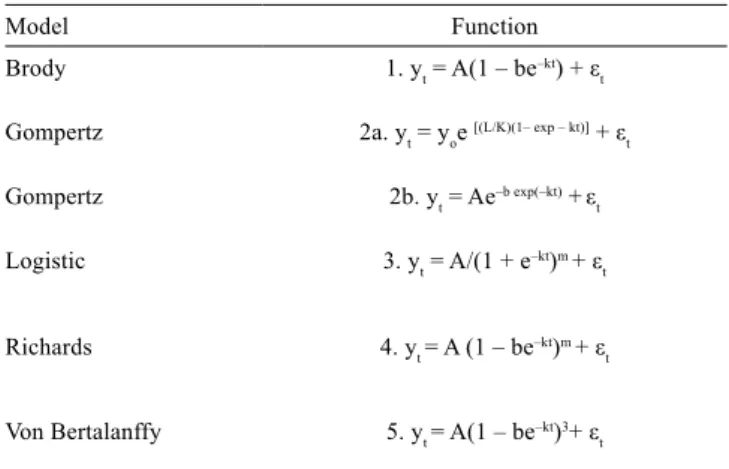
Table 2 - Nonlinear functions used for modeling the growth curves
Model Function
Brody 1. yt = A(1 – be–kt) + εt
Gompertz 2a. yt = yoe [(L/K)(1– exp – kt)] + εt
Gompertz 2b. yt = Ae–b exp(–kt) +εt
Logistic 3. yt = A/(1 + e–kt)m + εt
Richards 4. yt = A (1 – be–kt)m + εt
versus Ha: PE ≠ 0. using the paired t-Test, where the t values were obtained as (Tcalc): Tcalc =
PE S
n
PE , where PE
is the average of the PE, n is the number of weight-age pairs and SEPis the standard deviation of PE; and 4) mean absolute error – MAE, where MAE= y yi /n
n
1 i
i
; andn = n number of weight-age pairs.
The following were assessed for the biological interpretation of the parameters: 1) graph of estimated weights versus weight means; 2) instantaneous growth rate; 3) absolute maturity rate; 4) relative instantaneous growth rate; and 5) inflection point.
Results and Discussion
The Brody and Von Bertalanffy models fitted the weight-age data, but the other models did not converge. From the animal production point of view, the asymptotic weight (A) and the maturity index (K) are considered the two most important parameters mainly because heavier cows generally have calves that grow more rapidly, which is desirable in beef cattle production (Paz et al., 2004). However, increased costs to maintain larger-sized cows may not compensate the economic advantages of faster calf growth (Cartwright, 1970).
The asymptotic weight estimates, using the Brody and Von Bertalanffy models (Table 3) were lower as compared with other studies carried out with Nellore cows for both models (Garnero et al., 2005; Santoro et al., 2005; Forni et al., 2009). This result may be explained by the fact that in the present study we used weight data of animals that were younger at the last weighing.
The data set used in the present study contained weighings from birth to 750 days of age; therefore, the
adult weight could not be estimated because these animals did not reach maturity. Thus, the (A) estimate reflects the mean of the weight at the last weightings. According to Ludwig et al. (1981), the weighings of the animals from birth to adult age should be assessed to obtain more precise estimates of the non-linear model parameters.
Within the period studied, that is, weighings from birth until 750 days of age, the Brody model resulted in an asymptotic weight estimate (A) which showed better fit to the average 750-day-old Zebu cattle compared with reports in the literature (Rosa et al., 2001; Santoro et al., 2005; Malhado et al., 2009).
The maturity rate (K) estimates and the integration constant (b) (Table 3) did not vary greatly, compared with other studies with Nellore cattle. Silva et al. (2001) estimated K and B values of 0.0020±0.0003 and 0.9205±0.0116 for the Brody model and 0.0043±0.0007 and 0.5193±0.0262 for the Von Bertalanffy model. Silva et al. (2004) reported values of 0.002±0.00004 and 0.91±0.0012; and 0.018±0.01516 and 0.51± 0.0023 for the Brody and Von Bertalanffy models, respectively. Santoro et al. (2005) obtained 0.0039±0.0016 and 0.5378±0.0539 for the Von Bertalanffy model.
Using the estimates of the parameters of the non-linear models, animals can be selected from the maturity rate, because those with higher maturity rates are earlier than those presenting lower maturity rates. From the animal breeding standpoint, this parameter is very important because animals with greater growth can be selected (Brown et al., 1972; Fitzhugh Jr., 1976).
For the two models selected, the coefficients of determination were greater than 88.0%, showing that the animal growth, from birth to 750 days of age, was estimated correctly (Table 4). This result was also obtained by the Brody model, which did not reject the null hypothesis of the prediction error according to the Student t test. This indicated that the least square method assumption of error mean equal to zero was not rejected.
When MAE values were used to compare the models, although small deviations were observed in both models, the errors were slightly smaller for the Brody function, indicating greater association between the observed and estimated weights; therefore, this model had better goodness
Table 3 - Estimates and standard errors of the growth curve parameters: asymptotic weight (A) in kg, integration constant (b) and maturity rate (K) in (days)−1 for the
Brody and Von Bertalanffy non-linear models, for Nellore cows
Model Parameter
A (kg) b K (kg/kg/day)
Brody 384.60±1.63 0.9192±0.00050 0.0022±0.00002 Von Bertalanffy 313.41±0.70 0.5153±0.00076 0.0045±0.00002
Table 4 - Mean square error (MSE), adjusted coefficient of determination (R2adj), mean absolute error (MAE) and prediction error (PE) obtained from the Brody and Von Bertalanffy non-linear models, fitted to Nellore cow weight data
Model MSE R2adj MAE PE
Brody 907.0 89.16 19.3085 4,1x10⁻⁵, t
cal= 5.0x10⁻⁹ (P>0.05)
of fit compared with the Von Bertalanffy model. Similarly, the MSE was smaller for the Brody model.
Regarding the Nellore cow growth curve, considering the means of the observed weights and the values estimated by the Brody and Von Bertalanffy models, using the parameters described in Table 3 (Figure 1), it was observed that from birth to 360 days of age, both models had goodness of fit of the data; from 340 to 470 days of age, the models overestimated the weights observed; while in the final part of the curve, that is, starting at 670 days of age, both models underestimated the observed weights. Although in the Brody model the asymptotic weight was greater than that obtained in the Von Bertalanffy model, the estimated weights in the final part of the curve did not overestimate the observed weights. The Von Bertalanffy function may have underestimated the asymptotic weight because it is not the most suitable for describing the initial growth. Thus the maturity rate estimation process and consequently the adult weight were impaired.
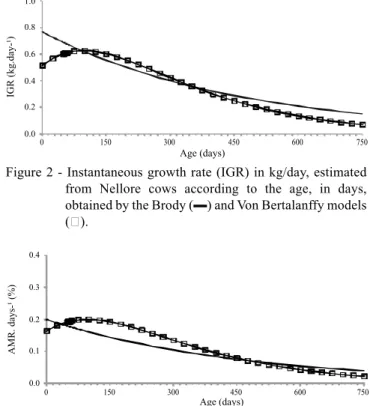
As the Brody model has no inflection point, the instantaneous growth rate (IGR) always decreases, starting with gain around 0.77 kg/day, but at 750 days of age, the gain is approximately 0.30 kg/day (Figure 2). In the Von Bertalanffy model, the IGR increased until it reached a maximum of around 0.66 kg/day and then decreased with
age, and at 750 days the gain was 0.10 kg/day. The point at which the function changed from increase to decrease, that is, the curve inflection point (yi; ti), was not reached at 97
days of age with a weight of 93.0 kg (yi = 8A/27 = 92.8593;
ti= loge(3b)/K = 96.8014).
The weighings were interrupted before maturity was reached, thus the ability of these models to describe growth curves at later periods is not known. It was observed that the animals were still developing at 750 days of age, although at a lower instantaneous growth rate. This explains why the means of 384.6±1.63 kg and 313.4±0.70 kg obtained for asymptotic weight (A) for the models analyzed, Brody and Von Bertalanffy, respectively, were lower than the values normally reported for the adult weight of Nellore animals (Garnero et al., 2005; Santoro et al., 2005; Forni et al., 2009). The relative instantaneous growth rate (RIGR) was high up to 50 days of age, in both growth functions, but there was a significant reduction starting at this stage until the last weighings (Figure 3). For the Brody model, the RIGR represented 2.46% at birth, 1.02% at 50 days, 0.50% at 125 days and there was significant reduction from then onwards. At 475 days it was around 0.10% and at 750 days it was 0.05%, that is, at this age about 21 days are needed to reach 1% of the animal weight. For the Von Bertalanffy model, the RIGR behaved differently, representing1.44% at
Figure 1 - Estimates of growth, in kg, of Nellore cows according to the age, in days, obtained by the models Brody (- - -), Von Bertalanffy (– –) and observed mean weight (▬).
0 50 100 150 200 250 300 350 400
0 150 300 450 600 750
Age (days)
W
eight
(kg)
0.0 0.2 0.4 0.6 0.8 1.0
0 150 300 450 600 750
Age (days)
IGR
(kg.day-¹)
Figure 2 - Instantaneous growth rate (IGR) in kg/day, estimated from Nellore cows according to the age, in days, obtained by the Brody (▬) and Von Bertalanffy models ().
0.0 0.5 1.0 1.5 2.0 2.5 3.0
0 150 300 450 600 750
Age (days)
RIGR.days-¹
(%
)
Figure 3 - Relative instantaneous growth rate (RIGR), in %, according to the age, in days, obtained by the Brody (▬) and Von Bertalanffy () models.
0.0 0.1 0.2 0.3 0.4
0 150 300 450 600 750
Age (days)
AMR.
days-¹
(%)
birth, 0.94% at 50 days, 0.56% at 125 days, 0.09% at 475 days and approximately 0.02% at 750 days; at the latter age, about 41 days are needed to reach 1% of the animal weight.
With respect to the absolute maturity rate (AMR), the (A) parameter represented a weight estimate at around 750 days of age, because animal maturity was not reached (Figure 4). For the Von Bertalanffy model, the absolute maturity rate was at around 0.16% at birth and reached a maximum of 0.20% at 100 days of age. For the Brody model, the AMR value was at around 0.20% at birth and 0.16% at 100 days of age. The AMR was 0.08% at 450 days of age for both the models, but at 750 days, in the Brody model, AMR was 0.04% and that of the Von Bertalanffy model was at around 0.02%.
Statistical criteria (Table 4) suggest that the Brody model provided better goodness of fit than the Von Bertalanffy model, that is, lower MSE (907.0 versus 945.4), greater adjusted coefficient of determination (89.16% versus 88.70%) and lower MAE (19.31 versus 20.71). The prediction error observed in the Brody model did not differ significantly from zero (P>0.05), unlike the Von Bertalanffy function (P<0.05).
However, as the criteria above did not provide biological information from the parameter estimates, the importance of analyzing the biological criteria is emphasized. The graph of estimated versus mean weights presents relevant biological information, because the Brody model gave higher estimates for the asymptotic weight than the Von Bertalanffy model, which was closer to the observed weights (Figure 1). Great difference was observed in the instantaneous growth rate analysis (Figure 2) between the models at every interval studied. The absence of inflection point in the Brody model contributed even more to the difference between the models and also in the relative instantaneous growth rate analysis (Figure 3). For the Brody model, the RIGR represented 2.46% at birth and at 475 days it was at around 0.10% and at 750 days it was 0.05%. For the Von Bertalanffy model, the RIGR represented 1.40% at birth, 0.9% at 475 days and approximately 0.024% at 750 days. Finally, large differences were observed between the two models for the absolute maturity rate (Figure 4), similarly to the discussion on IGR and RIGR.
Thus, analysis of the biological criteria in addition to the statistical criteria to compare different nonlinear functions to describe growth curves gives more precise results and conclusions. Both the non-linear models analyzed can be used to describe the growth curve of Nellore cows, from birth to 750 days of age. However, the Brody model provided a better goodness of fit.
Conclusions
Among the six non-linear models studied - Brody, Gompertz, Logistic, Richards and Von Bertalanffy -, only the Brody and Von Bertalanffy models are suitable to describe Nellore cow growth from birth to 750 days of age. However, the Brody model is better able to fit to the weights than Von Bertalanffy.
Acknowledgments
The authors would like to thank the Brazilian Association of Zebu Breeders for making the data available.
References
ARANGO, J.A.; VAN VLECK, L.D. Size of beef cows: early ideas, new developments. Genetics Molecular Research,v.1, p.51-63, 2002.
BROWN, J.E.; BROWN, C.J.; BUTTS, W.T. A discussion of the genetic aspects of weight, mature weight and rate of maturing in Hereford and Angus cattle. Journal of Animal Science, v.34, p.525-532, 1972.
CARTWRIGHT, T.C. Selection criteria for beef cattle for the future.
Journal of Animal Science, v.30, p.706-711, 1970.
FITZHUGH JR., H.A. Analysis of growth curves and strategies for altering their shape. Journal of Animal Science, v.42, p.1036-1051, 1976.
FORNI, S.; PILES, M.; BLASCO, A. et al. Comparison of different nonlinear functions to describe Nelore cattle growth. Journal of Animal Science, v.87, p.496-506, 2009.
FREITAS, A.R. Curvas de crescimento na produção animal. Revista Brasileira de Zootecnia, v.34, p.786-795, 2005.
GARNERO, A. Del V.; MARCONDES, C.R.; BEZERRA, L.A.F. et al. Parâmetros genéticos da taxa de maturação e do peso assintótico de fêmeas da raça Nelore. Arquivo Brasileiro de Medicina Veterinária e Zootecnia, v.57, p.652-662, 2005.
GARNERO, A. Del V.; MARCONDES, C.R.; GUNSKI, R.J. et al. Genetic trends in the expected progeny difference of the asymptotic weight of Nelore females. Genetics and Molecular Biology, v.29, p.648-652, 2006.
LUDWIG, A.; SILVA, M.A.; OLIVEIRA, L.M. Ajustamento de modelos estatísticos exponenciais ao crescimento de gado Nelore.
PesquisaAgropecuária Brasileira, v.16, p.297-302, 1981. MALHADO, C.H.; CARNEIRO, P.L.S.; MARTINS FILHO, R. et al.
Parâmetros e tendência genética da taxa de maturação e peso assintótico de bovinos da raça Nelore no estado da Bahia. Revista Brasileira de Saúde e Produção Animal, v.10, p.245-255, 2009. OLIVEIRA, H.N.; LÔBO, R.B; PEREIRA, C.S. Comparação de
modelos não-lineares para descrever o crescimento de fêmeas da raça Guzerá. Pesquisa Agropecuária Brasileira, v.35, p.1843-1851, 2000.
PAZ, C.C.P.; PACKER, I.U.; FREITAS, A.R. et al. Ajuste de modelos não-lineares em estudos de associação entre polimorfismos genéticos e crescimento em bovinos de corte. Revista Brasileira de Zootecnia, v.33, p.1416-1425, 2004.
ROSA, A.N.; LÔBO, R.B.; OLIVEIRA, H.N. et al. Peso adulto de matrizes em rebanhos de seleção da raça Nelore no Brasil. Revista Brasileira de Zootecnia, v.30, p.1027-1036, 2001.
SILVA, F.F.; AQUINO, L.H; OLIVEIRA, J.A. Influência de fatores genéticos e ambientais sobre as estimativas dos parâmetros das funções de crescimento em gado Nelore. Ciência e Agrotecnologia, v.25, p.1195-1205, 2001.
SILVA, N.A.M.; AQUINO, L.H; SILVA, F.F. et al. Curvas de crescimento e influência de fatores não genéticos sobre as taxas
de crescimento de bovinos da raça Nelore. Revista Ciência Agrotecnologia, v.28, p.647-654, 2004.