v.14, n.2, p.165–172, 2010
Campina Grande, PB, UAEA/UFCG – http://www.agriambi.com.br Protocolo 045.07 – 09/04/2007 • Aprovado em 24/07/2009
Spatial-temporal analysis of water requirements of coffee crop
in Minas Gerais State, Brazil
Luis C. de A. Lemos Filho1, Carlos R. de Mello1, Manoel A. de Faria1 & Luiz G. de Carvalho1
ABSTRACT
Scientific investigations about crop water requirements are of fundamental importance to the irrigation process. The main objective of this paper is to analyze and to map water requirements of coffee crop in Minas Gerais State, Brazil. Poten-tial evapotranspiration values (ET0) were estimated by the Penman-Monteith-FAO method, using daily data sets available for 42 National Meteorology Institute (INMET) stations for a period of 17 years. The crop coefficient values (kc) consid-ered were extracted from literature. The results were analyzed by means of geostatistical tools. The theoretical semi-variograms were fitted by the Maximum Likelihood method, considering spherical, exponential and Gaussian models. The maps were created using the ordinary kriging method. In a general way, the results have showed that the coffee crop evapotranspiration (ETc) presents high variability in Minas Gerais State. The largest variations, both spatial and tem-poral, have been observed in the northern part of the State. January and June, respectively, presented the highest and the smallest water requirements of coffee crop. Based on this, we can conclude that due to the coffee crop evapotrans-piration (ETc) data distinction in different regions of Minas Gerais, a good estimate of the ETc values for each locality will bring many benefits to the coffee growers regarding irrigation scheduling.
Key words: kriging, evapotranspiration, irrigation, geostatistic
Análise espaço-temporal da demanda hídrica do cafeeiro,
no Estado de Minas Gerais
RESUMO
O conhecimento de informações que expressam a demanda hídrica das plantas, é fundamental para a irrigação. O objetivo principal desta pesquisa foi analisar a demanda hídrica para o cafeeiro em Minas Gerais. Os valores de ET0, estimados pelo método de Penman-Monteith-FAO a partir de dados diários originados de registros de 42 estações climatológicas do INMET, se referem a um período de 17 anos. Os valores de coeficiente de cultura (kc) adotado no estudo, são os citados por Allen et al. (1998) e Doorenbos & Pruitt (1997). As análises dos resultados são feitas através da geoestatística e os semivariogramas teóricos ajustados pela Máxima Verossimilhança nos modelos esférico, exponencial e gaussiano. Fez-se a interpolação dos mapas pelo processo de krigagem. No geral, os resultados mostraram que a evapotranspiração da cultura no cafeeiro é bastante variável em Minas Gerais. As maiores variações, tanto espaciais quanto temporais, são registradas no norte do estado. Os meses que apresentaram as maiores e menores demandas hídricas no Estado, foram janeiro e junho, respectivamente. Conclui-se, em função da nítida distinção dos dados de ETc geoespacializados em Minas Gerais, que o conhecimento do valor correto da ETc em cada localidade, trará benefícios aos produtores no manejo da irrigação.
Palavras-chave: krigagem, evapotranspiração, irrigação, geoestatística
1UFLA Engineering Department, C.P. 3037, CEP 37200-000, Lavras, MG. telephone: (35) 3829-1362. E-mail: [email protected]; [email protected];
I
NTRODUCTIONBrazil is the largest coffee exporter in the world. Coffee is one of the most important Brazilian exporting commodi-ties (Agrianual, 2002) and coffee business has been playing a vital role in the country’s Gross Domestic Product (GDP), exerting a remarkable social influence through the genera-tion of wealth and socio-economic development.
The coffee production in several regions of Brazil has made use of sophisticated irrigation methods, including in regions where the climate is considered appropriate for grow-ing coffee plants without water supply through irrigation. Based on preliminary data, the irrigated coffee plantation area covers 200,000 ha which represents 10% of the whole area used for coffee growing and 8.7% of the total irrigated area in Brazil (Mantovani, 2000).
Because of the scarcity of water resources in some areas, the use of irrigation has been as cost-effective as possible. Con-sequently, the water consumption by plants, relative to the water volume or amount of irrigation to be applied comprises a fundamental issue. In this context, climatic parameters, such as the reference evapotranspiration (ET0) and crop coefficients (kc), have been utilized, but information concerning coffee plant, as found in the literature, is indeed scarce. Allen et al. (1998) suggested a kc between 0.90 and 1.10, with reference evapotranspiration calculated by the Penman-Monteith method as recommended by the FAO.
Geostatistics is a powerful tool in spatial variability analy-sis for climate data. The semi-variogram is the core of geostatistic and shows the spatial dependence degree of a continuous variable. Existing spatial dependence, the vari-able can be estimated for locations without sampling. This estimate is processed based on reduction of random unbiased errors besides minimum variance by interpolation method known as kriging (Vieira, 2000).
The geostatistic method allows identifying the spatial continuity of a variable within study area, demonstrating further the spatial variation of the phenomenon by means of maps of variability. One of the most important applications of geostatistic is associated to the preparation of thematic maps which may be used to analyze the variable distribu-tion. Maps are being increasingly used in agriculture for de-fining agro-climatic zones that point out both the time and the region most favorable for variety of crops. Assad et al. (2003) state that kriging is a tool most appropriate for cre-ating agro-climatic maps.
The present work aims at studying the variability of wa-ter requirement for coffee crop (Coffea arabica L.) in Minas Gerais State through the year, using a geostatistic approach, in order to collect information that will permit us to delimit zones of higher and lower water requirement, contributing for decision making related to the irrigation management.
M
ATERIALANDMETHODSThis study was carried out in the State of Minas Gerais. The State is located between the parallels 14° 13’ 57” S and
22° 55’ 22” S of latitude, and the meridian 39° 51’ 23” W and 51° 02’ 45” W of longitude. According to Köppen’s clas-sification, the State of Minas Gerais presents the following climatic types: Aw, BSw, Cwa e Cwb, i.e. regional climates ranging from semiarid to temperate, with dry winter and rainy summer.
The data base used came from records obtained from the most important climatologic stations of Brazil (ICS), belong-ing to the national network of surface meteorological obser-vations of the National Institute of Meteorology (INMET). These include daily measurements over a period of 17 years (from 1961 to 1978). The selected stations were those that presented minimum long term series of 5 years for all me-teorological elements used to estimate evapotranspiration. As to the some historical series revealed missing values, a simple linear regression method was used. Forty-two climatologic stations were considered in the present work, being 30 in the State of Minas Gerais. The remaining stations are scattered in neighboring regions, including the Federal District area and the States of Goias, Mato Grosso do Sul, São Paulo, Rio de Janeiro, Espírito Santo and Bahia (Figure 1).
The reference evapotranspiration (ET0) were estimated on the basis of daily data of maximum, minimum and mean air temperatures, atmospheric pressure, solar radiation, air rela-tive humidity and wind velocity and the standard Penman-Monteith-FAO method, described by Allen et al. (1997).
In the present study, a mean value for the crop coefficient (kc) of the coffee plants all over the Minas Gerais State was adopted from Allen et al. (1998) and Doorembos & Pruitt (1997) publications. As from the values of kc and those of the ET0, the evapotranspiration for each climate season of the year (the sum of daily values) was calculated in agreement with the methodology proposed by Allen et al. (1998).
The data from each location were geo-referenced fol-lowing Albers’ coordinates, because this system can be ap-plied to the whole State with a minimum area deforma-tion. A vector contour map of the State of Minas Gerais, used initially, was obtained from the Geominas’ web site
Climatologic station of INMET
(www.geominas.mg.gov.br). These were created at a scale of 1:1,500,000 by the PRODEMG – The Minas Gerais State Data Processing Company. The reference system was based on Albers coordinates and South American Datum 1969 (SAD-69).
Monthly and annual maps of ETc were developed for the coffee crop in the State of Minas Gerais, supporting the charac-terization of different zones in terms of water requirement. For that, geostatistic analysis was carried out, using R Program, with GeoR package (Ribeiro Jr. & Diggle, 2001). Firstly, an exploratory analysis was made, followed by the construction of an experimental semi-variogram. Subsequently, all parameters were taken so that the interpolation of the results could be done by ordinary kriging method. The correlations between the nug-get effect (Co) and sill (C) for all models fitted were calculated. This relation, according to Cambardella et al. (1994), measures the spatial dependence degree of the variable.
R
ESULTSANDDISCUSSIONFigures 2 and 3 show the exploratory analyses of mean annual coffee crop evapotranspiration (ETc) in the State of Minas Gerais. Specifically, Figure 2 reveals some data dis-persion around the mean value and its frequency distribu-tion. The variable behavior presents connection with data concentration (either symmetrical or asymmetrical). The box-plot graph revealed the presence of only one outlier which can affect the behavior of the semi-variogram, mainly in its initial phase (Diggle & Ribeiro Jr., 2000). That outlier needs to be removed so that geostatistical analyses can be carried out. The monthly data showed a dispersion and distribution similar to the annual data (as shown in Figure 2).
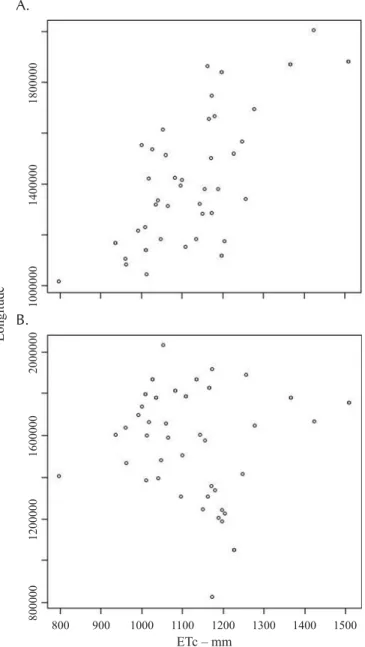
The graphs in Figure 3 demonstrate the behavior of the mean annual ETc in relation to the geographical directions N-S (A) and W-E (B). We can verify that there is no bias in values of ETc in both directions, i.e., the values neither in-crease nor dein-crease in N-S and W-E directions. This aspect is very important regarding geostatistical application, point-ing towards the application of the intrinsic hypothesis for the variable. Starks & Fang (1982) demonstrated that the exist-ence of bias affect the semi-variogram significantly, promot-ing over evaluation of the spatial dependence degree. For monthly periods the data behavior was similar to those shown in Figure 3.
The basic ETc statistics can be seen in Table 1. This table shows the results of the arithmetic mean (µ), standard de-viation (δ), coefficient of variation (CV), maximum and mini-mum values (Emáx and Emín) and the Shapiro-Wilk test of normality (p-value) for the mean monthly and annual coffee crop ETc values for the State of Minas Gerais. We can con-clude that the data present acceptable C.V., especially when referring to climatic data with small amplitude. On the ba-sis of normality test, we can observe that the data present normality. This characteristic can help to fit the semi-variogram models considering the Maximum Likelihood (ML) fitting method, due to its algorithm presupposes multi-varied normality (Ribeiro Jr. & Diggle, 2001).
800 900 1000 1100 1200 1300 1400 1500
0 5 10 15
800 1000 1200 1400 1600
Classes de ETc
Frequency
ET
c
–
mm
year
-1
A.
B.
Figure 2. Box-plot (A) and histogram (B) for annual mean coffee crop ETc (mm) in the State of Minas Gerais
d o i r e
P µµµµµ ) m m
( δδδδδ CV
Emáx ) m m (
Emín ) m m
( p-value
y r a u n a
J 118.26 11.04 9.34 152.79 96.45 0.0204 y
r a u r b e
F 104.88 9.49 9.05 127.15 73.07 0.1305 h
c r a
M 106.96 11.37 10.63 135.52 75.10 0.1593 li
r p
A 85.62 10.24 11.96 114.48 61.87 0.2889 y
a
M 71.52 11.75 16.43 102.77 46.26 0.3717 e
n u
J 61.83 12.93 20.93 97.38 37.63 0.0367 y
l u
J 69.25 15.92 21.92 108.54 42.96 0.0314 t
s u g u
A 90.30 18.76 20.77 143.11 55.58 0.0606 r
e b m e t p e
S 98.60 18.54 18.81 152.55 66.49 0.0212 r
e b o t c
O 105.21 14.12 13.43 140.84 77.90 0.3280 r
e b m e v o
N 102.98 9.89 9.6 125.78 80.30 0.1517 r
e b m e c e
D 107.91 8.59 7.96 133.10 84.63 0.5625 l
a u n n
A 1123.32 132.82 11.82 1510.33 798.25 0.1862
Table 2 shows the values of the nugget effect (Co), sill (C), range (A) and spatial dependence degree (GD) of the mod-els tested (exponential, spherical and Gaussian) for mean monthly and annual coffee crop ETc values for the State of Minas Gerais. By using the spatial dependence degree scale, established by Cambardella et al. (1994), it was observed that, for great part of semi-variograms fitted, the mean values of ETc revealed high spatial dependence degree, presenting GD smaller than 25%. By determining spatial dependence de-gree, we have seen that in all situations studied, the expo-nential model has presented the highest spatial dependence degree, followed by the spherical, except for January, which presented the Gaussian model with stronger GD when com-pared to the spherical model.
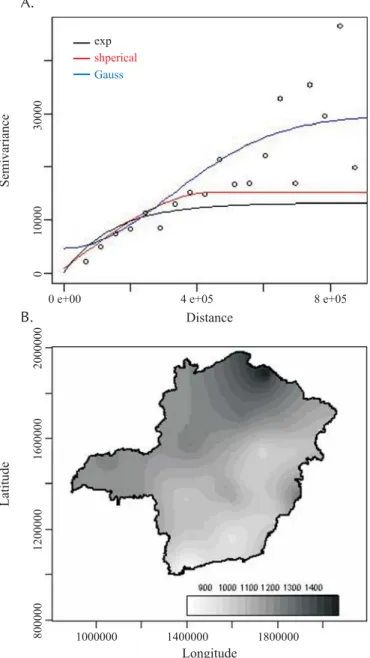
Figure 4A shows the experimental and theoretical semi-variograms of the mean annual ETc of coffee crop for Minas Gerais State. These semi-variograms, whose parameters are presented in Table 2, demonstrate that there is a
consider-able variation of ranges, producing results from 150 to 450 km. The nugget effect values varied from 1.05 and 13.67% of the sill values, demonstrating strong spatial de-pendence degree. These results characterize the semi-variogram exponential model with greater spatial depen-dence, being followed closely by the spherical and the Gaussian models. The semi-variograms’ parameters (Table 2) showed that the ranges present high variability for mean monthly ETc, with values varying from 150 to 600 km. The GD values correspond to a value ranging from 0 to 30.42%, meaning strong spatial dependence degree to great part of situations.
The map in Figure 4B illustrates the spatial distribution
800000 1200000 1600000 2000000 1000000 1400000 1800000
800 900 1000 1100 1200 1300 1400 1500 ETc – mm
Longitude
A.
B.
Figure 3. Distribution of mean annual ETc data in function of latitude and longitude d o i r e
P Model Co C A(km)
= D G x ) C + o C / o C ( ) % ( 0 0 1 o ri e n a J l a it n e n o p x
E 43.65 116.59 150 27.24 l a c i r e h p
S 52.17 119.54 450 30.42 n a i s s u a
G 72.71 176.93 450 29.13
y r a u r b e F l a it n e n o p x
E 11.72 98.03 150 10.68 l a c i r e h p
S 26.70 104.49 450 20.35 n a i s s u a
G 53.40 144.21 450 27.02
h c r a M l a it n e n o p x
E 4.35 116.91 175 3.59 l a c i r e h p
S 11.47 140.99 525 7.52 n a i s s u a
G 41.13 313.54 525 11.60
li r p A l a it n e n o p x
E 21.32 89.79 150 19.19 l a c i r e h p
S 27.36 96.12 450 22.16 n a i s s u a
G 43.06 138.00 450 23.78
y a M l a it n e n o p x
E 2.98 90.57 200 3.18 l a c i r e h p
S 6.40 109.30 600 5.53 n a i s s u a
G 29.03 307.43 600 8.63
e n u J l a it n e n o p x
E 0.00 103.26 200 0.00 l a c i r e h p
S 2.83 129.93 600 2.13 n a i s s u a
G 32.74 436.22 600 6.98
y l u J l a it n e n o p x
E 0.00 133.99 150 0.00 l a c i r e h p
S 1.29 155.49 450 0.82 n a i s s u a
G 34.98 355.55 450 8.96
t s u g u A l a it n e n o p x
E 0.00 232.20 200 0.00 l a c i r e h p
S 2.01 318.61 600 0.63 n a i s s u a
G 84.29 795.55 600 9.58
r e b m e t p e S l a it n e n o p x
E 0.00 248.30 200 0.00 l a c i r e h p
S 6.86 325.76 600 2.06 n a i s s u a
G 90.10 778.90 600 10.37
r e b o t c O l a it n e n o p x
E 0.00 140.70 200 0.00 l a c i r e h p
S 0.00 185.40 600 0.00 n a i s s u a
G 43.02 719.65 600 5.64
r e b m e v o N l a it n e n o p x
E 1.52 114.92 200 1.30 l a c i r e h p
S 10.28 143.16 600 6.70 n a i s s u a
G 47.30 326.20 600 12.66
r e b m e c e D l a it n e n o p x
E 10.38 76.89 150 11.89 l a c i r e h p
S 22.50 81.59 450 21.62 n a i s s u a
G 44.51 109.92 450 28.82
l a u n n A l a it n e n o p x
E 140.20 13208.60 150 1.05 l a c i r e h p
S 858.00 15220.00 450 5.34 n a i s s u a
G 4693.00 29649.00 450 13.67
of the mean annual ETc of the coffee crop in Minas Gerais State. The water requirement is greater in the northern re-gion whose maximum demand was 1,510.33 mm year-1. On the other hand, it is possible to observe that the smallest mean annual ETc values occurred in the southern and southeast regions of the Minas Gerais State. In the south-ernmost region of the state, the demand reached only 52.85% (798.25 mm year-1) of the highest demand esti-mated. It was also noticed that the ETc mean value in-creases considerably from the southern to the northwestern and northern regions. The greatest spatial variations of the annual mean ETc values have been noticed to occur in the northern and northeastern regions (Jequitinhonha), whereas the regions of the Triangulo Mineiro and the northeastern were the ones that presented smallest ETc spatial variability.
Figures 5 (A, B, C, D, E, and F) and 6 (A, B, C, D, E, and F) show the kriging maps which illustrate the spatial distributions of ETc values for coffee crop in Minas Gerais State. The ETc distribution presented similar variations through the year. The maps show decrease from January to June and increase from June to December. The lowest ETc values occurred from April to August, with minimum in the month of June. This indicates that during this period the cof-fee crop water requirement is smaller in comparison to the rest of the year, which required better irrigation strategies. The maps have also confirmed this. Nevertheless, a few ex-ceptions occurred: the highest ETc values were obtained in January, period in which the water requirement appears to be the highest.
It has also been possible to identify the greatest spatial distribution variations occurred generally in the northern region, presenting the same behavior observed in the mean annual ETc values (Figure 4B). This demonstrates that the northern region presents greater spatial variability. However, smaller variations were verified in the Triangulo Mineiro region. It was noticed that all along the year there was an increase in the ETc values. This behavior can be explained as follows: the smaller the latitude of an area the greater is the solar radiation incidence. Because solar radiation is the climatic element which influences most the Penman-Monteith reference evapotranspiration (ET0) (Amatya et al., 1992), the latitude has a direct impact on the ETc values.
In January (Fig. 5A), we have found values varying from 96.45 to 152.79 mm. For February (Fig. 5B), the following val-ues were found: 73.07 and 127.15 mm; whereas for March (Fig. 5C), the values varied from 75.10 and 135.52 mm. In April (Fig. 5D), in which the ETc tends to reduce, the values range from 61.87 to 114.48 mm. however, it should be taken into account the fact that in April, the Triangulo Mineiro re-gion and the western part of the state exhibit a less spatial distribution of ETc, with values varying from 85 to 100 mm. In May (Fig. 5E), however, the values found varied from 46.26 to 102.77 mm; whereas in June (Fig. 5F), smaller ETc values were found, varying from 37.63 to 97.38 mm. Follow-ing a general pattern, the ETc spatial behavior in month of June was found to be similar to that of May (Fig. 5E), situa-tion in which was verified a decrease in the ETc values. For July (Fig. 6A), the estimated ETc values went up again in re-lation to June which was the month that exhibited the small-est values, remaining within the range of 42.96 to 108.54 mm. The ETc spatial behavior in July was similar to that of June (Fig. 5F): it is possible to verify an increase in the water re-quirement. As for August (Fig. 6B), the ETc values ranged from 55.58 to 143.11 mm. For September (Fig. 6C), the esti-mated values increased relative to the previous month, vary-ing from 66.49 to 152.55 mm. For October (Fig. 6D), the ETc remained within the range of 77.90 to 140.84 mm.
The November ETc map (Figure 6E) shows values vary-ing from 80.30 to 125.78 mm. November, however, was the month that presented the most variations of the ETc spatial distribution in regions (Triangulo Mineiro and western part of Minas Gerais) where smaller variations were verified for the remaining months of the year. For December (Fig. 6F),
800000
1200000
1600000
2000000
0
10000
30000
0 e+00 4 e+05 8 e+05
1000000 1400000 1800000
Longitude Distance
Latitude
Semivariance
exp
shperical Gauss
A.
B.
A. B.
C. D.
E. F.
the ETc values varied from 84.63 to 133.10 mm. The ETc spatial behavior for December is often similar to that of January (Fig. 5A) which points towards a cyclic behavior that takes place from year to year.
For all months of the year, the highest values estimated for the coffee crop were found to occur in the northernmost part of the state; whereas the lowest values were obtained in the state’s southernmost region – always with the possi-bility of an increase in values from south to north. Because solar radiation is the main element influencing the ET0, its behavior from month to month may be explained by the variation of energy available on the soil surface. The ET0 values tend to increase from June (the winter solstice) to December (summer solstice) passing along the spring equi-nox (September) and to decrease from January to June pass-ing along autumn equinox (March).
C
ONCLUSIONS1. The water requirements of the coffee crop, as expressed by the crop evapotranspiration, vary considerably from re-gion to rere-gion in the State of Minas Gerais.
2. The greatest variations – both spatial and temporal – re-corded in the northern region of the State, pointed towards the need for further knowledge on the behavior of the region’s ETc. 3. The exponential semi-variogram model was the one that better depicted the spatial variability of ETc in Minas Gerais State, followed by the spherical and the Gaussian models.
4. In view of the unambiguous distinction made by the geo-spatiality of the coffee crop in Minas Gerais State, a correct understanding of the ETc value for each locality will be most useful to coffee growers, where irrigation manage-ment is concerned.
A. B.
C. D.
L
ITERATUREC
ITEDAgrianual 2002. Anuário da agricultura brasileira. São Paulo: FNP – Consultoria em Comércio, 2002. 356p.
Allen, R. G.; Pereira, L. S.; Raes, D.; Smith, M. Crop evapotrans-piration – Guidelines for computing crop water requirements. Rome: Food and Agriculture Organization of the United Na-tions, 1998. 300p. Irrigation and Drainage Paper, 56
Amatya, D. M.; Skaggs, R. W.; Gregory, J. D. Comparation of methods for estimating potential evapotranspiration. St. Joseph: ASAE, 1992. 27p. Paper, 92-2630
Assad, E. D.; Macedo, M. A.; Zullo Júnior, J.; Pinto, H. S.; Brunini, O. Avaliação de métodos geoestatísticos na espacialização de índices agrometeorológicos para definir riscos climáticos. Pesquisa Agropecuária Brasileira, v.38, n.2, p.161-171, 2003.
Cambardella, C. A.; Moorman, T. B.; Novak, J. M.; Parkin, T. B.; Karlen, D. L.; Turco, R. F.; Konopka, A. E. Field scale vari-ability of soil properties in central Iowa soils. Soil Science Society of America Journal, v.58, n.5, p.1501-1511, 1994.
Diggle, P. J.; Ribeiro Junior, P. J. Model-based geostatistics. In: Simpósio de Probabilidade Estatística, 14, 2000, Caxambú. Resumos... Caxambú: Associação Brasileira de Estatística, 2000. 129p.
Doorenbos, J.; Pruitt, W. O. Necessidades hídricas das culturas. Irrigação e Drenagem 24, Campina Grande: UFPB, 1997. 204p.
Mantovani, E. C. A irrigação do cafeeiro. In: Irrigação & tecnologia moderna. Brasília: ABID, 2000. v.48, p.45-49. Pereira, A. R.; Villa Nova, N. A.; Sediyama, G. C.
Evapotrans-piração. Piracicaba: FEALQ, 1997. 183p.
Ribeiro Jr., P. J.; Diggle, P. J. geoR: A package for geostatistical analysis. R-NEWS, v.1, n.2, p.15-18, 2001.
Starks, T. H.; Fang, J. H. The effect of drift on the experimental semivariogram. Mathematical Geology, v.14, n.4, p.309-319, 1982.