Revista Brasileira de
Engenharia Agrícola e Ambiental
Campina Grande, PB, UAEA/UFCG – http://www.agriambi.com.br
v.21, n.10, p.691-696, 2017
Incidence and severity of white mold in common
bean submitted to different cultivation practices
David R. P. Montes
1, Rubens A. Oliveira
1, Luan B. Giovanelli
1,
Reginaldo M. de Oliveira
1, Júlio C. M. Baptestini
2& Édimo F. A. Moreira
3 DOI: http://dx.doi.org/10.1590/1807-1929/agriambi.v21n10p691-696A B S T R A C T
Due to the socioeconomic importance of common bean in Brazil, studies that allow establishing favorable conditions for not compromising the crop with white mold, in view of the enormous damages caused by this fungus, become vital to Brazilian agriculture. Therefore, the aim of this study was to evaluate the incidence and severity of white mold in common bean (Phaseolus vulgaris L.), cultivar ‘Madrepérola’, subjected to different irrigation intervals, planting densities and fungicide application. The research was conducted in Viçosa-MG, Brazil, in the years 2011 and 2012. The statistical analysis used the split-split-plot scheme. The fungicide applications (with or without fungicide) were allocated to plots, the irrigation intervals (3, 6, 9 and 12 days) to sub-plots and planting densities (6, 9, 12 and 15 plants per linear meter) to sub-subplots, in a randomized block design with three replicates. The variation of the irrigation intervals did not contribute significantly to the control of white mold. It is recommended to use lower planting densities in order to minimize the damages caused by the disease. The use of the fungicide was the main method of white mold control in two consecutive years.
Incidência e severidade do mofo-branco
no feijoeiro submetido a diferentes tratos culturais
R E S U M O
Devido à importância socioeconômica do feijoeiro no Brasil, estudos que permitem estabelecer condições favoráveis ao não comprometimento da lavoura com o mofo-branco tornam-se vitais para a agricultura brasileira, haja vista os enormes prejuízos causados por este fungo, , razão por que se objetivou, neste trabalho, avaliar a incidência e severidade do mofo-branco na cultura do feijoeiro-comum (Phaseolus vulgaris L.), cultivar Madrepérola, submetido a diferentes turnos de rega, densidades de plantio e aplicação de fungicida. A pesquisa foi conduzida em Viçosa, nos anos 2011 e 2012. Na análise estatística foi utilizado o esquema de parcelas sub-subdivididas. Nas parcelas foi alocado o efeito do fungicida (com ou sem fungicida), nas subparcelas os turnos de rega (3, 6, 9 e 12 dias) e nas sub-subparcelas as densidades de plantio (6, 9, 12 e 15 plantas por metro linear), no delineamento experimental em blocos casualizados, com três repetições. A variação do turno de rega não colaborou significativamente para o controle do mofo-branco. Recomenda-se a utilização de menores densidades de plantio a fim de minimizar os danos ocasionados pela doença. A utilização do fungicida foi o principal método de controle do mofo-branco nos dois anos consecutivos. Key words:
Phaseolus vulgaris L. irrigation intervals planting densities fungicide
Palavras-chave: Phaseolus vulgaris L. turno de rega densidade de plantio fungicida
1 Universidade Federal de Viçosa/Departamento de Engenharia Agrícola. Viçosa, MG. E-mail: d_palomino13@hotmail.com; rubens@ufv.br;
luanbg22@hotmail.com (Corresponding author); reginaldomoliveira@hotmail.com
2 Instituto Federal de Ciência, Educação e Tecnologia do Espírito Santo. Alegre, ES. E-mail: jcbaptestini@yahoo.com.br 3 Universidade Federal de Viçosa/Departamento de Estatística. Viçosa, MG. E-mail: edimo.fernando@gmail.com
Introduction
Common bean (Phaseolus vulgaris L.) has great importance in the Brazilian agricultural context, standing out as one of the main crops of the country, being a product of relevance in the diet of the Brazilians. Common bean has great economic and social significance, with a wide geographic distribution (Schmidt & Valiati, 2006; Santana et al., 2008).
The increase of areas cultivated with common bean, especially under irrigation, has led to favorable conditions for the high incidence of diseases, causing significant damages that can make the agricultural business unviable (Pereira, 2007).
One of the commonly known and most destructive diseases of the common bean in the world is white mold, which is caused by the fungus Sclerotinia sclerotiorum (Lib.) de Bary (Tolêdo-Souza & Costa, 2003). Venegas & Saad (2010) and Machado et al. (2015) claim that white mold is the main limiting disease in the common bean cultivation in the winter. In this period, irrigation promotes favorable conditions to the disease, which finds adequate temperature and humidity (Napoleão et al., 2006). With the increase in the irrigated areas cultivated with common bean, white mold has become the disease with highest economic importance, being able to cause 100% of losses in its production (Lobo Júnior et al., 2009).
Studies that allow the monitoring and estimation of biophysical parameters of the common bean are fundamental to estimate crop yield and help in the management of diseases (Boechat et al., 2014). The present study evaluated the implementation of integrated management in the control of white mold, including the evaluation of different irrigation intervals, planting densities and fungicide application.
Material and Methods
The experiment was carried out in an Experimental Area of the Plant Science Department of the Federal University of Viçosa (UFV), located in the municipality of Viçosa, MG. The area is situated at 20º 44’ 47” S and 42º 50’ 33” W, at mean altitude of 693 m. The climate of Viçosa, according to climatic classification proposed by Köppen, is Cwa: subtropical, with dry winter.
The experiment was conducted in 2011 and repeated in 2012, in the period called third season or winter, corresponding to irrigated common bean cultivation, which has the highest occurrence of white mold in the crop. In the first year, the experimental period lasted from June 17 to October 11, 2011, and in the second year from June 14 to October 1, 2012, periods that corresponded to the crop cycle, from planting to harvest. After physical analysis of the soil in the experimental area, it was classified as clayey (Santos et al., 2005), showing the following contents: clay - 52.00 g 100 g-1, silt - 12.00 g 100 g-1 and sand - 36.00 g 100 g-1. The values of volumetric moisture relative to field capacity and permanent wilting point were 0.35 and 0.22 m3 m-3, respectively. Soil chemical analysis evidenced the following characteristics: pH - 6.14, using a pH meter; base saturation (V) - 65.70%; mean content of organic matter, determined by the Walkley-Black method - 0.56 dag kg-1; available contents of P and K, extracted with Mehlich I: 23.0
and 102.0 mg dm-3, respectively; potential acidity (H+Al), extracted with 1.0 mol L-1 calcium acetate at pH 7.0 - 2.5 cmolc dm-3 and CEC pH 7.0, determined by the sum of Ca2+ + Mg2+ + K+ + (H+Al) - 7.28 cmolc dm-3.
Fertilization was defined based on the results of the soil chemical analysis and the recommendations for the common bean crop, according to the Recommendation of Use of Fertilizers for the Minas Gerais State (CFSEMG, 1999).
In the first year of the experiment, sowing was performed on June 17 and in the following year on June 14, using a manual planter device called “matraca”. The adopted spacing between plant rows was 0.45 m. A larger amount of seeds was sown and, after emergence, thinning was performed to obtain the desired plant densities: 6, 9, 12 and 15 plants per linear meter.
The experiment was set in a randomized complete block experimental design (RCB) with three replicates, in a split-split-plot scheme, allocating to the plots the effect of fungicide - with and without application -, to the subplots the irrigation intervals - 3, 6, 9 and 12 days -, and to the sub-subplots the planting densities - 6, 9, 12 and 15 plants per linear meter.
There were 96 experimental units and each block was formed by 32 units (2 plots x 4 subplots x 4 sub-subplots). Each subplot of an irrigation interval was formed by four sub-subplots. The experimental unit consisted of four 4-m-long planting rows, resulting in an area of 7.2 m². The evaluated area of the experimental unit, 3.6 m², consisted of the two central rows.
The results were subjected to analysis of variance and regression, and the means of the qualitative factor - fungicide - were compared by F test at 0.05 probability level. For quantitative variables - irrigation interval and planting density - the data were subjected to regression analysis and the models were selected based on the significance of the coefficients (β) and coefficient of determination (R2).
Irrigation management was performed using an “Irrigâmetro”, a device composed of the association between an evaporimeter and a pluviometer, installed few meters away from the experimental area. The device was previously adjusted to the type of soil and crop, according to the recommendation of Oliveira & Ramos (2008), and used to estimate crop evapotranspiration (ETc) and, therefore, irrigation depth (Li). The rainfalls along the experimental period were measured in the pluviometer of the device, which allowed to consider them in the irrigation depths.
The irrigation depth was obtained through Eq. 1, considering the rainfalls occurred between two irrigations, for a certain irrigation interval.
Li=ETc−P
where:
Li - irrigation depth, mm;
ETc - crop evapotranspiration estimated the “Irrigâmetro”, mm; and,
P - rainfall, mm.
calculated by the differences between the current readings and those taken 3, 6, 9 and 12 days ago, for the treatments TR3, TR6, TR9 and TR12, respectively.
The fungicide Fluazinam, active ingredient of the commercial product Frowncide, was used in the control of white mold, applied at dose of 1.2 L ha-1 (0.6 kg ha-1 of active ingredient). The fungicide was applied only in the treatments with chemical control of white mold, in three applications: in the beginning of flowering, 19 days after the first application and 15 days after the second application, i.e., 57, 76 and 91 DAP, in the year 2011, and 55, 74 and 89 DAP, in the year 2012.
In both years of the experiment, the first evaluation of white mold severity on common bean was performed at the field, in the physiological maturation of the crop, after the last irrigation and before harvest. This evaluation consisted in the visual analysis of each one of the experimental units, which received grades according to the severity level of the disease. A scale from 0 to 10 was used; 0 corresponded to experimental units with no symptoms of the disease and 10 to those in which all plants were severely infected by white mold.
After harvest, white mold incidence was evaluated by calculating the percentage of plants with symptoms of the disease, analyzing all plants of one of the two central rows of each experimental unit. Subsequently, disease severity was evaluated per plant using a descriptive scale with 0, 1, 2, 3 and 4 levels, corresponding respectively to 0, 1-25, 26-50, 51-75 and 76 and 100% of infected stems and branches. The values obtained in the severity evaluations per plant were used to calculate the index of disease (ID) in each experimental unit, according to Eq. 2, presented by Paula Júnior et al. (2009).
where:
NPG - number of plants with this grade; TNP - total number of plants; and,
MVSG - maximum value of the scale of grades.
The same plants were used to determine the amount of sclerotia produced per experimental unit, calculating the mass of sclerotia per square meter, in each unit. In this evaluation, sclerotia mixed with the seeds and adhered to the pods were collected and weighed, after being threshed. Finally, grains infected by white mold were separated, counted and weighed, to determine the percentage of grains (in weight and number) with symptoms of the disease.
The values of crop evapotranspiration (ETc), per stage of the common bean crop, as well as the percentages of each value as a function of the total ETc, are presented in Table 1, for both experimental periods.
Results and Discussion
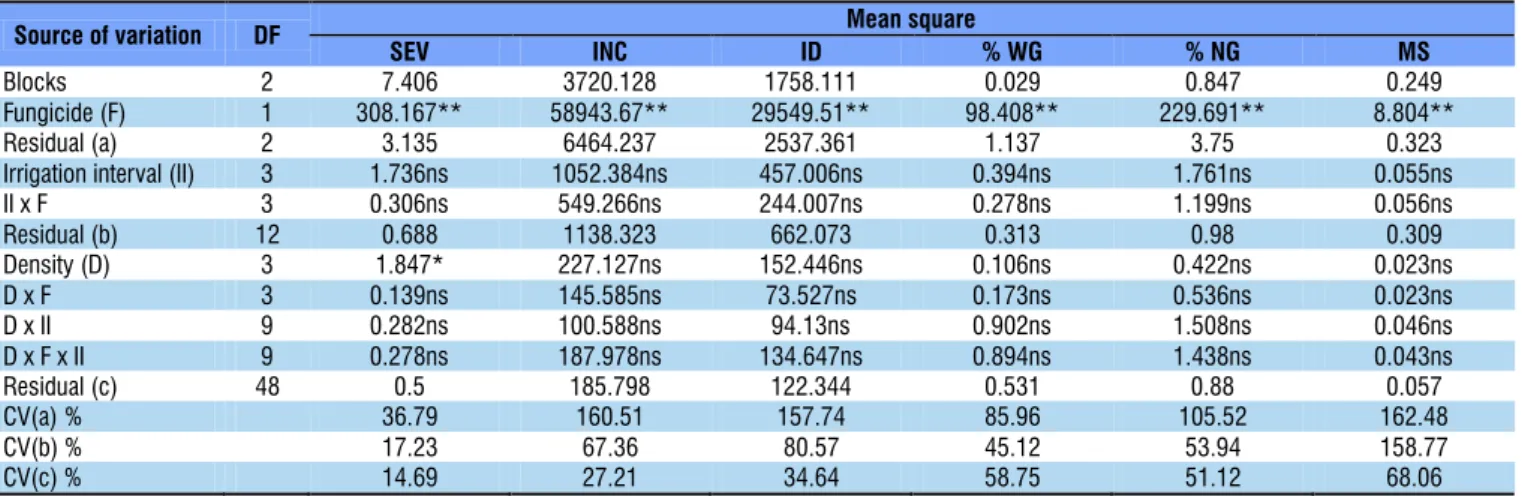
The summary of the analysis of variance for the characteristics relative to the presence of white mold in the common bean, in 2011, is presented in Table 2.
It is observed that the utilization of fungicide significantly (p < 0.01) affected white mold severity and incidence, index of disease, percentage of grains infected by white mold (in weight and number) and the mass of sclerotia per square
ID grade NPG
TNP MVSG
=
(
(
)
×(
)
×(
)
)
∑
Crop stages
2011 2012
Period ETc
(mm) (%) Period
ETc
(mm) (%)
Germination Jun 17 - Jun 26 011.4 003.44 Jun 14 - Jun 22 010.0 003.30
Initial June 27 - Jul 07 014.3 004.31 Jun 23 - Jul 04 018.8 006.20
Growth Jul 08 - Aug 10 078.2 023.58 Jul 05 - Aug 06 074.0 024.41
Intermediate Aug 11 - Sep 29 195.3 058.90 Aug 07 - Sep 18 167.5 055.26
Final Sep 30 - Oct 11 032.4 009.77 Sep 19 - Oct 01 032.8 010.82
Total Jun 17 - Oct 11 331.6 100.00 Jun 14 - Oct 01 303.1 100.00
Table 1. Crop evapotranspiration values (ETc) and their percentages as a function of the total ETc, for each crop stage
* and **Significant at 0.05 and 0.01 probability levels, respectively, by F test; ns - Not significant at 0.05 probability level
Source of variation DF Mean square
SEV INC ID % WG % NG MS
Blocks 2 7.406 3720.128 1758.111 0.029 0.847 0.249
Fungicide (F) 1 308.167** 58943.67** 29549.51** 98.408** 229.691** 8.804**
Residual (a) 2 3.135 6464.237 2537.361 1.137 3.75 0.323
Irrigation interval (II) 3 1.736ns 1052.384ns 457.006ns 0.394ns 1.761ns 0.055ns
II x F 3 0.306ns 549.266ns 244.007ns 0.278ns 1.199ns 0.056ns
Residual (b) 12 0.688 1138.323 662.073 0.313 0.98 0.309
Density (D) 3 1.847* 227.127ns 152.446ns 0.106ns 0.422ns 0.023ns
D x F 3 0.139ns 145.585ns 73.527ns 0.173ns 0.536ns 0.023ns
D x II 9 0.282ns 100.588ns 94.13ns 0.902ns 1.508ns 0.046ns
D x F x II 9 0.278ns 187.978ns 134.647ns 0.894ns 1.438ns 0.043ns
Residual (c) 48 0.5 185.798 122.344 0.531 0.88 0.057
CV(a) % 36.79 160.51 157.74 85.96 105.52 162.48
CV(b) % 17.23 67.36 80.57 45.12 53.94 158.77
CV(c) % 14.69 27.21 34.64 58.75 51.12 68.06
Table 2. Summary of the analysis of variance of white mold severity (SEV), incidence (INC), index of disease (ID), percentage of grains infected by white mold referring to weight (% WG) and number (% NG), and mass of sclerotia (MS, g m-2) in 2011
meter. Planting density (D) has effect (p < 0.05) on white mold severity.
Paula Júnior et al. (2009) conducted experiments in Viçosa-MG and observed that the adopted irrigation intervals (weekly and biweekly) did not have significant effect on white mold development. On the other hand, Napoleão et al. (2007), working in laboratory with soil and sclerotia stored, demonstrated the importance of less frequent irrigations and with smaller water volumes, until the limit of the field capacity, in the reduction of the carpogenic germination of the pathogen, through the sclerotia.
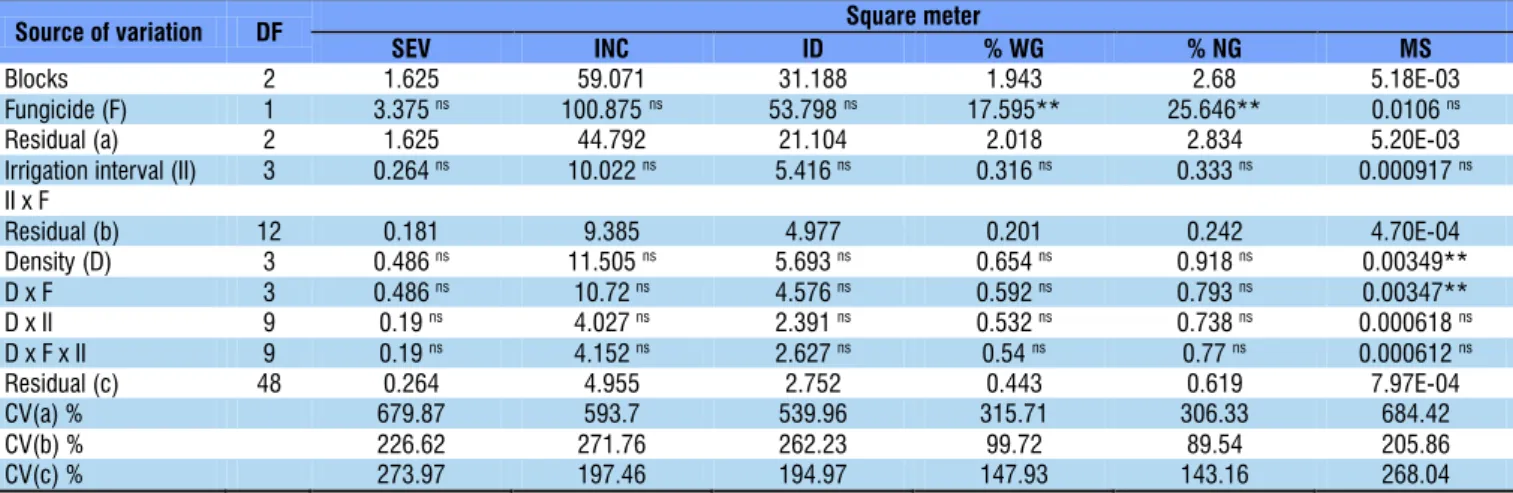
According to Table 3, there was no significant effect of the sources of variation on the evaluated characteristics, except fungicide (F), planting density (D) and the interaction between both (D x F). The source Fungicide significantly (p < 0.01) affected the percentages of grains infected by white mold, both in weight and number. The source Planting density (D) and the interaction D x F significantly (p < 0.01) affected the mass of sclerotia per square meter.
Table 4 shows the mean values of the evaluated characteristics for the conditions of fungicide application (F1: without fungicide; F2: with fungicide), in 2011 and 2012.
In 2011, white mold severity showed mean value of 6.6 (scale from 1 to 10) in the plots without fungicide application (F1), which was 120% higher than the value of plots treated with fungicide (F2). In 2012, plots under fungicide application (F2) had no plants with symptoms of the disease; thus, white mold severity was equal to 0 and showed no significant difference (p > 0.05).
White mold incidence, i.e., percentage of plants with symptoms of the disease, showed mean value of 74.9% in plants that did not receive fungicide in 2011. On the other hand, in plots under fungicide application, the mean percentage of plants infected by white mold was 25.3%. The index of disease (ID) showed significant difference (p < 0.01) in 2011, being higher in plants without chemical treatment (49.5%), compared with those under fungicide application (14.4%). The ID of each experimental unit was obtained using the values of disease severity per plant, of each one of the plants evaluated in the unit.
In 2012, white mold incidence and index of disease (ID) showed no difference between both conditions of fungicide application.
The percentage of grains infected by white mold (relative to weight and number) and mass of sclerotia per square meter, in 2011, also showed higher values in the plants that were not treated with fungicide (F1). The fungicide reduced by 91.3 and 91.2%, respectively, the weight and number of grains that showed symptoms of the disease, and by 92.8% the mass of sclerotia per square meter, evidencing the efficiency of Fluazinam in the control of white mold in common bean.
In 2012, the percentages of grains infected by white mold, in weight and number, showed significant difference (p < 0.01), with superior values in plants of the treatment F1. Fungicide application reduced by 97.7% the weight of grains infected by white mold and by 97.2% the number of grains with symptoms of the disease.
In the conditions of Viçosa-MG, studies such as Vieira et al. (2001, 2003) and Paula Júnior et al. (2009) also confirmed the importance of fungicide application in white mold control, with higher efficiency of the fungicide Fluazinam.
**Significant by F test at 0.01 probability level; ns Not significant at 0.05 probability level
Source of variation DF Square meter
SEV INC ID % WG % NG MS
Blocks 2 1.625 59.071 31.188 1.943 2.68 5.18E-03
Fungicide (F) 1 3.375ns 100.875ns 53.798ns 17.595** 25.646** 0.0106ns
Residual (a) 2 1.625 44.792 21.104 2.018 2.834 5.20E-03
Irrigation interval (II) 3 0.264ns 10.022ns 5.416ns 0.316ns 0.333ns 0.000917ns
II x F
Residual (b) 12 0.181 9.385 4.977 0.201 0.242 4.70E-04
Density (D) 3 0.486ns 11.505ns 5.693ns 0.654ns 0.918ns 0.00349**
D x F 3 0.486ns 10.72ns 4.576ns 0.592ns 0.793ns 0.00347**
D x II 9 0.19ns 4.027ns 2.391ns 0.532ns 0.738ns 0.000618ns
D x F x II 9 0.19ns 4.152ns 2.627ns 0.54ns 0.77ns 0.000612ns
Residual (c) 48 0.264 4.955 2.752 0.443 0.619 7.97E-04
CV(a) % 679.87 593.7 539.96 315.71 306.33 684.42
CV(b) % 226.62 271.76 262.23 99.72 89.54 205.86
CV(c) % 273.97 197.46 194.97 147.93 143.16 268.04
Table 3. Summary of the analysis of variance of white mold severity (SEV), incidence (INC), index of disease (ID), percentage of grains infected by white mold referring to weight (% WG) and number (% NG), and mass of sclerotia (MS, g m-2) in 2012
Table 4. Mean values of white mold severity (SEV), incidence (INC), index of disease (ID), percentage of grains infected by white mold referring to weight (% WG) and number (% NG), and mass of sclerotia (MS, g m-2), for both
conditions of fungicide application, in 2011 and 2012
Fungicide (F) F1 F2
2011
SEV 6.6 a 3.0 b
INC 74.9 a 25.3 b
ID 49.5 a 14.4 b
% WG 2.3 a 0.2 b
% NG 3.4 a 0.3 b
MS 0.6528 a 0.0472 b
2012
SEV 0.4 a 0.0 a
INC 2.2 a 0.1 a
ID 1.6 a 0.1 a
% WG 0.88 a 0.02 b
% NG 1.07 a 0.03 b
MS 0.0 a 0.0 a
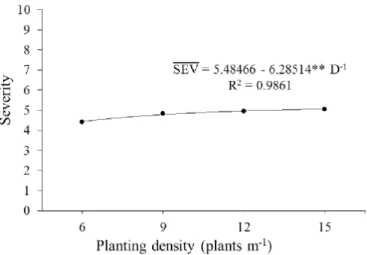
Figure 1 shows the graph and regression equation of white mold severity as a function of planting density in 2011, evidencing an increment in the first variable with the increase of density. However, there was a slightly accentuated increment between the lowest and highest planting densities.
Figure 2 shows the graph and regression equation of the mass of sclerotia per square meter relative to the treatment F1 (without fungicide application), as a function of the planting density. There was an increment in the variable with the planting density, and a sharp increase between the treatments D12 and D15. In the treatment F2 (with fungicide application), there was no significant effect of planting density, since the presence of sclerotia was not observed.
Napoleão et al. (2006) tested three spacings between common bean rows (30, 45 and 60 cm), varying and maintaining the spacing between plants. In both cases, maintaining or not the same planting density, the authors observed that the percentage of plants infected by white mold and the severity of the disease were not significantly affected by the tested spacings.
On the other hand, Macena et al. (2011) observed that the largest two spacings between common bean rows, from the three tested (20, 40 and 60 cm), promoted a significant reduction in the number of sclerotia of S. sclerotiorum, incidence and severity of white mold, in an area with history of the disease.
Conclusions
1. The fungicide Fluazinam was efficient against white mold in the two consecutive years of the study.
2. Lower planting density is recommended to minimize the damages caused by white mold.
3. The variation in the irrigation interval did not contribute significantly to the control of the disease.
Literature Cited
Boechat, L. T.; Pinto, F. A. C.; Paula Júnior, T. J.; Queiroz, D. M.; Teixeira, H. Detecção do mofo-branco no feijoeiro, utilizando características espectrais. Revista Ceres, v.61, p.907-9015, 2014. https://doi.org/10.1590/0034-737X201461060004
CFSEMG - Comissão de fertilidade do solo do Estado de Minas Gerais. Recomendações para o uso de corretivos e fertilizantes em Minas Gerais. 5.aproximação. 20.ed. Viçosa: UFV, 1999. 359p. Lobo Júnior, M.; Geraldine, A. M.; Carvalho, D. D. C.; Cobucci, T.
Uso de Cultivares de feijão comum com arquitetura ereta e ciclo precoce para escape do mofo-branco (Sclerotinia sclerotiorum). Santo Antônio de Goiás – GO: Embrapa Arroz e Feijão, 2009. 4p. Comunicado Técnico, 182
Macena, A. M. F.; Canteri, M. G.; Ferreira Júnior, J. P. Espaçamento e manejo de restos culturais para o controle de Sclerotinia sclerotiorum em feijoeiro. Ciência Rural, v.41, p.1871-1873, 2011. https://doi.org/10.1590/S0103-84782011001100003
Machado, M. L.; Pinto, F. A. C.; Queiroz, D. M. de; Paula Júnior, T. J. de; Vieira, R. F. Estimativa de severidade do mofo-branco em lavouras de feijão utilizando-se sensores hiper e multiespectral. Revista Brasileira de Engenharia Agrícola e Ambiental, v.19, p.426-432, 2015. https://doi.org/10.1590/1807-1929/agriambi.v19n5p426-432 Napoleão, R.; Café Filho, A. C.; Lopes, C. A.; Nasser, L. C. B. Efeito do espaçamento e da cultivar de feijoeiro sobre a intensidade do mofo-branco e a sanidade de sementes. Summa Phytopathologica, v.32, p.63-66, 2006. https://doi.org/10.1590/S0100-54052006000100009 Napoleão, R.; Café Filho, A. C.; Lopes, C. A.; Nasser, L. C. B.;
Marouelli, W. A. Efeito da frequência de rega e da umidade do solo sobre a germinação carpogênica de Sclerotinia sclerotiorum. Summa Phytopathologica, v.33, p.80-82, 2007. http://dx.doi. org/10.1590/S0100-54052007000100012
Oliveira, R. A.; Ramos, M. M. Manual do “Irrigâmetro”. Viçosa: Aprenda Fácil, 2008. 144p.
Paula Júnior, T. J. de; Vieira, R. F.; Rocha, P. R. R.; Bernardes, A.; Costa, E. L.; Carneiro, J. E. S.; Vale, F. X. R. do; Zambolim, L. White mold intensity on common bean in response to plant density, irrigation frequency, grass mulching, Trichoderma spp., and fungicide. Summa Phytopathologica, v.35, p.44-48, 2009. https://doi.org/10.1590/S0100-54052009000100007
Pereira, M. J. Z. Resistência do feijoeiro a Fusarium oxysporum f. sp. phaseoli. Lavras: UFLA, 2007. 103p. Tese Doutorado
Santana, M. J.; Carvalho, J. A.; Andrade, M. J. B.; Braga, J. C.; Gervásio, G. G. Coeficiente de cultura e análise do rendimento do feijoeiro sob regime de irrigação. Irriga, v.13, p.92-112, 2008.
Santos, R. D.; Lemos, R. C.; Santos, H. G.; Ker, J. C.; Anjos, L. H. C. Manual de descrição e coleta de solo no campo. 5.ed. Viçosa: Sociedade Brasileira de Ciência do Solo, 2005. 100p.
Schmidt, É. W.; Valiati, M. I. Avaliação do manejo de irrigação para a cultura de feijão (Phaseolus vulgaris) irrigada por pivô central na agrícola Wehrmann em Cristalina-GO. Revista Campo Digital, v.1, p.23-31, 2006.
Figure 2. Relationship between mass of sclerotia per square meter and planting density (D), in the year 2012
** Significant by t-test at 0.01 probability level
Tolêdo-Souza, E. D. de; Costa, J. L. da S. Métodos de inoculação de plântulas de feijoeiro para avaliação de germoplasma quanto à resistência a Sclerotinia sclerotiorum (Lib.) De Bary. Pesquisa Agropecuária Tropical, v.33, p.57-63, 2003.
Venegas, F.; Saad, J. C. C. Fungigação no controle do mofo branco e produtividade do feijoeiro em condições de cerrado brasileiro. Irriga, v.15, p.159-172, 2010. https://doi.org/10.15809/ irriga.2010v15n2p159
Vieira, R. F.; Paula Júnior, T. J. de; Peres, A. P.; Machado, J. da C. Fungicidas aplicados via água de irrigação no controle do mofo-branco no feijoeiro e incidência do patógeno na semente. Fitopatologia Brasileira, v.26, p.770-773, 2001.