Repositório ISCTE-IUL
Deposited in Repositório ISCTE-IUL:
2018-06-08
Deposited version:
Post-print
Peer-review status of attached file:
Peer-reviewed
Citation for published item:
Wang, W.-C., Pestana, M.H. & Moutinho, L. (2018). The effect of emotions on brand recall by gender using voice emotion response with optimal data analysis. In Moutinho, Luiz, Sokele, Mladen (Eds.) (Ed.), Innovative Research Methodologies in Management: Volume II: Futures, Biometrics and Neuroscience Research. (pp. 103-133). Cham: Palgrave Macmillan.
Further information on publisher's website:
10.1007/978-3-319-64400-4_5
Publisher's copyright statement:
This is the peer reviewed version of the following article: Wang, W.-C., Pestana, M.H. & Moutinho, L. (2018). The effect of emotions on brand recall by gender using voice emotion response with optimal data analysis. In Moutinho, Luiz, Sokele, Mladen (Eds.) (Ed.), Innovative Research Methodologies in Management: Volume II: Futures, Biometrics and Neuroscience Research. (pp. 103-133). Cham: Palgrave Macmillan., which has been published in final form at https://dx.doi.org/10.1007/978-3-319-64400-4_5. This article may be used for non-commercial purposes in accordance with the Publisher's Terms and Conditions for self-archiving.
Use policy
Creative Commons CC BY 4.0
The full-text may be used and/or reproduced, and given to third parties in any format or medium, without prior permission or charge, for personal research or study, educational, or not-for-profit purposes provided that:
• a full bibliographic reference is made to the original source • a link is made to the metadata record in the Repository • the full-text is not changed in any way
The full-text must not be sold in any format or medium without the formal permission of the copyright holders.
Serviços de Informação e Documentação, Instituto Universitário de Lisboa (ISCTE-IUL) Av. das Forças Armadas, Edifício II, 1649-026 Lisboa Portugal
Phone: +(351) 217 903 024 | e-mail: administrador.repositorio@iscte-iul.pt https://repositorio.iscte-iul.pt
1
THE EFFECT OF EMOTIONS ON BRAND RECALL BY GENDER USING VOICE
EMOTION RESPONSE WITH OPTIMAL DATA ANALYSIS
Maria Helena Pestana, mhpp@iscte.pt, ISCTE_IUL, Lisbon, Portugal Wan-Chen Wang, wancwang@fcu.edu.tw Feng Chia University,Taiwan, Republic of China
Luiz Moutinho, luiz.moutinho@dcu.ie
DCU Business School, Dublin City University, Ireland
ABSTRACT
Purpose – To analyses the effect of emotions obtained by oral reproduction of advertising slogans
established via Voice Emotion Response software on brand recall by gender; and to show the relevance for marketing communication of combining “Human-Computer-Interaction (HCI)” with“affective computing (AC)” as part of their mission.
Design/methodology/approach – A qualitative data analysis did the review of the scientific literature
retrieved from Web-of-Science Core Collection (WoSCC), using CiteSpace’scientometric technique; the quantitative data analysis did the analyse of brand recall over a sample of Taiwan’ participants by “optimal data analysis”.
Findings – Advertising effectiveness has a positive association with emotions; brand recall varies with
gender; and “HCI” connected with “AC” is an emerging area of research.
Research limitations/implications – The selection of articles obtained depend the terms used in WoSCC,
and this study used of only five emotions. Still the richness of the data gives some compensation.
Practical implications – Marketers involved with brands need a body of knowledge on which to base their
marketing communication intelligence gathering and strategic planning.
Originality/value - Provides exploratory research findings related to the use of automatic tools capable of
mining emotions by gender in real time, that could enhance the feedback of customers toward their brands.
Keywords: CiteSpace, Marketing communication, ODA, scientometric review, panoramic visualisation.
2
Emotions have an important role in directing responses to stimuli and have been extensively investigated in the field of psychology, receiving unprecedented recognition in the field of marketing (Consoli, 2010). Bagozzi, Gopinoth, & Nyer, (1999) described emotions as producing a mental state of readiness arising from cognitive appraisals of events or thoughts; Fridja (2007) say that emotions motivate behavior but as they are short-lived in the field of consciousness, they require immediate attention; Bagozzi and Dholakia (2006) state that emotions are important to accomplish collective goals; Romani, Grappi and Dalli (2012) state that negative emotions drive consumers away from brands; Chodlhry et al (2015) state that not all negative emotions lead to concrete construal; Dubé and Morgan (1998) affirms that higher states of positive emotions magnified increasing trends in satisfaction; Orth and Holancova (2004) show that emotions evoked by advertisements vary according to gender; Pham, Geuens and Pelsmacker (2013), show the ad-evoked feelings exert a positive influence on brand attitudes; Wierenga (2011) says that sophisticated behavioral laboratories and brain imaging methods are the next research frontier in managerial decision making in marketing.
Recall is an important physiological factor of the human learning process, where information is stored in the mind as collaborated nodes, creating a semantic network. Recalled data with stronger emotional background will ultimately lead to greater attention to stimuli and increase communication effects (Vakratsas & Ambler, 1999). Precise measurement of emotions are important given the significance of emotion in the advertising process (e.g., Martensen et al., 2007). An appealing advertising campaign arouses consumer’s positive emotion toward communicating message that is often themed with advertising slogan. According to Fiske and Taylor (1984), priming exists when current ideas come to consumer’s mind with greater ease than ideas that are not currently activated. Slogan, as a themed emotion of advertising campaign, can be applied to prime various attributes of brand perceptions (Bouch 1993).
Psychophysiological measures are more connected to brand recall (Hazlett & Hazlett, 1999; Wang, Chien & Moutinho, 2015). According to Wang, Chien and Moutinho (2015), brand recall in Mandarin Chinese is better captured by voice emotion response than by self-reported measures. Their study in Taiwan in 2015, involved a sample of 142 participants, from 18 to 55 years old. Emotions were measured in five nominal
3
categories (happy, bored, neutral, sad, angry), in order to classify eight advertising slogans of long-established brands, familiar to consumers in the Greater Chinese market: KFC (Just want KFC), Burger King (Roast is delicious), Pepsi (Enjoy delicacies, drink Pepsi!), Coca Cola (Enjoy cold, My Coca Cola); 7-Eleven (Oh! Thanks heaven! 7-7-Eleven), Family Mart (Family Mart is your home!), Suzuki (Firepower is to win), and SYM (Burn my hot blood chopper dream). To develop this previous study, the authors intend to select the voice emotion response and analyse its effect on brand recall by gender, applying Optimal Data Analysis (ODA) which is robust with small samples (Yarnold & Soltysik, 2004). A mixed method of both qualitative and quantitative design was used in the study, which, according to Fodness (1994) results in a comprehensive measurement in understanding tourist motivations.
In order to statistically measure the scientific contribution of the study, a scientometric review of the bibliographical references, which are growing rapidly in this digital information era, is undertaken. Such a review has theoretical and practical implications since the detection of potentially valuable ideas is essential to safeguard the integrity of scientific knowledge (White & McCain,1998; Morris & Van, 2008; Tabah, 1999).
The perceived contribution of this paper is its illumination of when, how, and why the effect of emotions on brand recall by gender, using voice emotion response with optimal data analysis, can be useful in the scientific domain. Hence, it is necessary to obtain an up-to-date understanding of the scientific field’s intellectual structure, and to identify exactly how the current issue connects with previously disparate patches of knowledge, creating a network of cognitively demanding ideas. The insights into the structure and dynamics of this issue are gained in computational terms, using publication records from Web-of-Science and exporting them to CiteSpace, a scientometric branch of informatics enabling the analysis of bibliographical records, articles actively cited from the domain issue, and emerging trends and changes in scientific literature over time. It is a tool that applies multiple temporal, structural, and semantic metrics and allows the visualisation of patterns from both citing and cited items (White, & Griffith, 1982; Chen, 2013; Chen, Dubin, & Kim, 2014). The temporal interval is sliced into equal mutually exclusive length segments of one year, and an individual co-citation network is derived from each slice. The merged networks and the
4
major changes between adjacent periods can be highligted in a panoramic visualisation. The following sections present literature review, methodology, results and conclusion of this study.
2. Literature review
The literature review about the subject that entitles this research was done using structural, temporal and semantic metrics, apllying CiteSpace, which allows knowing the distribution and contribution for knowledge of those references by areas of investigation. This purpose is explained in five steps: first, what is a scientometric review; second, the qualitity of the obtained analysis; third the identification of the most cited, central, burst and novelty references; fourth the identification of emerging trends; and fith the identification of Optimal Data Analysis, as an isolated area in the network of all references.
2.1. Scientometric review of the literature with CiteSpace
The bibliographical records published since 1900 appropriate to the subject title “the effect of emotions on brand recall by gender using voice emotion response with optimal data analysis” were collected from the Web-of-Science of Thomson Reuters, using the broadest possible terms to ensure that subsequent analysis via CiteSpace covered all major components of a knowledge domain (Chen, 2016). The terms chosen with the logical operator ‘AND’ were: emotions, advertising recall, and affective computing; and with the logical operator “OR” were: gender recall, and optimal data analysis. Two data sets were obtained: one corresponding directly to the core or topic search, producing 226 papers, and the other indirectly including 3,826 citations appearing at least once in any paper of the original core set, because they can be thematically relevant to the subject matter (Chen, 2013; Chen, Dubin, & Kim, 2014). References are a general term for any written scientific work, i.e. articles, books, and conferences. The resultant expanded dataset containing 4,052 references was then merged and exported to CiteSpace for scientometric review.
2.2. The scope and quality of the network
CiteSpace filters the analysis, narrowing the period of time to 1991-2016. The corresponding network has 294 unique nodes, each one representing a cited reference, and 686 links connecting them, showing various topics, it always being possible to find some irrelevant ones. Each node cites a number of related references,
5
where the connectivity between cited and citing papers captures the underlying intellectual structure of each cluster.
All the references published in a given year create a network called a time slice. The entire time period is divided into equal length mutually exclusive segments of one year. The network configuration for each time slice is based on one of seven criteria: modify g-index, top N, top N%, threshold, by citations, usage 180, usage 2013. The modify g-index with a positive scaling factor k, gives the average number of an author’s most important publications. In the current paper, the network configuration of citations and co-citations uses the g-index with a threshold (k = 9).
Top N represents the number of most cited references or occurences chosen. Top N% represents the percentage of most cited references or occurences. Threshold interpolation combines nodes and links stipulating minimum values for citation counts (c), co-citation counts (cc) and co-citation coefficients (ccv). Citations give the simple and cumulative frequency distribution of the number of cited articles. Usage 180 represents the highest number of the most download papers in the last 180 days, and Usage 2013 the highest number of the most download papers since 2013.
The sequence of time-sliced networks is merged into one containing all nodes appearing between 1991-2016, giving an overview of how the scientific field has been evolving over time. Each link from individual networks is merged based on the earliest time stamp (default option), and subsequent links connecting the same pair of nodes are dropped in order to detect the earliest moment when a connection was first made in the literature (Chen, 2008).
The network can change over time with the addition or elimination of references and links. The objective is to simplify a dense network through effective pruning, allowing its visualisation to be clarified (Chen, 2008). CiteSpace supports two pruning algorithms: the minimum spanning tree, and Pathfinder. Pathfinder is the default option and was used in this study because keeps the relevant links at a minimum and preserves the chronological growth patterns (Chen, Kuljis, & Paul, 2001; Chen, 1998 ).
6
The new improved network includes individual components of bibliographic records (nodes), and their relationships and changes over time, established via the method of Document Co-Citation (DCC), which partitioned the network into 50 non-overlapping clusters, measured by cosine coefficients (Small, 1980). The application of structural metrics (betweenness centrality, modularity, silhouette) and temporal metrics (burtness, sigma), allowed the network to be filtered and reduced to 7 (regarded as optimal) relevant
clusters, using the spectral clustering method (Luxburg, Bousquet & Belkin, 2009; Luxburg, 2006) in which strongly connected nodes were assigned to the same cluster, and non-connected nodes were assigned to different clusters. These 7 major clusters correpond to 59.5% (=175) of the 249 references, with silhouettes in the interval [0.850; 0.967], containing at least 10 references. Clusters of smaller size, despite having a high silhouette probably indicate that the same author provides all the references, thus being of no interest for analysis (Schneider, 2006).
The scientometric analysis via CiteSpace includes modularity,and silhouette as structural metrics that measure the quality of the network. Modularity (Q), rang from zero to one, measuring the extent to which a network can be divided into a number of independent groups, named clusters, such that nodes within the same group are more tightly connected than nodes between different ones. A low value of Q suggests a network that cannot be reduced to clusters with clear boundaries, whereas a high value, like the one in the current paper (0.827), suggests a well constructed network. According to Chen (2006), networks with modularity scores of 1 or very close to 1 may turn out to be trivial special cases in which individual components are simply isolated from one another. The silhouette ranges from -1 to 1, and is useful in estimating the uncertainty involved in identifying or interpreting the nature of a cluster (Rouseeuw, 1987). A value of 1 represents a perfect separation from other clusters, while a negative value suggests its diversity or heterogenity. The mean silhouette for the whole period defined by the merged network (0.544) is higher than 0.5, thereby fulfilling the conditions required by Chen (1994) for further analysis.
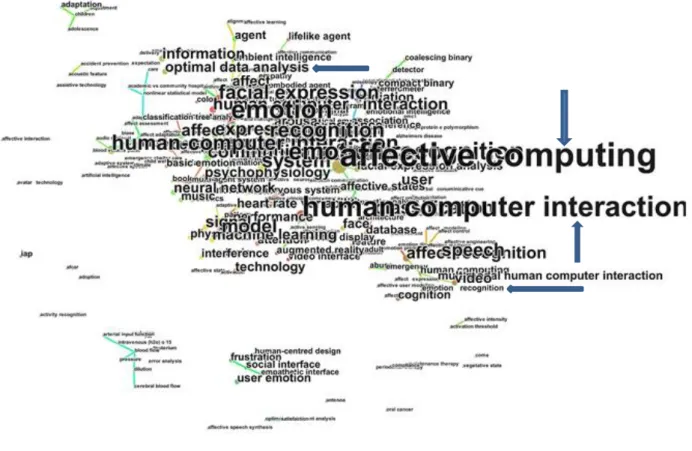
The topics involved in the field of research can be delineated in terms of keywords assigned to each reference in the dataset, as shown in Figure 1. Adjacent ones are often attributed to the same reference, with characters’ size proportional to their frequency. The keywords of optimal data analyis, affective computing,
7
human-computer-interaction, and emotion recognition are marked with arrows due their connection with the subject title.
Figure 1: Network of key words assigned to papers in the field of research
The frequency of the more relevant keywords is shown in Table 1. Emotions and affective computer were used in Web-of-Science for the current domain.
Table 1: Network of 359 keywords citations
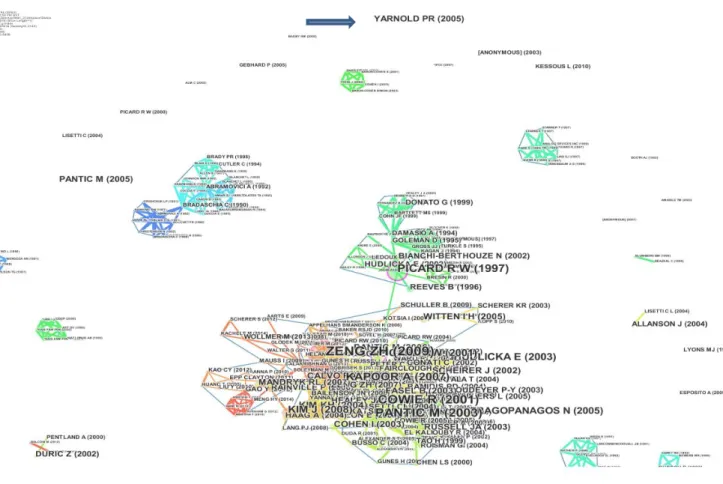
The panoramic bibliographical landscape shows the spacial distribution of clusters throughout the period 1991-2016. The collection of articles representing the state of the art in the field are identified by the first
Counts %
134 37,33 affective computing
78 21,73 human computer interaction 41 11,42 emotion 31 8,64 emotion recognition 18 5,01 recognition 16 4,46 system 15 4,18 facial expression 13 3,62 model 13 3,62 classification 359 100,00 -Citation Keywords
8
author, and have their characteristic dimensions proportional to their size (Yu & Somple, 1965). One isolated node, identified by an arrow at the top of Figure 2, refers to Yarnold P R (2005), and is related to Optimal Data Analysis (ODA), which appears in the subject title. According to Yarnold (2016), ODA accommodates all metrics, requires no distributional assumptions, allows for analytic weighting of individual observations, explicitly maximises predictive accuracy, and supports multiple methods of assessing validity.
Figure 2: Panoramic bibliographical landscape between 1991 and 2016
The citation history shown in Table 2 shows that ODA was cited in seven papers during the period 2008-2013, none of them connected with the domain of the effect of emotions on brand recall by gender using voice emotion response.
9 Table 2: Citation history of Yarnold P R (2005), Optimal Data Analysis
2.3. Relevant references in the literature
The most important references in the literature for the subject that entitles this research are those: more cited, with extraordinary attribute values, vizualized by a large radius; more central, shared by different clusters or being the only link between two different clusters, being candidates for a intellectual turning points,
identifying progressive knowledge domain; with novelty; and those having a high frequency, or bursts, in a short period of time. Those references are identified by area of research they belong. For that in the network of all literature references, it is necessary labelling those clusters (semantic metrics), and after that
identifying the references with high betweeness centrality (structural metrics), and those with citation bursts and novelty (temporal metrics).
2.3.1 Areas of research
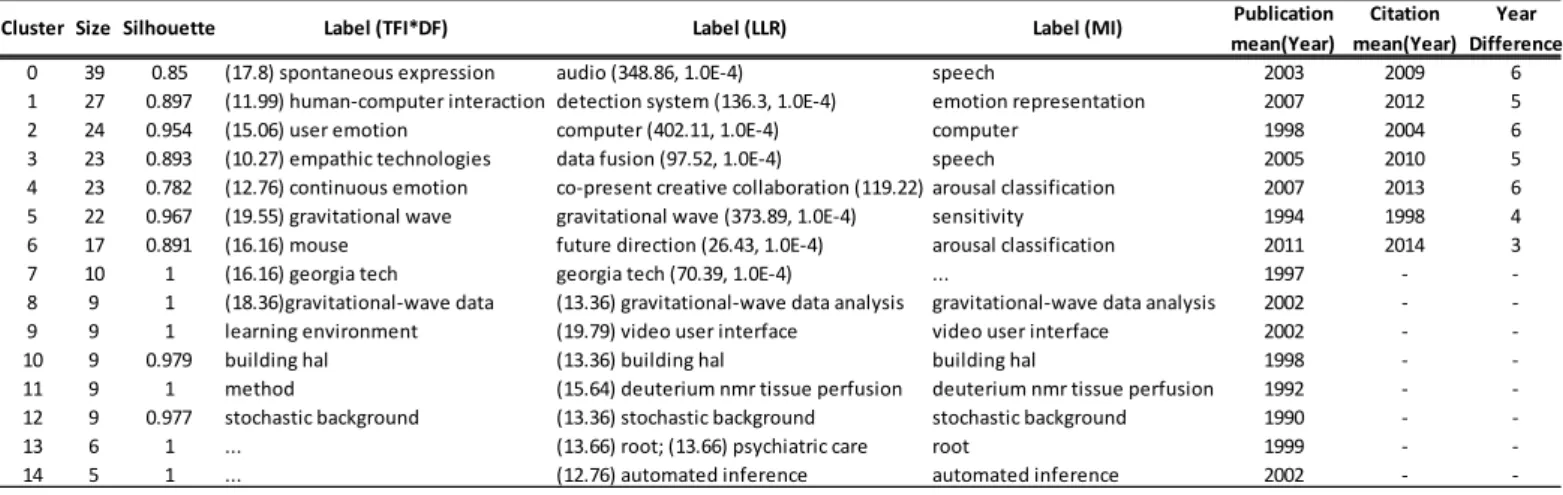
To identify the areas of research included in the network, we aplly semantic metrics where clusters are labeled from extracted titles according to three algoritms [weight terms frequency (TF*IDF); likelihood-ratio (LLR); mutual information (MI)], providing a set of cues that facilitate their interpretation and serving as symbols for scientific ideas and methods (Schneider, 2009). The algortim TF*IDF tend to represent the most salient aspects of a cluster (Salton, Yang, & Wong, 1975); and MI and LLR reflect its unique aspect (Dunning, 1993). According to Chen (2008), LLR usually giving the best result in terms of uniqueness and coverage of each cluster.
The most common area of research, with an average year of publications 2003, corresponds to cluster (#0), has the major number of references (39), and a sillhouette 0.85, indicating high homogeneity between a large number of articles in the domain, linked to each other with a very widely accepted concept, labelled as
10 spontaneous expression by TFI*DF, audio by LLR, and speech by MI. The oldest area of research, with an
average year of publications 1994, corresponds to cluster #5 with 22 homogeneous members (silhouette 0.967), being labelled as gravitational wave by both TFI*DF and LLR, and as sensitivity by MI. The newest emerging area, with an average year of publications 2011, corresponds to cluster #6, containing 17
homogeneous members (silhouette 0.891), and is labelled as mouse by TFI*DF, future direction by LLR, and as arousal classification by MI.
Table 3: Semantic metrics, mean year of publications and citations
The most relevant fifteen clusters, labelled via the TFI*DF algorithm, are represented in circle packing graph, the size and distance of each circle being proportional to their intercognitivity and relevance (Chen, 1999). Cluster #0 (spontaneous expression) with 39 references, is identified by the largest circle, while cluster #6 (mouse), with 17 references, has the seventh smallest size, marked with an arrow. Other small clusters with a small number of references, are gravitating around the first seven, as shown in Figure 1.
Publication Citation Year mean(Year) mean(Year) Difference
0 39 0.85 (17.8) spontaneous expression audio (348.86, 1.0E-4) speech 2003 2009 6 1 27 0.897 (11.99) human-computer interaction detection system (136.3, 1.0E-4) emotion representation 2007 2012 5 2 24 0.954 (15.06) user emotion computer (402.11, 1.0E-4) computer 1998 2004 6 3 23 0.893 (10.27) empathic technologies data fusion (97.52, 1.0E-4) speech 2005 2010 5 4 23 0.782 (12.76) continuous emotion co-present creative collaboration (119.22) arousal classification 2007 2013 6 5 22 0.967 (19.55) gravitational wave gravitational wave (373.89, 1.0E-4) sensitivity 1994 1998 4 6 17 0.891 (16.16) mouse future direction (26.43, 1.0E-4) arousal classification 2011 2014 3
7 10 1 (16.16) georgia tech georgia tech (70.39, 1.0E-4) ... 1997 -
-8 9 1 (18.36)gravitational-wave data (13.36) gravitational-wave data analysis gravitational-wave data analysis 2002 - -9 9 1 learning environment (19.79) video user interface video user interface 2002 -
-10 9 0.979 building hal (13.36) building hal building hal 1998 -
-11 9 1 method (15.64) deuterium nmr tissue perfusion deuterium nmr tissue perfusion 1992 - -12 9 0.977 stochastic background (13.36) stochastic background stochastic background 1990 -
-13 6 1 ... (13.66) root; (13.66) psychiatric care root 1999 -
-14 5 1 ... (12.76) automated inference automated inference 2002 -
11 Figure 3: Circle packing graph with the fifteen most cited clusters labeled by TF*IDF
The representation of the network with the most salient connections between nodes are in Figure 4, where clusters have been labelled by the LLR algorithm. The larger characters and circles are proportional to the dimension of clusters.
Cluster #5, gravitational wave has no connections with other clusters, and consequently has no betweenness centrality references, not being useful as a theoretical support for the subject title.
12 Figure 4: Links between clusters labled by LLR
2.3.2. The most relevant references of the literature by area of research
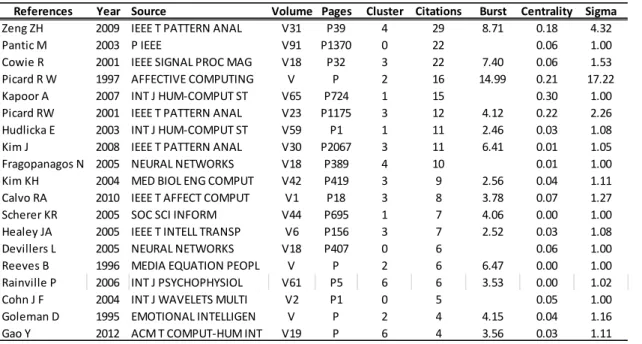
The most relevant references, analysed by citations, centrality, burst, and novelty (sigma), are identifyed by the first author in Table 4. Centrality, assume values in the intervall [0;1], and measures the extend to which a reference is in the midle of a path that connects different clusters (Brandes, 2001). High centrality identify pottentially revolucionary scientific publications as well as gatekeepers in social network (Freeman, 1977). Bursts aim to investigate where the citations of a reference increases abruptly, using the algorithm introduced by Kleinberg (2002). It detects when surge the statistically significant fluctuations on the citation count of a particular reference during a short time interval within the overal time period, (Chen, Kurjis, & Paul, 2001), regardless of how many times their host article are cited. Scientific novelty is measured through sigma, which is a combination of burtness and centrality, identifying publications that represent creative ideas, with a role more proeminent that the rate of it’s recognition by peers.
13 Table 4: Most relevant references by cluster, citations, burst, centrality and sigma.
The timeline view (Figure 5) of most of the documents cited shows they were published after 1995, while the clusters with more recent publications after 2010, marked with an arrow, came from clusters #1 and #6.
The majority of burst references (52.2%), come from cluster #3, followed by the newest cluster #6 which contains 35%.
Figure 5: Timeline view of some of the more cited references, where clusters are labeled by TF*IDF References Year Source Volume Pages Cluster Citations Burst Centrality Sigma
Zeng ZH 2009 IEEE T PATTERN ANAL V31 P39 4 29 8.71 0.18 4.32
Pantic M 2003 P IEEE V91 P1370 0 22 0.06 1.00
Cowie R 2001 IEEE SIGNAL PROC MAG V18 P32 3 22 7.40 0.06 1.53 Picard R W 1997 AFFECTIVE COMPUTING V P 2 16 14.99 0.21 17.22 Kapoor A 2007 INT J HUM-COMPUT ST V65 P724 1 15 0.30 1.00 Picard RW 2001 IEEE T PATTERN ANAL V23 P1175 3 12 4.12 0.22 2.26 Hudlicka E 2003 INT J HUM-COMPUT ST V59 P1 1 11 2.46 0.03 1.08 Kim J 2008 IEEE T PATTERN ANAL V30 P2067 3 11 6.41 0.01 1.05 Fragopanagos N 2005 NEURAL NETWORKS V18 P389 4 10 0.01 1.00 Kim KH 2004 MED BIOL ENG COMPUT V42 P419 3 9 2.56 0.04 1.11 Calvo RA 2010 IEEE T AFFECT COMPUT V1 P18 3 8 3.78 0.07 1.27 Scherer KR 2005 SOC SCI INFORM V44 P695 1 7 4.06 0.00 1.00 Healey JA 2005 IEEE T INTELL TRANSP V6 P156 3 7 2.52 0.03 1.08 Devillers L 2005 NEURAL NETWORKS V18 P407 0 6 0.06 1.00 Reeves B 1996 MEDIA EQUATION PEOPL V P 2 6 6.47 0.00 1.00 Rainville P 2006 INT J PSYCHOPHYSIOL V61 P5 6 6 3.53 0.00 1.02 Cohn J F 2004 INT J WAVELETS MULTI V2 P1 0 5 0.05 1.00 Goleman D 1995 EMOTIONAL INTELLIGEN V P 2 4 4.15 0.04 1.16 Gao Y 2012 ACM T COMPUT-HUM INT V19 P 6 4 3.56 0.03 1.11
Bursts 25.6% 25.9% 20.8% 52.2% 17.4% 13.6% 35.0%
-14
To understand the links between clusters, in table 5 it can see the most relevant papers that cite or mention members for the top seven clusters. It can be seen that Balasubramanian, R (1996), “Gravitational waves from coalescing binaries: detection strategies and Monte Carlo estimation of parameters“, is connected with 41% (coverage) of the field of research included in the oldest cluster #5. The paper Zeng, Z H (2007) “A survey of affect recognition methods: audio, visual and spontaneous expressions” is connected with 33% of the field of research included in the major cluster #0. The paper Eid, M A (2016), “Affective Haptics: Current Research and Future Directions”, is connected with 29% of the field of research included in the newest cluster #6.
Table 5: The most relevant citers of each cluster, identified by the first author
A citation bursts has two attributes: the intensity, and the length of time the status lasts. Table 6 lists the ten references with the strongest citation bursts across the entire dataset, according to the clusters to which they belong. Picard (1997) from cluster #2, is the reference with the highest burst citation, having a significant statistical flutuation over the period 2001-2005. Zeng Z H (2009) from cluster #4, follows with an abrupt increase in relation to its peers over the period 2013-2016].
Coverage Year
(%) Citer Citing Publication Citation Difference
33% Zeng, ZH, 2007, A Survey of Affect Recognition Methods: 0 39 24 2003 2009 6 Audio, Visual and Spontaneous Expressions
22% DMello, SK, 2015, A Review and Meta-Analysis 1 27 20 2007 2012 5 of Multimodal Affect Detection Systems
33% Picard, RW, 2002, Computers that recognise and respond 2 24 15 1998 2004 6 to user emotion: theoretical and practical implications
17% Frantzidis, CA, 2010, Toward Emotion Aware Computing: An Integrated Approach 3 23 21 2005 2010 5 Using Multichannel Neurophysiological Recordings and Affective Visual Stimuli
17% DMello, SK, 2010, Multimodal semi-automated affect detection from 4 23 20 2007 2013 6 conversational cues, gross body language, and facial features
41% Balasubramanian, R, 1996, Gravitational waves from coalescing binaries: 5 22 5 1994 1998 4 Detection strategies and Monte Carlo estimation of parameters
29% Eid, MA, 2016, Affective Haptics: Current Research and Future Directions 6 17 13 2011 2014 3 Cluster Size Mean (Year)
Bibliographic Details Most relevant citers of each cluster
15 Table 6: Top 10 periods of burst references, identified by the first author
In the seven first clusters, the most cited references inspiring interest in their fields, identified by the first author, are shown in a timeline view through the algorithm weight terms frequency (TFI*DF): Zeng, Z H (2009), Pantic, M (2003), Cowie, R (2001), Picard, R W (1997); Kapoor, A (2007), Kim, J (2008),
Fragopanagos, N (2005) and Kim, K H (2004). The landmarks Picard, R W (2001), and Hudlicka, E (2003), appear superimposed on Figure 4, which is why they are marked with a star.
The most relevant references, analysed by citations, burst, centrality, and sigma, are shown in Table 4. Each line of the table provides information about the first author, year of publication, source, the cluster to which it belongs, number of citations received, burst, centrality, and novelty (sigma).
Zeng, Z H (2009) is a landmark from cluster #4, labelled as continuous emotion (TFI*DF), co-presentative
collaboration (LLR) or arousal classification (MI). It has strong centrality and burst, being a pioneer
reference. This paper develops algorithms that can process spontaneously-occurring human affective behaviour. It examines available approaches to solving the problem of machine understanding of human affective behaviour, outlining some of the scientific and engineering challenges to advancing human affect-sensing technology.
Pantic, M (2003) is the highest landmark of the major cluster #0, labelled spontaneous expression (TFI*DF),
audio (LLR) or speech (MI). This paper discusses how to integrate into computers a number of components
of human behavior in the context-constrained analysis of multimodal behavioral signals.
References Year Strength Begin End 1991 - 2016 Cluster
PICARD R W, 1997, AFFECTIVE COMPUTING, V, P 1997 149.921 2001 2005 ▂▂▂▂▂▂▂▂▂▂▃▃▃▃▃▂▂▂▂▂▂▂▂▂▂▂ 2 ZENG ZH, 2009, IEEE T PATTERN ANAL, V31, P39, DOI 2009 87.067 2013 2016 ▂▂▂▂▂▂▂▂▂▂▂▂▂▂▂▂▂▂▂▂▂▂▃▃▃▃ 4 COWIE R, 2001, IEEE SIGNAL PROC MAG, V18, P32, DOI 2001 73.981 2007 2008 ▂▂▂▂▂▂▂▂▂▂▂▂▂▂▂▂▃▃▂▂▂▂▂▂▂▂ 3 KIM J, 2008, IEEE T PATTERN ANAL, V30, P2067, DOI 2008 64.141 2012 2016 ▂▂▂▂▂▂▂▂▂▂▂▂▂▂▂▂▂▂▂▂▂▃▃▃▃▃ 3 GOLEMAN D, 1995, EMOTIONAL INTELLIGEN, V, P 1995 41.479 2001 2003 ▂▂▂▂▂▂▂▂▂▂▃▃▃▂▂▂▂▂▂▂▂▂▂▂▂▂ 2 PICARD RW, 2001, IEEE T PATTERN ANAL, V23, P1175, DOI 2001 41.156 2008 2009 ▂▂▂▂▂▂▂▂▂▂▂▂▂▂▂▂▂▃▃▂▂▂▂▂▂▂ 3 SCHERER KR, 2005, SOC SCI INFORM, V44, P695, DOI 2005 40.567 2011 2013 ▂▂▂▂▂▂▂▂▂▂▂▂▂▂▂▂▂▂▂▂▃▃▃▂▂▂ 1 CALVO RA, 2010, IEEE T AFFECT COMPUT, V1, P18, DOI 2010 37.816 2012 2016 ▂▂▂▂▂▂▂▂▂▂▂▂▂▂▂▂▂▂▂▂▂▃▃▃▃▃ 3 GAO Y, 2012, ACM T COMPUT-HUM INT, V19, P, DOI 2012 35.56 2014 2016 ▂▂▂▂▂▂▂▂▂▂▂▂▂▂▂▂▂▂▂▂▂▂▂▃▃▃ 6 REEVES B, 1996, MEDIA EQUATION PEOPL, V, P 1996 6.475 2002 2003 ▂▂▂▂▂▂▂▂▂▂▂▃▃▂▂▂▂▂▂▂▂▂▂▂▂▂ 2
16
Cowie, R (2001), is a landmark of cluster #3, labelled as empathic technologies (TFI*DF), data fusion (LLR) or speech (MI). It is a pioneer reference, with high burst, responsible for connections between different fields of knowledge (centrality), and a novelty reference (sigma). This paper discusses the
recognition of seven different human negative and neutral emotions, (bored, disengaged, frustrated, helpless, over-strained, angry, impatient) by technical systems, focusing on problems of data gathering and
modelling, in an attempt to create a “Companion Technology” for Human Computer Interaction that allows the computer to react to human emotional signals.
Picard, R W (1997), is a landmark from cluster #2, labelled as user emotion (TFI*DF) or computer (LLR, MI). It has strong centrality and burst, and is a structurally essential and inspirational pioneering reference. It advances a compelling argument in favour of the need for affective computers, suggesting that a truly intelligent system, artificial or otherwise, cannot be implemented without emotional mechanisms, drawing upon data and examples taken from a wide spectrum of disciplines, from neurobiology to folk psychology, showing the potential positive applications of affective computing.
Kapoor A (2007), is a landmark of cluster #1, labelled as human-computer interaction (TFI*DF), detection
system (LLR) or emotion representation (MI). It has the highest centrality, being a pivotal reference. This
paper presents the first automated method that assesses, using multiple channels of affect-related information, whether a learner is frustrated. The new assessment method is based on Gaussian process classification and Bayesian inference and its performance suggests that non-verbal channels carrying affective cues can help to provide important information for a system to allow it to formulate a more intelligent response.
Those important landmarks and pivot nodes support the relevance of the subject title, concerned with applying a human computer interface to analyse how particular emotions (sad, bored, angry, neutral and happy), affect brand recall. Table 4 shows the most relevant references ranked by citations.
17
In order to detect emergent terms or understand the significance of a reference within a short period of time, regardless of how many times it was cited, it is important to know the top burst references, which could show some tendency over time to support the subject title.
Goleman, D (1995), from cluster #2, has a citations burst between 2001; 2003, describing a model of emotional intelligence based on competences that enable a person to demonstrate intelligent use of their emotions in managing themselves and working with others to be effective at work. This reference seeks to understand the characteristics that predict better performance and more fulfilled lives.
Scherer, K R (2005), from cluster #1, with a burst of citations between 2011 and 2013, attempts to sensitise researchers to the importance of the definition of emotions, in order to guide research and make it
comparable across disciplines, which is central for the development of instruments and measurement operations, as well as for the communication of results, and their discussion between scientists. This paper distinguishes emotions from other affective states or traits, and discusses how to measure them in a
comprehensive and meaningful way.
Kim, J (2008), from cluster #3, with a burst of citations between 2012 and 2016, investigates the potential of physiological signals as reliable channels for emotion recognition. This paper designs a musical induction method to acquire a naturalistic data set for evoking certain emotions based on the voluntary participation of subjects. The emotion recognition problem is decomposed into several refining processes using additional modalities, valence recognition, and the resolution of subtle uncertainties between adjacent emotion classes.
Calvo, R A (2010), from cluster #3, with a recent burst of citations between 2012 and 2016], describes the progress in the field of Affective Computing (AC), with a focus on affect detection. In order to achieve a truly effective real world system of affective computing, the need is stressed for an integrated examination of emotion theories from multiple areas. This paper provides meta-analyses on existing reviews of affect detection systems that focus on modalities like physiology, face, and voice, and also reviews emerging research on more novel channels such as text, body language, and complex multimodal systems.
18
Gao, Y (2012), from cluster #6, with a recent burst of citations between 2014 and 2016, analyses whether the touch behaviours when people are playing games on touch-screen mobile phones reflect players’ emotional states. The use of touch as an affective communicative channel would be an interesting modality when facial expression and body-movement recognition, or bio-signal detection, may not be feasible.
The investigation of references with strong citations bursts reveals that they can be grouped essentially into two branches: one focusing on the theoretical concept of emotions/affection and the other on emotion recognition through the interface with computers. The exploration of the expanded dataset suggests that designing and executing novel approaches to address the recognition of emotions through computers are significant and widely accepted concerns in the domain knowledge.
2.4 Emerging trends
The networks are intellectual structures of associated co-cited references representing the knowledge of a scientific field (Chen, 2013), evolving over time during which newly-published articles may introduce profound structural variation or can have little or no impact on the structure (Chen, Song & Yuan, 2008). Changes in modularity are represented by bars in Figure 6, each network being based on a two-year slicing period.
The number of new publications per year is represented by an increased line. The significant decrease in the modularity above 0.5 in three time periods: 1995-1996, 2001-2002, and 2005-2006, is expected to be explained by the appearance of citation burst references, playing an important role in changing the overall intellectual structure. Table 4 shows that the emergent trends are explained mainly by five references: Goleman, D (1995); Reeves, B (1996); Cowie, R (2001); Picard, R W (2001); and Sherer, K R (2005).
Note that 2015-2016 has modularity less than 0.5 but has no burst references, implying that those references do not contribute to emerging trends.
19 Figure 6: Modularity and new publications between 1991 and 2016
2.5 Optimal Data Analysis
Optimal Data Analysis (ODA) is a method developed by Yarnold and Soltysik (2005) which offers maximum predictive accuracy to data, even when the assumptions of the alternative statistical models are not applied. This method is used to identify patterns in the data that distinguish the effect of voice emotion response on brand recall by gender.
The accuracy of ODA is obtained by calculating the following measures: Sensitivity is the proportion of actual females who are correctly predicted by the model; Specificity is the proportion of actual males who are correctly predicted by the model; and Effect Size Sensitivity (ESS) is an index of preditive accuracy relative to chance, where values less than 25% indicate a relative weak effect; 25% - 50% indicate a moderate effect, 50% - 75% indicate a relatively strong effect, and 75% or greater indicate a strong effect over chance.
To assess generalisability, ODA first estimates using the entire sample (training set), calculating accuracy measures as described previously. Next, the model is cross-validated, and the accuracy measures are recalculated. If the accuracy measures remain consistent with those of the original model using the entire sample, as in the present study, then it can be said that the model is generalisable. The current study applies the approach of ‘leave-one-out’ (LOO) cross-validation, which is simply an n-fold cross-validation, where n= 141 observations in the dataset. Each observation in turn is left out, and the model is estimated for all
20
remaining observations. The predicted value is then calculated for the hold-out observation, and the accuracy is determined as female or male in predicting the outcome for that observation. The results of all predictions are used to calculate the final accuracy estimates. Model accuracy measures are calculated using the average values across all hold-out models. All variables included in the ODA model were constrained to achieve identical classification accuray in training (total sample), and LOO validity analysis. To ensure adequate statistical power, inhibit over-fitting, and increase the likelihood of cross-validation when the model is applied to classify a smaller independent sample, model endpoints were constrined to have N>= 10% of the total sample (Yearnold & Slotysik, 2016)
3.Results
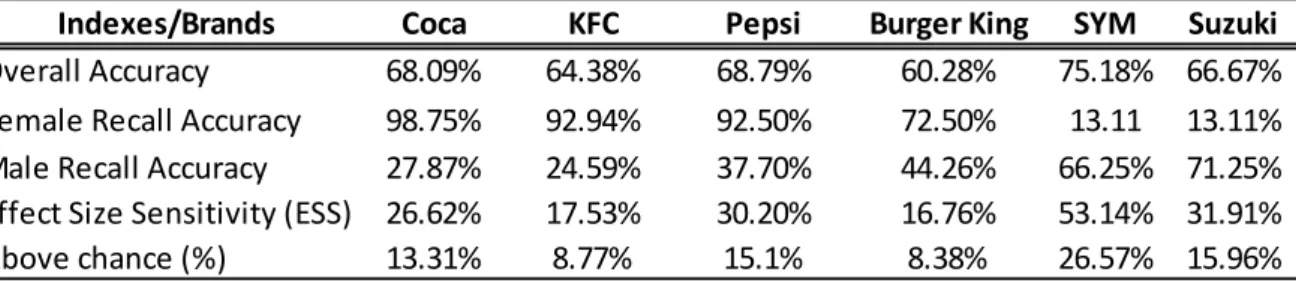
The 141 participants divided into 80 females and 61 males, were presented with eight slogans to be classified into five categories of emotion, registered by Voice Emotion Response, in order to determine the effect of the emotion on brand recall (Wang, Chien & Moutinho, 2015). This was done by gender, and by applying ODA. With the exceptions of Family Mart and 7-Eleven, the other slogans have two patterns regarding recall by gender: males feel happier in cars (Suzuki and SYM) showing greater recall than females. In the remaining four slogans, Coca-cola, Pepsi-cola, KFC and Burger King, the opposite occurs, with females being happier, and showing better recall than males. The results are in line with those found by other researchers (Teixeira, Wedel, & Pieters, 2012; Martensen, Gronholdt, Bendtsen, & Jensen, 2007; Faseur & Geuens, 2006; Janssens & De Pelsmacker, 2005; Vakratsas & Ambler, 1999) who state that a significant relationship exists between advertising effectiveness and positive emotions. The brand recall is higher when associated with positive emotions, as shown in Table 7, which reveals the performance indices of ODA to be better than chance for all brands: 8.38% for Burger King (exact p = 0.02); 8.77% for KFC (exact p = 0.003); 13.31% for Coca-Cola (p <0.00001); 15.1% for Pepsi (p <0.00001); 15.96% for Suzuki (p <0.00001); and 26.57% for SYM (p < 0.00001).
21
Tabel 7: ODA performance indices for all slogans
The observed values of the relationship between brand recall by gender are shown in Table 8. The modal gender for female recall is - in Coca-Cola (98.75% >72.13%); in KFC (92.94% >75.4%); Pepsi (92.50% > 62.3%) and Burger King (72.5% >55.73%). The modal gender for male recall is - in SYM (86.89% >33.75%) and in Suzuki (60.66% >28.75%).
Insert Table 8
Table 8: Voice Emotion Recall by gender for all slogans
Except for Family Mart and 7-Eleven, where there is a high 95.74% of recall, almost equal between genders, all other brands have a statistically significant relationship with gender. All other brands show two different patterns of recall: males are more likely to recall than female with respect to cars, while in the other four brands: Coca-cola, Pepsi-cola, KFC, and Burger King, females are more likely to recall than males. For Suzuki, males have at least 1.886 (=1/0.530) more chance of recall than females, while for Coca-Cola, females have at least 3.929 times more chance of recalling than males.
Indexes/Brands Coca KFC Pepsi Burger King SYM Suzuki
Overall Accuracy 68.09% 64.38% 68.79% 60.28% 75.18% 66.67% Female Recall Accuracy 98.75% 92.94% 92.50% 72.50% 13.11 13.11% Male Recall Accuracy 27.87% 24.59% 37.70% 44.26% 66.25% 71.25% Effect Size Sensitivity (ESS) 26.62% 17.53% 30.20% 16.76% 53.14% 31.91%
Above chance (%) 13.31% 8.77% 15.1% 8.38% 26.57% 15.96%
Voice Emotion Recall Female Male N(%) N(%)
79 44 74 38 74 61
(98.75%) (72.1%) (92.5%) (62.3%) (92.5%) (100%)
1 17 6 23 6 0
(1.3%) (27.9%) (7.5%) (37.7%) (7.5%) 0%
Female Male Female Male Female Male
58 34 74 46 23 53
(72.5%) (55.7%) (92.5%) (75.4%) (28.7%) (86.9%)
22 27 6 15 57 8
(27.5%) (44.3%) (7.5%) (24.6%) (71.3%) (13.1%)
No
Coca-Cola Pepsi-Cola FamilyMart Seven-Eleven Female Male Female Male Female Male
No 6 (7.5%) 0 0% Yes 74 (92.5%) 61 -100%
Voice Emotion Recall
24 (39.3%) 53 (66.3%) 37 (60.7%) 27 (33.8%)
Burger King KFC Suzuki SYM
Male Female
22
The magnitude of recall by similar brands are: SYM (56.74%) higher than Suzuki (42.55%); Coca-cola (87.23%) higher than Pepsi-cola (79.43%); KFC (85.11%) higher than Burger King (65.25%); Family Mart and 7-Eleven are equal (both 95.74%). This can be explained by the fact that in the Taiwanese market, SYM motorcycles are more popular than Suzuki motorcycles, and Coca-cola is still the leading soft drinks brand. KFC came to Taiwan in 1985, and Burger King in 1990, so KFC is much more well-known and loved by Taiwanese consumers. Finally, Family Mart and 7-Eleven are the top two popular brands of convenience store.
23 5. Conclusion
The scientometric review supports the relevance of research on the subject title. The analysis of the field and the citation-based expansion has outlined the evolutionary trajectory of the collective knowledge over 1991-2016, and highlighted the areas of active pursuit. Emerging trends are identified from computational properties from CiteSpace, which is designed to facilitate sense-making tasks in relation to scientific frontiers based on relevant domain literature.
The paper tracks the advancement of the collective knowledge of a dynamic scientific community through the analysis of expert references in the literature domain, using computational techniques to discern patterns and trends at various levels of abstraction, as cited and co-cited references. The research on the subject title makes the following contributions to science: connecting two isolated areas (optimal data analysis and marketing communication); integrating them into six of seven major clusters in this knowledge domain; and differentiating brand recall by gender. Human Computer Interaction (cluster #1) and Future Direction (cluster #6) are the most recent issues that continue to be referenced in 2016, with which the subject title has great probability to be connected.
It was found that men had better recall scores than women when related to cars, whereas women scored higher in recall when dealing with soft drinks and fast-food. There has been always a clear association between the memorisation process of advertisements and the triggering of an emotional state towards brands. It has been confirmed that a positive relationship between consumer recall and brand stimuli does exist.
Owing to the preliminary nature of this study, our subject sample was limited in size and scope, and the findings of this investigation may not generalize to other samples. The Voice Emotion Response can only recognize five basic emotions, and this critically constrains this study. Researchers in the Tatung University are trying to develop further techniques to recognize more emotions that better suit marketing marketing and advertising research. Further research will benefit greatly if the technology improves. Additionally, methods diversity improves the robustness of marketing research (Davis et al., 2013).
24
Future research should, therefore, try to use other psychophysiological measures to obtain more valid and reliable results with the aim of generating a deeper understanding of the construct of emotions.
References
Bagozzi, R. P, & Dholakia, U.M., (2006), Antecedents and purchase consequences of customer participation in small group brand communities. International.Journal of Research in Marketing 23 (2006) 45–61.
Bagozzi,R.P, Gopinoth, M., & Nyer, P.U. (1999). The Role of Emotions in Marketing. Journal of the
Academy of Marketing Science, 27 (2), 184-206.
Boush, D. M. (1993). How advertising slogans can prime evaluations of brand extensions. Psychology &
Marketing, 10 (1), 67-78.
Brandes, U. (2001). A faster algorithm for betweenness centrality. Journalof Mathematical Sociology, 25(2), 163–177.
Chan, E.Y. (2015). Endowment effect for hedonic but not utilitarian goods. Intern. J. of Research in Marketing 32 (2015) 439–441.
Chen, C., (1998). Generalized similarity analysis and pathfinder network scaling. Internacting Comput., vol.10:107-128.
Chen, C. (1999). Visualising semantic spaces and author cocitation net-works in digital libraries. Information Processing & Management, 35(3),401–420.
Chen, C.; Kuljis, J., & Paul, R.J. (2001). Visualizing Latent Domain Knowledge. IEEE Transtions on Systems, Man, and Cybernetics- Parte C: Applications and reviews, vol.31, nº4, Nov.
Chen, C., & Paul, R.J., (2001).Visualizing a knowledge domain’s intellectual structure. IEEE Computer, vol 34: 65-71.
Chen, C. (2005). The centrality of pivotal points in the evolution of scientificnetworks. In Proceedings of the International Conference on IntelligentUser Interfaces (IUI 2005) (pp. 98–105). New York: ACM Press
Chen, C.(2006). CitespaceII: Detecting and visualizing emerging trends and transient patterns in scientific literature, J.Am.Soc. Inf. Sci. Tecnhol.57, 359-377.
25
Chen, C., (2008). An information-theoretic view of visual analytics. IEEE Computer Graphics and Applications, 28 (1): 18-23.
Chen, C. (2013). The Structure and Dynamics of Scientific Knowledge. In Mapping Scientific Frontiers; Springer: London, UK, 2013; pp. 163–199.
Chen, C. (2013). The Structure and Dynamics of Scientific Knowledge. In Mapping Scientific Frontiers; Springer: London, UK, pp. 163-199.
Chen, C.; Dubin, R.; Kim, M.C (2014). Emerging trends and new developments in regenerative medicine: A scientometric update (2000–2014). Expert Opin. Biol. Ther. 14, 1295–1317
Chen, C. The Citespace Manual (2016). http://cluster.ischool.drexel.edu/~cchen/citespace/Cite SpaceManual.pdf.
Cohen, S.C., & Areni, C. (1991). Affect and Consumer behavior. In. Robertson, T. & Kassarjian, H.H. (Eds). Handbook of Consumer Behaviour (188-240). Englewood Cliffs. New Jersey: prentice Hall.
Cowie, R., (2001). Machine Understanding of Human Behavior. IEEE Signal Proc Mag,V18,P32 .
Chowdhry, N., Winterich, K. P., Mittal, V., & Morales , A.C. (2015).
Not all negative emotions lead to
concrete construal. Intern. J. of Research in Marketing 32 (2015) 428–430.
Consoli, D. (2010). A New Concept of Marketing: The Emotional Marketing. Brand. Broad Research in
Accounting, Negotiation, and Distribution, 1 (1), 1-8.
Dube´, L., & Morgan, M.S., (1998). Capturing the dynamics of in-process consumption emotions and satisfaction in extended service transactions. Intern. J. of Research in Marketing 15
26 1998. 309–320.
Dunning, T. (1993). Accurate methods for the statistics of surprise and coincidence. Computational Linguistics, 19(1), 61–74
Faseur, T., & Geuens, M. (2006). Different positive feelings leading to different Ad evaluations. Journal of
Advertising, 35(4), 129-142.
Fodness, D. (1994). Measuring tourist motivation. Annals of Tourism Research, 21(3),555- 581. Freeman, L.C. (1977). A set of measuring centrality based on betweenness.Sociometry, 40, 35–41. Frijda, N. (2007). The Laws of Emotıon. London: Routledge.
Goleman, D., Boyatzis, R., & Rhee, K.S. (1995). Clustering Competence in Emotional Intelligence: Insights from the emotional competence inventory (ECI).
Hasford, J., Farmer, A., & Waites, S.F., (2015). Thinking, feeling, and giving: The effects of scope and valuation on consumer donations. Intern. J. of Research in Marketing 32 (2015) 435–438.
Hazlett, R. L., & Hazlett, S. Y. (1999). Emotional response to television commercials: facial EMG vs. self-report. Journal of Advertising Research, 39(2), 7-23.
Kapoor, A., Burlesonc,W., & Picard, R.W (2007). Automatic prediction of frustration. Int. J. Human-Computer Studies 65: 724–736.
Kleinberg, J. (2002). Bursty and hierarchical structure in streams. Proceedings of Proceedings of the Eighth ACM SIGKDD International Conference on Knowledge Discovery and Data Mining (pp. 91–101). NewYork: ACM Press.
Kwortnik Jr., R.J., & Ross Jr., W.T. (2007). The role of positive emotions in experiential
decisions.Intern. J. of Research in Marketing 24 (2007) 324–335.
Lee, Y.C., Chen, C., & Tsai, X.T., 2016. Visualizing the Knowledge Domain of Nanoparticle Drug Delivery Technologies: A Scientometric Review. Applied Sciences 6(1):11 · January. DOI: 10.3390/app6010011.
Luxburg, U.v. (2006). A tutorial on spectral clustering. Retrieved October 10, 2008, from http://www.kyb.mpg.de/publications/attachments/Luxburg06_TR_%5B0%5D.pdf
Luxburg, U.v., Bousquet, O., & Belkin, M. (2009). Limits of spectral clustering. Retrieved October 10, 2008, from http://kyb.mpg.de/publications/pdfs/pdf2775.pdf
27
Janssens, W., & De Pelsmacker, P. (2005). Advertising for new and existing brands: the impact of media context and type of advertisement. Journal of Marketing Communications, 11(2), 113-128.
Martensen, A., Gronholdt, L., Bendtsen, L., & Jensen, M. J. (2007). Application of a model for the effectiveness of event marketing. Journal of Advertising Research, 47 (3), 283-301.
Menon,K., & Dubé, L., (2007). The effect of emotional provider support on angry versus
anxious consumers. Intern. J. of Research in Marketing 24 (2007) 268–275.
Morris, S.A., & Van der Veer Martens, B. (2008). Mapping research special-ties.Annual Review of Information Science andTechnology, 42, 213–295.
Orth, U.R., & Holancova, D., (2004).Men’s and women’s responses to sex role portrayals in advertisements. Intern. J. of Research in Marketing 21 (2004) 77– 88
Pantic, M., & Rothkrantz , L.J.M.,(2003). Towards Emotion Recognition in Human Computer Interaction.P IEEE,Proceedings of the IEEE, 91(9): 1370-1390.
Pham, M.T., Geuens, M., & Pelsmacker, P.D., (2013). The influence of ad-evoked feelings on brand evaluations:Empirical generalizations from consumer responses to more than 1000 TV commercials. Intern. J. of Research in Marketing 30 (2013) 383–394
Picard, R. (1997). Affective Computing. Cambridge: The MIT Press.
Picard, R.W. (2001). Computers that recognise and respond to user emotion: theoretical and practical implications. IEEE T PATTERN ANAL, V23,P1175.
Kim, J., Emotion Recognition Based on Physiological Changes in Music Listening. IEEE Transactions on pattern analysis and machine intelligence, VOL. 30, NO. 12, DECEMBER
Reeves, B., (1996).The timing of facial motion in posed and spontaneous smiles. Media Equation People. Romani, S., Grappi, S., & Dalli, D., (2012). Emotions that drive consumers away from brands: Measuring
negative emotions toward brands and their behavioral effects. Intern. J. of Research in Marketing 29 (2012) 55–67
Rousseeuw, P.J. (1987). Silhouettes: A graphical aid to the interpretationand validation of cluster analysis. Journal of Computational and AppliedMathematics, 20, 53–65.
Salton, G., Yang, C.S., & Wong, A. (1975). A vector space modelfor information retrieval. Communications of the ACM, 18(11),613–620.
28
Schneider, J.W. (2006). Concept symbols revisited: Naming clusters byparsing and filtering of noun phrases from citation contexts of conceptsymbols. Scientometrics, 68(3), 573–593.
Schneider, J.W. (2009). Mapping of cross-reference activity between jour-nals by use of multidimensional unfolding: Implications for mappingstudies. In B. Larsen & J. Leta (Eds.), Proceedings of 12th Inter-national Conference on Scientometrics and Informetrics (ISSI 2009)(pp. 443–454). Rio de Janiero, Brazil: BIREME/PAHO/WHO and FederalUniversity of Rio de Janeir
Sherer, K.R. (2005). What are emotions? And how can they be measured? Social Science Information SAGE Publications (London, Thousand Oaks, CA and New Delhi), 0539-0184. DOI: 10.1177/0539018405058216 Vol 44(4), pp. 695–729.
Small,H. (1980). Co-citation context analysis and the structure of paradigms. Journal of Documentation, 36 (3):183-196.
Tabah, A.N. (1999). Literature dynamics: Studies on growth, diffusion, andepidemics. Annual Review of Information Science and Technology, 34,249–286
Teixeira, T., Wedel, M., & Pieters, R. (2012) Emotion-induced engagement in internet video advertisements. Journal of Marketing Research, 49 (2), 144-159.
Vakratsas, D., & Ambler, T. (1999). How advertising works: What do we really know?, Journal of
Marketing, 63(1), 26-43.
Wang, W.C., Chien C.S., & Moutinho, L. (2015). Do you really feel happy? Some implications of Voice Emotion Response in Mandarin Chinese. Marketing Letters, 26 (3), 391-409.
White, H.D., & Griffith, B.C. (1982). Authors as markers of intellectualspace—co-citation in studies of science, technology and society. Journalof Documentation, 38(4), 255–272.
White, H.D., & McCain, K.W. (1998). Visualizing a discipline: An authorcocitation analysis of information science, 1972–1995. Journal of theAmerican Society for Information Science, 49(4), 327–355.
Wierenga, B., (2011). Managerial decision making in marketing: The next research frontier. Intern. J. of Research in Marketing 28 (2011) 89–101.
Yarnold, P. R., & Soltysik, R. C. (2005). Optimal data analysis. A guidebook with software for Windows. Washington DC: American Psychological Association.
Yarnold, P. R., & Soltysik, R. C. (2016). Maximizing Predictive Accuracy. Chicago, Il: ODA Books. doi:10.13140/RG.2.1.1368.3286.
29
Yu, P.,& Sample, V., (1965). Networks of scientific papers. Science, 169, 510-515.
Zeng, Z.H., (2009). A Survey of Affect Recognition Methods: Audio, Visual, and Spontaneous Expressions. IEEE T PATTERN ANAL.V31: P39