Original Article
Heat stress in grapevine: the pros and cons of acclimation
Luísa C. Carvalho,1João L. Coito,1Silvana Colaço,1Maurício Sangiogo1,2& Sara Amâncio11Centro de Botânica Aplicada à Agricultura, Departamento de Recursos Naturais, Ambiente e Território, Instituto Superior de Agronomia, Universidade de Lisboa, 1349 017 Lisboa, Portugal2Centro de Educação Superior Norte, Universidade Federal de Santa Maria, Cx. Postal 54; CEP: 98.400-000 Frederico Westphalen, RS, Brasil
ABSTRACT
Heat stress is a major limiting factor of grapevine production and quality. Acclimation and recovery are essential to ensure plant survival, and the recovery mechanisms can be inde-pendent of the heat response mechanisms. An experimental set up with and without acclimation to heat followed by recovery [stepwise acclimation and recovery (SAR) and stepwise recovery (SR), respectively] was applied to two grapevine varieties, Touriga Nacional (TN), and Trincadeira (TR), with different tolerance to abiotic stress. Major differ-ences were found between leaves of SAR and SR, especially after recovery; in SAR, almost all parameters returned to basal levels while in SR they remained altered. Acclimation led to a swifter and short-term antioxidative response, affecting the plant to a lesser extent than SR. Significant differences were found among varieties: upon stress, TN sig-nificantly increased ascorbate and glutathione reduction levels, boosting the cell’s redox-buffering capacity, while TR needed to synthesize both metabolites, its response being insufficient to keep the redox state at working levels. TR was affected by stress for a longer period and the up-regulation pattern of antioxidative stress genes was more obvious. In TN, heat shock proteins were significantly induced, but the canonical heat-stress gene signature was not evident prob-ably because no shutdown of the housekeeping metabolism was needed.
Key-words: Acclimation and recovery; AsA; chlorophyll fluo-rescence; GSH; photosynthesis; redox state; transcript expression.
INTRODUCTION
As sessile organisms, plants are unable to circumvent changes taking place in their surrounding environment. Therefore, environmental fluctuations of temperature, water availability and light intensity will have immediate repercussions on a plant’s life cycle. Plants can endure moderately high tempera-tures for a period of time without injuries or death. Usually, the definition of heat stress (HS) is an increase in tempera-ture above a threshold level that persists long enough to cause irreversible damage to plant growth and development (Wahid et al. 2007). Even a temporary increase of 10–15 °C above the ambient temperature can cause HS. However, we
must bear in mind that HS is a composite function of inten-sity (degrees of temperature), length and rate of increase in temperature (Wahid et al. 2007). HS is responsible for cell damages such as protein denaturation and aggregation, and increased fluidity of membrane lipids with loss of membrane integrity. Indirectly related to heat is the inactivation of enzymes in the chloroplast and mitochondria, a general inhi-bition of protein synthesis, accompanied by an increase of protein degradation (Wahid et al. 2007). These injuries will ultimately lead to inhibition of growth, reduced ion flux and production of reactive oxygen species (ROS; Wahid et al. 2007). However, plants are able to maintain growth and reproductive success by sensing changes in the surrounding environment and reacting through mechanisms at the cellu-lar, physiological and developmental levels. These response mechanisms enable plants to react rapidly, within hours or days, to extremes in the environment that could otherwise be injuring or lethal (Jenks & Hasegawa 2014).
Thermo-tolerance, the ability to acclimate to otherwise lethal high temperatures, was described for the first time more than 40 years ago (Larkindale et al. 2005). Heat toler-ance results from previous exposure to a moderate stress treatment, which can be a short and sub-lethal high tempera-ture (Larkindale & Vierling 2008). A key and common element of acquired thermo-tolerance in all organisms is the induction and synthesis of molecular chaperones or heat shock proteins (HSPs; Vierling 1991). In fact, a number of HSPs coded by different gene families, as well as heat shock transcription factors (HSFs), are associated to heat acclima-tion and resistance to HS in Arabidopsis (Hong & Vierling 2000; Lee et al. 2005) and tomatoes (Frank et al. 2009). Small heat shock proteins (sHSPs) are a family of low-molecular mass HSPs (12–40 kDa). In plants, this family is more preva-lent and more diverse in sequence similarity, cellular location and functions than the other HSP families (Waters et al. 1996). sHSPs can be found in the nuclear–cytoplasmic com-partment and plastids, mitochondria, endoplasmic reticulum and peroxisomes (Kotak et al. 2007). In grapevine 13, sHSPs have been identified (Genoscope 12X, http://www .genoscope.cns.fr/externe/GenomeBrowser/Vitis/). Their role in the response to stress is distinct from that of the other HSPs. Functionally, they confer thermo-tolerance in an ATP-independent way by selectively binding and stabilizing pro-teins, preventing their aggregation at elevated temperatures, and protecting enzymes against heat-induced inactivation (Ganea 2001). The high diversification of plant sHSPs Correspondence: S. Amâncio. e-mail: [email protected]
probably reflects molecular adaptations to stress conditions that are unique to plants. In fact, they respond to an extensive scope of environmental stresses such as heat, cold, drought, salinity and oxidative stress, and their accumulation is strongly correlated with tolerance to stress (Waters et al. 1996; Sun et al. 2002; Wang et al. 2003).
The response of the Arabidopsis transcriptome to HS has been thoroughly scrutinized (Rizhsky et al. 2004; Busch et al. 2005; Schramm et al. 2008) and more recently, that of grape-vine also (Liu et al. 2012). Plant hormones, such as abscisic acid (ABA), salicylic acid and ethylene, and other metabo-lites, namely hydrogen peroxide and calcium signalling, have been identified as key regulators of the acquisition of thermotolerance in plants (Larkindale & Knight 2002; Larkindale et al. 2005).
The processes of acclimation and recovery from HS are essential to ensure plant survival and the recovery mecha-nisms, thus set in motion can be independent of the direct heat response mechanisms (Vinocur & Altman 2005). When gene expression is analysed in different plant species subjected to high temperatures under various conditions, including accli-mation, recovery, duration of stress treatments, different tissues, developmental stages and growth conditions, common patterns of transcript expression can be identified, affecting circa 2% of the genome (Rizhsky et al. 2004). In grapevine leaves, the number of HS-regulated genes was almost twice that of recovery-regulated genes, with genes coding sHSPs and APX identified as playing important roles in thermo-tolerance to acute HS, while genes for HSF7 and HSF1 may act in the recovery phase (Liu et al. 2012). It is common that transcripts decreasing in response to stress conditions are overlooked, although at present, there are strong indications that down-regulation of specific transcripts is paramount in effective HS acclimation (Larkindale & Vierling 2008; Ghosh & Pugh 2011). Examples are transcripts associated with growth and general metabolism, which are down-regulated upon stress, indicating that acclimated plants can limit nones-sential cellular processes until the return of temperatures favourable for growth (Larkindale & Vierling 2008).
Temperature is widely considered a foremost influencing factor of grapevine productivity, worldwide wine production and quality are severely limited by temperature stresses (Cramer 2010) and climate change scenarios predict this limi-tation to worsen. Photosynthesis is affected by temperatures above 35 °C (Salvucci & Crafts-Brandner 2004), and in wine-producing regions, midday air temperature can surpass 40 °C in the summer. Extreme temperatures are prone to reduce berry quality and decrease economic revenue (Howell 2001) because of deleterious effects on berry ripening (Liu et al. 2012). Natural field conditions are difficult to reproduce and to compare with controlled conditions; however, results obtained under extreme controlled conditions are also diffi-cult to extrapolate to field ones. In order to make a bridge between natural conditions and the artificial treatments described in the literature, we set up two HS treatments, one with acclimation and recovery, respectively, before and after an acute stress period and another one only with recovery. Two grapevine varieties, Touriga Nacional (TN) and
Trincadeira (TR) were chosen because of their contrasting responses to stress. TN has higher capacity for heat dissipa-tion via evaporative cooling than TR and thus can be consid-ered as better adapted to warm climate conditions, without water restraint, both in the field (Costa et al. 2012) and in controlled conditions (Carvalho et al. submitted).
In leaves of the grapevine variety Aragonez, (syn Tempranillo) after acute HS using a high-throughput tran-scriptomic grapevine array, we verified that the expression of a number of genes coding for HSPs, and transcription factors were significantly affected by HS (Rocheta et al. 2014). The grapevine varieties TN and TR were also scrutinized under the same acute HS conditions for gene expression with the high-throughput transcriptomic grapevine array (Rocheta et al. unpublished data). To get a more complete insight on how plants acclimate to and recover after HS, in the current study, the response of the varieties TN and TR under the two HS treatments were compared at the level of photosynthesis, H2O2production, the course of the antioxidant system and of cellular redox status, the expression of key antioxidant response genes and of several HSPs, as well as the expression of the genes mostly up- or down-regulated in the tran-scriptomic array of TN and TR under acute HS.
MATERIAL AND METHODS
Plant material and stress treatments
Cuttings from pruned wood of pre-selected plants of the varieties TN and TR collected from a production vineyard in Pegões (70 km south-west from Lisbon, Portugal) and treated with fungicide (Benlate, Syngenta Crop Protection, Greensboro, NC, USA, 2%), were kept at 4 °C for 2 months, and treated with the same fungicide before rooting. The cut-tings were rooted in complete nutrient solution diluted in distilled water (10:1, v : v) in the dark. Rooted cuttings were placed in a growth room in 3 L pots filled with sterilized soil, well watered with nutrient solution whenever necessary, in controlled conditions with irradiance of 300μmol quanta m−2s−1, photoperiod of 16 h light/8 h dark and temperature of 25 °C day/23 °C night.
HS treatments were applied when circa 4-month-old plants were 70 cm high. Two different treatments were performed, SAR, a stepwise acclimation to heat with slow recovery; and SR, with a rapid increase of temperature (acute HS) and a slow recovery (Fig. 1). In SAR, the acclimation and recovery steps were obtained by subjecting the plants to 32 °C for 3 h, termed 32u, when the temperature is increasing (or going ‘up’) and termed 32d, when temperature is returning to basal (or going ‘down’). The HS temperatures provided by a homogenous heat source and measured at the surface of the leaf, were applied from the third hour of the light period as follows: SAR: 3 h at 32 °C, for the acclimation to temperature increase (SAR32u), 1 h at 42 °C (SAR42), 3 h at 32 °C (SAR32d), 24 h under control conditions (SAR25); SR: 1 h at 42 °C (SR42), 3 h at 32 °C (SR32d), 24 h under control con-ditions (SR25) as outlined in Fig. 1. Control plants (C25) were kept at 25 °C and measurements were done in the middle of the light period.
In each temperature point of both treatments and control, six plants were assessed for photosynthetic performance, and leaf samples were taken for quantification of different metabolites and gene expression analysis.
Photosynthesis and chlorophyll fluorescence
Photosynthetic rate at ambient CO2and light responses (A/I) curves were measured at each temperature point, on the third fully expanded leaf from six plants per treatment using an open gas-exchange system (IRGA LCPro+ da ADC Bioscientific Ltd., Herdforshire, UK). Light curves were per-formed at ambient CO2(approximately 350μmol mol−1CO2) and different irradiances (I) measured were recorded every 380 s or before, if the photosynthesis rate had already stabi-lized, at each irradiance. Light intensities rose stepwise from 0 to 1750μmol m−2s−1. Stomatal conductance (g
s) was meas-ured at the same light intensities used for the photosynthesis curves. Leaf temperature was monitored along with the light response curves as shown in Supporting Information Table S1.
Using the parameters thus estimated, the further analysis of A/I curves using SPSS 17.0 software (SPSS Inc., Chicago, IL, USA) allowed the determination of the light compensa-tion point (LCP), maximum photosynthesis rate (Amax) and dark respiration (Rd). Rd was the intercept of the A/I curve with the Y axis, LCP was the light intensity at which the release and consumption of oxygen were equal (intercept with the X axis) and Amax was given as the asymptotic A value as irradiance tends to infinity.
Simultaneously, chlorophyll a fluorescence was measured on the third fully expanded leaf from six plants per treatment using a Pulse Amplitude Modulation Fluorometer
(mini-PAM, Photosynthesis Yield Analyzer, Walz, Germany), with a saturation pulse intensity extending up to 18 000μmol photons m−2s−1and actinic light corresponding to the photo-synthetically active radiation.
Metabolites
Extraction for the quantification of glutathione,
ascorbate, chlorophyll and carotenoids
Leaf material (0.5 g) was randomly collected at each time point and frozen in liquid N2. Each sample was homogenized in 5 mL of ice cold 6% meta-phosphoric acid (pH 2.8), con-taining 1 mM ethylenediaminetetraacetic acid, in the pres-ence of liquid N2. Homogenates were centrifuged at 27 000 g for 15 min at 4 °C and the resulting acid extract was stored at −80 °C prior to analysis of glutathione, ascorbate, chlorophyll and carotenoids.
Glutathione quantification
Reduced (GSH) and oxidized (GSSG) glutathione were analysed colorimetrically by the 2-vinylpiridine method described by Anderson et al. (1995). GSH and GSSG concen-trations were expressed inμmol g−1fresh weight. Percentage of reduction corresponds to the percentage of total glutathione pool present as GSH and is defined as GSH/ (GSH + GSSG)× 100.
Ascorbate quantification
Ascorbic (AsA) and dehydroascorbic (DAsA) acids were assayed using a method adapted from Okamura (1980). To determine AsA and total ascorbate, 125μL of the acid
Figure 1. The experimental design used to apply two types of heat stress treatments to two grapevine varieties: Touriga Nacional (TN) and Trincadeira (TR). In stepwise acclimation and recovery (SAR), plants were subjected to a 3 h acclimation period at 32 °C (SAR32u, when temperature is increasing, or going ‘up’), followed by 1 h heat stress at 42 °C (SAR42) and a recovery of 3 h at 32 °C (SAR32d, when temperature is returning to basal, or going ‘down’). In stepwise recovery (SR), plants were subjected to a rapid 1 h heat stress at 42 °C (SR42) and a recovery of 3 h at 32 °C (SR32). C25 corresponds to plants in control conditions (temperature of 25 °C during the light period); SAR25 and SR25 correspond to a measurement taken after 24 h at control temperature in plants previously subjected to SAR and SR, respectively.
extract was neutralized with 25μL of 1.5 M triethanolamine. After thorough mixing, 150μL of 150 mM sodium phos-phate buffer pH 7.4 were added. For the quantification of total ascorbate 75μL of 10 mM Dithiothreitol (DTT) were added. This was followed by 15 min incubation at 25 °C to reduce the DAsA present in the extract. To remove excess DTT, 75μL of 0.5% (w/v) N-ethylmaleimide was added. The samples were then mixed and incubated 30 s at 25 °C. For the quantification of AsA, water was added instead, so that the volumes of both samples were equal. To both samples, the following reagents were added successively: 300μL of 10% (w/v) trichloroacetic acid, 300μL of 44% (v/v) phos-phoric acid, 300μL of 4% (w/v) 2,2′-dipyridyl in 70% ethanol and 150μL of 3% (w/v) FeCl3. After mixing, the samples were incubated for 1 h at 37 °C. Absorbance was recorded at 525 nm. The concentration of DAsA was calcu-lated by subtracting the AsA concentration measured from the total ascorbate determined. Standard curves of AsA in the range of 10–60μM were prepared in 5% metapho-sphoric acid.
Chlorophyll analysis
Chlorophyll was extracted from four leaf disks (total area 113 mm2). Disks were incubated in 3 mL dimethyl sulphoxide at 65 °C for 1 h, and absorbance was measured at 645 and 663 nm (adapted from Hiscox & Israelstam 1979). Chloro-phyll concentration was calculated using the equations described by Porra et al. (1989): Chl a (μg mL−1) = 12,00 × A663− 3,11× A645; Chl b (μg mL−1) = 20,78× A645− 4,88× A663; tot Chl (μg mL−1) = 17,67× A645+ 7,12× A663; and converted to mg Chl cm−2 leaf area (Richardson et al. 2002).
H
2O
2quantification
H2O2production was detected using a fluorometric horse-radish peroxidase-linked assay (Amplex Red assay kit, Invitrogen, Thermo Fisher Scientific: https://www .lifetechnologies.com/). Leaf material (0.1 g) was collected at each time point and ground over activated charcoal in the presence of liquid N2as described by Creissen et al. (1999). Samples were centrifuged 10 min at maximum speed and the supranatants were kept on ice until measurements. H2O2 con-centrations in purified extracts were determined according to the manufacturer’s instructions. Absorbance was then meas-ured with a microplate reader at 570 nm. H2O2 concentra-tions were expressed inμmol g−1fresh weight.
ABA analysis
The extracts for the measurement of ABA were carried out as described by (Vilela et al. 2007) using [3H]-ABA (GE Healthcare, Wilmington, MA, USA) as an internal control to monitor ABA yield and recovery. ABA was quan-tified through immunoassay by indirect enzyme-linked immunosorbent assay with monoclonal antibodies, using a commercial kit (Olchemim Enzyme Immunoassay, Olomouc, Czech Republic), according to the manufacturer’s recommendations.
Gene expression by RT-qPCR
Total RNA extraction and cDNA synthesis
Samples were ground with a mortar and pestle in the presence of liquid nitrogen. Total RNA was extracted with the RNA Plant Total RNA Kit (Sigma-Aldrich, Inc., St. Louis, MO, USA) following the manufacturer’s instructions. Nucleic acid concentration of each sample was quantified by spectro-photometry using the software Gen5 1.09 (Synergy HT, Bio-Tek Instruments,Winooski,VT, USA).Total RNA quality was assessed using the A260/A280and A260/A230. Only RNA samples with A260/A280between 1.8 and 2.1 and A260/A230between 2.0 and 2.2 were used. Total RNA integrity was checked through 1% agarose gel electrophoresis under denaturing conditions. RNA samples were treated with RQ1 RNase-Free DNase (Promega, Madison, WI, USA). cDNA was synthesized from 2μg of total RNA using oligo(dT)20 in a 20μL reaction volume using RevertAid Reverse Transcriptase (Fermentas Life Science, Helsingborg, Sweden) according to the manufa-cturer’s recommendations. cDNA was tested for gDNA con-tamination in PCRs using intron spanning primers that yield a 229 bp amplicon in cDNA and a 547 amplicon in gDNA. Amplicon sizes were compared in 2% agarose gels together with the molecular weight marker 1 Kb+ (Invitrogen) and no gDNA contamination was detected. cDNA was stored at −20 °C until further use.
RT-qPCR
Primers were designed using the software Beacon Designer (Premier Biosoft, Palo Alto, CA, USA) using a primer length of 20± 2 bp, melting temperature of 60 °C ± 2 °C, a guanine– cytosine content of circa 50% and an expected amplicon size of 180–280 bp (Table 1). Sequences were nine HSPs that had been significantly up-regulated in a previous experiment of acute HS (1 h at 42 °C) using the GrapeGene 520510F Array (Affymetrix, Santa Clara, CA, USA) applied to both varieties (Rocheta et al. unpublished data; accession: GSE57669) and nine previously tested oxidative stress response genes (Carvalho et al. 2006).
RT-qPCR was performed in 96-well white reaction plates (Bio-Rad, Hercules, CA, USA), using an IQ5 Real Time PCR (Bio-Rad) with three biological replicates and two technical replicates. The 20μL reaction mixture was composed of 1 μL cDNA diluted 50-fold, 0.5μM of each gene-specific primer and 10μL master mix (SsoFast_EvaGreen Supermix, Bio-Rad). Amplification of PCR products was monitored via intercalation of Eva-Green (included in the master mix). The following programme was applied: initial polymerase activa-tion, 95 °C, 3 min; then 40 cycles at 94 °C 10 s (denaturation), 60 °C 20 s (annealing), 72 °C 15 s (extension). The PCR prod-ucts were run on 2% agarose gels to make sure that there was only one amplicon of the expected size. PCRs with each primer pair were also performed on samples lacking cDNA template, in triplicate (no template controls).
To generate a baseline-subtracted plot of the logarithmic increase in fluorescence signal (ΔRn) versus cycle number, baseline data were collected between the cycles 5 and 17. All
T able 1. T ranscripts used for R T -qPCR analysis of Touriga Nacional (TN) and Trincadeira (TR) NCBI Reference Annotation and abbreviation F orward primer Reverse primer bp HSPs XM_002267889 Small heat shock protein 26.5 kDa, mitochondrial (HSP26.5) 5′ A GGGC A G A GGA GA CGA GA C 3′ 5′ A T C A GTCGGA GTCC A TGT A TCG 3′ 109 XM_002272382 Small heat shock protein, chloroplastic HSP20 family (HSP20) 5′ CCTCTGGC AA CCC A C AAA C 3′ 5′ GGTCC A TTGCGTCC A T C A T 3′ 292 XM_002270560 Small heat shock protein 23.6 kDa, mitochondrial (HSP23.6) 5′ CCGCCTCCTCTCCTCTCC 3′ 5′ TCTTCGCC A T C A TCGT A GTCG 3′ 109 XM_002280785 Class I heat shock protein,18.2 kDa (HSP18.2A) 5′ GAA GGA GGAA GTGAA GGTTGA G 3′ 5′ A C A CCGTTCTCC A T A GT A GCCT 3′ 192 XM_002263340 Heat shock protein 22.0 kDa (HSP22) 5′ GA GGTGAA GA T A GA GGTGGA CG 3′ 5′ GA GC A CCCC A TTCTC AA GC 3′ 192 XM_002280644 Class II heat shock protein 17.9 kDa (HSP17.9A) 5′ CGTC AA GGA GT A CCCC AA TTC 3′ 5′ AA CTTCCCC A CCCTCCTCT 3′ 177 XM_002281249 Class I heat shock protein 18.2 kDa (HSP18.2B) 5′ CCGTTCC AA GA CTTCCC A T T 3′ 5′ CTCCCTTCCTC AA CCTCT A CCT 3′ 170 XM_002280449 Class II heat shock protein 17.9 kDa (HSP17.9B) 5′ TTCCT A CGCCTTC A T C A TCG 3′ 5′ A C A CGCC A TCTTGA C AAA CC 3′ 230 XM_002281224 Class I heat shock protein 18.2 kDa (HSP18.2C) 5′ CC A TTCC A GGA CTTCCC A T T 3′ 5′ CTCGGTGCC A CTTGTC A TTC 3′ 235 Ref . genes XM_002282403 T ranslation initiation factor eIF-3 subunit 4 (TIF) 5′ AAA GC A GAA GAAA CC AA GA TT 3′ 5′ TTGCC A GTGCCTGT A G T A GCC 3′ 206 XM_002271296 T ranslation initiation factor eIF-2B alpha subunit (TIF-GTP) 5′ A G C A GC A C A GAA T A A GAAA CT 3′ 5′ CC A T C A GCCCC AA C AAA T A CC 3′ 177 AF369525.1 Actin 2 (act) 5’ TGGA TTCTGA TGGTGTGA GTC 3′ 5′ C A A TTTCCCGTTC A G C A GT A GTGG 3′ 167 Oxidative stress genes XM_002284731 Ascorbate peroxidase (APX1), cytosol 5′ -GCCCC A C C A TTGA CTTTGT A CC-3 ′ 5′ -A TCGCTCTGGA TGTGCCCTTC-3 ′ 218 XM_002278245.1 Ascorbate peroxidase (APX3), peroxisome 5′ -CGCCTTGGA CCGAA CT A TCTGC-3 ′ 5′ -A CGA CCTTCTC A CGCTTGCC -3 ′ 186 AF236127 Catalase (C A T), peroxisome 5′ -GTGC A GTC AAA CTGTGCCTT A G-3 ′ 5′ -GA GCGAA GAA C A GGCT A C A G A T -3 ′ 200 XM_002285636.1 Glutathione reductase (GOR2), cytosol 5′ -GT A TTGGCTGCGA TGGCTGTTC-3 ′ 5′ -A CGGCGA CC A CGGA GA GG-3 ′ 274 NM_001281138.1 Copper -Zinc SOD(CZSOD), chloroplast, cytosol 5′ -GA TTGGGA TGTTGGGTTC A C-3 ′ 5′ -GTC AAAA CCTC AA CGCC A T T -3 ′ 188 XM_002267363 Iron SOD (F eSOD), chloroplast 5′ -CCTT A CGA TT A TGGCGC A T T -3 ′ 5′ -CTTC A CTGGAA GGA GC AA GG-3 ′ 542 EU280161.1 Manganese SOD (MnSOD), mytochondria 5′ -CT A TCCCTGAAA GTTTGTCTC-3 ′ 5′ -AA GCTGTGAA GGT A GTGGC-3 ′ 152 NM_001281063.1 Dehydroascorbate reductase (DHAR), cytosol 5′ -C AA CTGGTTC AA CGGTC A T -3 ′ 5′ -C A C A GCCTTTCC A TTCTTT -3 ′ 226 XM_002282964 Monodehydroascorbate reductase (MDHAR), cytosol, peroxisome 5′ -GCCCC A C C A TTGA CTTTGT A CC-3 ′ 5′ -A TCGCTCTGGA TGTGCCCTTC-3 ′ 140 T ranscripts coding sHSPs (obtained when using the GrapeGene 520510F array (Af fymetrix) in plants subjected to 42 °C for 1 h), reference genes (Coito et al . 2012) and oxidative stress genes (Carvalho et al . 2006). Gene names , NCBI annotation, forward and reverse primers , and length of the product obtained are indicated.
amplification plots were analysed with an Rnthreshold of 0.2, at the beginning of the region of exponential amplification to obtain Cq (quantification cycle) and the data obtained were exported into an MS Excel workbook (Microsoft Inc., Redmond, WA, USA) for further analysis (Livak & Schmittgen 2001). In order to compare data from different PCR runs, Cqvalues were normalized to the Cqvalues of act, TIF and TIF-GTP (Table 1), that are found to be stable under abiotic stress conditions (Coito et al. 2012).
Statistical analysis
Two-way analysis of variance (anova; SAS 9 for Windows, SAS Institute, Inc., Cary, NC, USA) was used to study the effects of the stress treatments on the different physiological parameters and contents of H2O2, pigments, glutathione, ascorbate and ABA in the two varieties studied. For the expressions of the genes studied, the relative quantity values were transformed into log2 (thus rendering them parametric) and also tested through anova when the P value of the anova was lower than 0.05, treatments were compared with their respective controls and each treatment was compared in both varieties, through Tukey’s multiple comparison tests and sta-tistically significant differences were accepted for a P value lower than 0.05. These analyses were performed using SAS 9 for Windows (SAS Institute, Inc.).
RESULTS
H2O2, pigments and antioxidative metabolites
Leaf H2O2was quantified in TR and TN in both heat treatments (Fig. 2). In TR-SAR, H2O2content showed a bimodal pattern, increasing significantly in SAR32u and SAR32d as compared with the control while the values measured at the highest
tem-perature (SAR42) and after 24 h recovery at 25 °C (SAR25) did not differ significantly from the control while in TN-SAR H2O2 content remained unchanged. In SR, H2O2did not increase after 1 h at 42 °C (SR42), being delayed to SR32 and not regaining control values after the 24 h recovery (SR25).
Total chlorophyll (Chl t) and Chl b content was signifi-cantly higher in leaves of control plants of TN than in TR (Fig. 3), unsurprising, as the typical darker hue of green in the leaves already implies. In TR-SAR, Chl t was only signifi-cantly higher after acclimation (SAR32u), while in SAR32d, both varieties showed a dramatic increase. Chl t decreased after 24 h recovery (SAR25) to control values in TN and maintained significantly high values in TR. In both varieties,
Figure 2. Hydrogen peroxide quantification in leaves of Touriga Nacional (TN) and Trincadeira (TR) in stepwise acclimation and recovery (SAR) and stepwise recovery (SR). Each value expressed inμmol g−1fresh weight (FW) is the mean of four independent
samples measured in triplicate (n = 4). Statistically significant differences after Tukey’s multiple comparison tests for a P value lower than 0.05 are the following: * Significant difference between TN and TR;asignificant difference between TN and the respective
control;bsignificant difference between TR and the respective
control;○significant difference between a TN stress moment and the previous one;●significant difference between a TR stress moment and the previous one (○and●do not exist in SAR32u and SR42 because they correspond to the significant differencesa
andb, respectively).
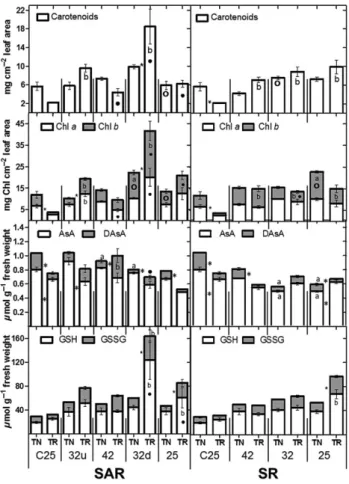
Figure 3. Carotenoid, chlorophyll a and b (Chl a and Chl b), reduced (AsA) and oxidized (DAsA) ascorbate and reduced (GSH) and oxidized (GSSG) glutathione concentration in leaves of Touriga Nacional (TN) and Trincadeira (TR) in stepwise acclimation and recovery (SAR) and stepwise recovery (SR). Each value is the mean of four independent samples measured in triplicate (n = 4). Statistically significant differences after Tukey’s multiple comparison tests for a P value lower than 0.05 are the following: * Significant difference between TN and TR;
asignificant difference between TN and the respective
control;bsignificant difference between TR and the respective
control;○significant difference between a TN stress moment and the previous one;●significant difference between a TR stress moment and the previous one (○and●do not exist in SAR32u and SR42 because they correspond to the significant differences
aandb, respectively).
Chl t increased significantly after the recovery in SR. Carot-enoid values followed the same pattern as Chl t in the control (TR significantly lower than TN; Fig. 3). In TR-SAR (Fig. 3), the value of SAR42 was similar to the control and to the recovery (SAR25), while the two SAR32 values and all the TR-SR values were significantly high.
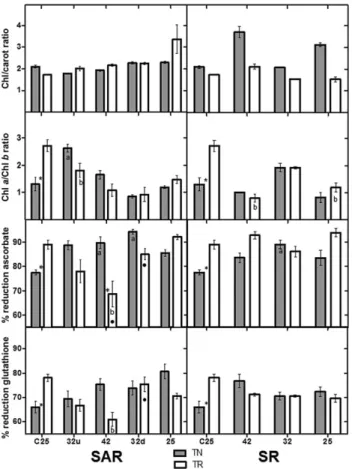
The amounts of reduced and oxidized ascorbate, as well as the percentage reduction were measured in both treatments in both varieties (Figs 3 and 4). The two varieties have differ-ent basal levels of ascorbate and of percdiffer-entage reduction. TR has higher percentage reduction (Fig. 4) and lower amounts of both reduced and oxidized ascorbate (Fig. 3). There were no significant increases in AsA either in TN-SAR or TR-SAR while DAsA decreased after acclimation and stress in TN (SAR32u and SAR42) and increased in TR in SAR32u
(Fig. 3). As a consequence, the percentage reduction in TN increased significantly in those moments, while it decreased significantly in TR (Fig. 4). In TN-SR, there was a significant decrease of both AsA and DAsA in SR32, which was main-tained until SR25 (Fig. 3). However, and as in SAR, the stress effect was less pronounced in TN, and consequently, the per-centage reduction increased significantly on SR32, attaining almost basal levels at SR25 (Fig. 4).
The percentage reduction of glutathione (Fig. 4) was signifi-cantly higher in TR. Upon both treatments,TN maintained the total amount of glutathione, but the reduced pool increased steadily and was still high on SAR/SR25. In TR-SAR, a bimodal pattern was detected in total glutathione content, with peaks on both SAR32 (u and d), and values were still high on SAR/SR25. The increase of total glutathione in TR-SAR was also accompanied by an increase in GSSG (Fig. 3), which led to a significant decrease of the percentage reduction to the lowest values measured, in SAR32u (Fig. 4).
ABA content
ABA concentration changed consistently in both varieties on both treatments (Fig. 5): SAR experienced a steady rise along the experiment, peaking on SAR32d, returning to near-control levels on SAR25 while on SR, the lowest ABA con-centrations corresponded to the maximum temperature (SR42), increasing abruptly on SR32 and returning to basal levels on SR25.
State of the photosynthetic apparatus
The effect of both treatments on the plant’s photosynthetic capacity was assessed through light response curves that allowed the calculation of Amax, gs, LCP and Rd (Fig. 6), and through the quantification of chlorophyll fluorescence parameters (Fig. 7).
Figure 4. Total chlorophyll (Chl)/carotenoid (carot) ratio, Chl
a/Chl b ratio, percentage of reduction of ascorbate and of
glutathione in leaves of Touriga Nacional (TN) and Trincadeira (TR) in stepwise acclimation and recovery (SAR) and stepwise recovery (SR). Each value is the mean of four independent samples measured in triplicate (n = 4). Statistically significant differences after Tukey’s multiple comparison tests for a P value lower than 0.05 are the following: * Significant difference between TN and TR;asignificant difference between TN and the respective
control;bsignificant difference between TR and the respective
control;○significant difference between a TN stress moment and the previous one;●significant difference between a TR stress moment and the previous one (○and●do not exist in SAR32u and SR42 because they correspond to the significant differencesa
andb, respectively).
Figure 5. Abscisic acid (ABA) concentration in leaves of Touriga Nacional (TN) and Trincadeira (TR) in SAR and SR. Each value expressed in pmol mg−1dry weight is the mean of four
independent samples measured in triplicate (n = 4). Statistically significant differences after Tukey’s multiple comparison tests for a
P value lower than 0.05 are the following: * Significant difference
between TN and TR;asignificant difference between TN and the
respective control;bsignificant difference between TR and the
respective control;○significant difference between a TN stress moment and the previous one;●significant difference between a TR stress moment and the previous one (○and●do not exist in SAR32u and SR42 because they correspond to the significant differencesaandb, respectively).
Although plants were grown at relatively low light inten-sities, overall photosynthesis rates were more similar to those measured in sun-type leaves than in shade leaves (Greer et al. 2011), and the differential response of the two varieties was put in evidence by other photosynthetic parameters (Figs 6 and 7). On SAR Amax and gswere not significantly different in both varieties (Fig. 6), while Rd was initially lower in TR, increasing after SAR42 and reaching the same values as TN on SAR25. LCP was significantly higher in TN with the onset of stress (from SAR32u), pointing to a reduction of photo-synthetic efficiency. On SR the most striking difference among varieties was measured in Amax, with TN keeping higher values than TR during the period of stress. In parallel, TR-SR had more difficulty in recovering the values of gsafter stress than TN-SR, what possibly affected photosynthesis
rates because of closed stomata. Also, there was a loss of photosynthetic efficiency because of increased respiration rates in TR-SR after the beginning of stress conditions.
Maximum efficiency of photosystem II (PSII) photochem-istry in dark-adapted leaves (Fv/Fm) was unaffected on SAR Figure 6. Photosynthetic parameters measured in plants of
Touriga Nacional (TN) and Trincadeira (TR) in stepwise
acclimation and recovery (SAR) and stepwise recovery (SR), using an open gas-exchange system (IRGA LCPro+ da ADC
Bioscientific, Ltd.). Amax corresponds to the maximal rate of photosynthesis, gsis the stomatal conductance at 300μmol quanta
m−2s−1, LCP represents the light compensation point and Rd is the
dark respiration. Each value is the mean of six independent samples (n = 6). Statistically significant differences after Tukey’s multiple comparison tests for a P value lower than 0.05 are the following: * Significant difference between TN and TR;asignificant
difference between TN and the respective control;bsignificant
difference between TR and the respective control;
○significant difference between a TN stress moment and the
previous one;●significant difference between a TR stress moment and the previous one (○and●do not exist in SAR32u and SR42 because they correspond to the significant differencesaandb,
respectively).
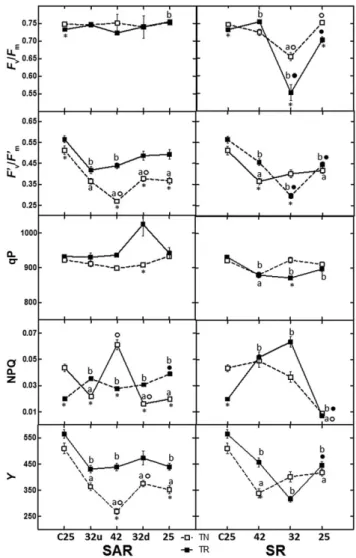
Figure 7. Chlorophyll fluorescence parameters measured in leaves of Touriga Nacional (TN) and Trincadeira (TR) in stepwise acclimation and recovery (SAR) and stepwise recovery (SR). Fv/Fm
represents the maximum efficiency of photosystem II (PSII) photochemistry in dark-adapted leaves, F′v/F′mcorresponds to the
maximum quantum efficiency of PSII in light-adapted leaves, qP corresponds to the light energy used in photosynthesis, NPQ (Fm/F′m– 1) gives an estimate of the light energy not used in
photosynthesis and functions as an indicator of photoprotective processes through the dissipation of energy as heat
(Demmig-Adams and Adams 1992), Y equates to the operating quantum efficiency of PSII photochemistry. Statistically significant differences after Tukey’s multiple comparison tests for a P value lower than 0.05 are the following: * significant difference between TN and TR;asignificant difference between TN and the respective
control;bsignificant difference between TR and the respective
control;○significant difference between a TN stress moment and the previous one;●significant difference between a TR stress moment and the previous one (○and●do not exist in SAR32u and SR42 because they correspond to the significant differencesa
andb, respectively).
in both varieties, while on SR, there were significant decreases on SAR32 (Fig. 7). Conversely, maximum quantum efficiency of PSII in light-adapted leaves (F′v/F′m) showed a steady decrease until SAR42 in TN, while in TR, the lowest values were registered in SAR32u and a recovery thereafter to values lower than control in both varieties. In SR, this parameter was negatively affected in both varieties, TN attaining the lowest values on SR42 while the lowest value of TR was reached on SR32, both recovering to equivalent values on SR25, although lower than control. Photochemical quenching (qP), a factor indicating the amount of light energy actually channelled to photosynthesis, increased on SAR32d in TR and on SR32 in TN. On SR25, equivalent values were attained on both varieties. Non-photochemical quenching (NPQ) gives an estimate of the light energy not used in photosynthesis and functions as an indicator of photoprotective processes through the dissipation of energy as heat (Demmig-Adams & Adams 1992). TR-SAR showed
no significant changes in the values of this parameter while TN-SAR responded with a clear peak on SAR42 (Fig. 7). On SR, both varieties showed increases, TN peaking on SR42 and TR on SR32 decreasing to equivalent values on SR25, lower than control for both varieties. Y equates to the oper-ating quantum efficiency of PSII photochemistry and its values steadily followed the same pattern as F′v/F′min both varieties in SAR and SR (Fig. 7).
Gene expression signatures
Previously tested oxidative stress response genes (Carvalho et al. 2006) were monitored in SAR and SR in both varieties, and the level and significance of gene expression clearly sepa-rated the varieties as well as the two treatments (Fig. 8). In TN-SAR, the levels of up-regulation were just above the level of significance in all time points except 25, while the change in gene expression in TN-SR was hardly significant in
Figure 8. Relative gene expression ratios obtained by RT-qPCR of nine antioxidative stress genes (APX1, APX3, CAT, GOR2, FeSOD,
MnSOD, CZSOD, DHAR and MDHAR) and of nine transcripts coding sHSPs (HSP17.9A, HSP17.9B, HSP18.2A, HSP18.2B, HSP18.2C, HSP20, HSP22, HSP23.6 and HSP26.5) quantified in Touriga Nacional (TN) and Trincadeira (TR). The sequences of the primers used for
amplification are presented in Table 1. Relative expressions in relation to control plants in each treatment and stress moment were calculated and values were normalized with respect to translation initiation factor eIF-3 subunit 4 (TIF), translation initiation factor eIF-2B alpha subunit (TIF-GTP) and actin 2 (act) mRNA. The data correspond to log2(fold-expression)of three independent samples measured in duplicate.
Values within log2(fold-expression)< |2| are not significantly different from the controls. Statistically significant differences after Tukey’s multiple
comparison tests for a P value lower than 0.05 are the following:●significant difference between a TN/TR stress point and the previous one; * significant difference between TN and TR within a stress moment and indicated in the figure only in TN. SAR, stepwise acclimation and recovery; SR, stepwise recovery.
all time-points and for all genes, with the exception of GOR2. In TR-SAR, the levels of up-regulation (again with the exception of SAR25) were very significant in all genes, while in TR-SR, up-regulation levels were slightly lower. The most significantly up-regulated genes in TR were ROS scavengers (CZSOD, MnSOD, CAT and both APXs) while GOR2 had the highest levels of expression in TN. The monitoring of the expression of nine HSPs yielded a slightly different pattern of response as compared with antioxidative genes (Fig. 8). The levels of up-regulation in SAR in both varieties were signifi-cantly high in all transcripts except HSP23.6. In SR, the responses were different in TN and TR, with high levels of up-regulation kept after 24 h recovery at 25 °C in TN for all the transcripts except HSP18.2A and HSP23.6. In fact, HSP18.2A was significantly down-regulated upon stress (SR42). In TR-SR HSP26.5 suffered no significant changes from the control, HSP18.2A was only significantly up-regulated on SR42 and HSP23.6 and HSP18.2B were down-regulated.
DISCUSSION
Plants have several response mechanisms at their disposal to cope with high temperature. These range from short-term avoidance or acclimation to long-term evolutionary adapta-tions (Kotak et al. 2007). Stress-related responses are divided into two major groups: the first comprising antioxidants and scavengers of ROS and the second responsible for signalling cascades and transcriptional control (Valliyodan & Nguyen 2006). HS is no exception to this dual behaviour, and when plants are subjected to high temperatures, the response takes place at those two main levels. Stress-responsive mechanisms are set in motion to secure cell homeostasis and the integrity of cell components. When both levels of response are not synchronized, the final result can be inadequate to counter the deleterious effects of the stress, ultimately leading to irreversible cell damage and having as the final consequence, cell death (Bohnert et al. 2006).
Here we determined how grapevine varieties TN and TR differ in their response to HS applied with and without accli-mation and after recovery. The responses were evaluated through ROS production (H2O2), chlorophyll and carotenoid content, ascorbate and glutathione content and redox state, ABA production, photosynthetic capacity and expression of key genes.
Cellular redox state
H2O2is a strong oxidant that targets thiol groups, but it can also mediate the cellular redox status and regulate events that control gene expression (Foyer & Noctor 2005; Mullineaux et al. 2006). The Mehler reaction is considered the foremost source of H2O2in chloroplasts, and the rate of O2 photoreduction, leading to H2O2-generating superoxide, depends on environmental and stress conditions (Slesak et al. 2007). In TN-SR, this does not seem to be the case, as both plastidial SODs (FeSOD and CZSOD; Alscher et al. 2002) were not induced, nor was the H2O2scavenging mechanism.
However, H2O2 scavenging is fully operational in SAR as indicated by the activation of CAT, APX1 and APX3. L-AsA is a key antioxidant in the detoxification of ROS (Conklin & Loewus 2001), that eliminates H2O2through the ascorbate– glutathione (asc–glut) cycle. Glutathione (GSH) is a multi-functional metabolite in plants that also acts in cellular defence and protection, reacting with a range of ROS, and also detoxifying H2O2in the asc–glut cycle (Foyer & Noctor 2005).
When HS was applied with SAR, TR plants produced high amounts of H2O2 on SAR32u and SAR32d that cor-responded to high levels of chlorophyll, carotenoids and glutathione. ABA increased steadily with time, returning to basal levels at SAR25 and ascorbate amounts were highest on SAR42, decreasing thereafter. The levels of expression of the H2O2 scavengers APX1, APX3 and CAT, together the asc–glut cycle MDHAR and GOR2 were significantly increased in TR-SAR. Carotenoids protect the photosyn-thetic apparatus against photooxidative damage by quench-ing the triplet states of chlorophyll molecules (Koyama 1991) but also by acting as scavengers of ROS, protecting pigments and unsaturated fatty acids of lipids from oxida-tive damage (Edge et al. 1997). In TR-SAR, carotenoids seem to play an important role in the scavenging of ROS in parallel with that of ascorbate and glutathione, the usual first line of antioxidative defence in plants (Noctor & Foyer 1998). In TR-SAR and -SR, mitochondrial ROS production is evident, with high levels of MnSOD expression. The H2O2 thus produced can contribute to the cytosolic pool and there be scavenged by APX and the asc–glut cycle (Slesak et al. 2007). Also, as both CZSOD and FeSOD were induced to scavenge the O2− present in chloroplasts as a conse-quence of overreduction of the electron transport chain because of stress. The resulting H2O2 levels appear to be scavenged by the MDHAR–GOR2 branch of the asc–glut cycle.
In TN-SAR and –SR, only the mitochondrial SOD was activated, indicating a mitochondrial origin for most of the O2−in need of scavenging. As in TR, H2O2levels were tuned by the MDHAR–GOR2 branch of the asc–glut cycle and kept at levels that were far from dangerously high (Carvalho et al. 2006). In TN, the returning of antioxidative gene expres-sion to basal levels towards the end of acclimation was very evident, especially in SAR.
While TR showed stress-related metabolites in control conditions at concentrations that indicate ‘good health’, TN had high levels of total ascorbate but lower percentage reduction of both AsA and GSH, thus indicating some level of readiness to rapidly react to both stress conditions, as was in fact verified. In these conditions, TN reacted rapidly, sig-nificantly increasing reduction pools of AsA and GSH, without the need for de novo synthesis of either metabolites and thus being able to boost the buffering capacity of the cell’s redox pool. Conversely, upon the same stress, TR needed to synthesize both AsA and GSH and its response was slower and insufficient to maintain the redox pool at working levels. TR was also unable to keep the asc–glut pool in the reduced state, despite the high levels of expression of
CAT and APXs, thus rendering the cycle less effective in the task of ROS removal.
Although the experimental difference between treat-ments is the acclimation in SAR and the acute temperature rise in SR the most striking difference in the response of the plants takes place in the recovery period. Levels of pig-ments and cell redox state regained control levels 24 h after stress in SAR, while in SR, most of the values were still significantly altered at the corresponding moment. This pattern was similar in both varieties, indicating that when plants are subjected to acclimation, the response to stress is more intense and efficient and that, after the stress is no longer present, the return to basal metabolism occurs more rapidly.
Photosynthesis
Photosynthesis rates were not as significantly affected by the acclimation/recovery procedure as cell redox state, although other photosynthetic parameters point to different strategies of response to HS and to acclimation. In SAR, both varieties showed decreases in photosynthetic capacity during and after stress, and 24 h after stress LCP and gswere still significantly affected in TN, as well as the maximum quantum efficiency of PSII in light-adapted leaves (F′v/F′m) and the quantum effi-ciency of PSII photochemistry (Y). Nevertheless, the amount of light energy channelled for photosynthesis (qP) was back at control levels on both varieties. The typical LCP response to HS would be a significant increase (Berry & Björkman 1980). However, this only occurred in TN-SAR, and neither this increase nor the decrease of gs affected the photosyn-thetic rate, that kept the same levels as TR. An hypothesis for this unusual response can be that the sun-type behaviour of TN (Camejo et al. 2005) is the sole responsible for the high LCP values, and not a response to heat. In fact, gs only showed the typical response to heat in TR-SAR, slightly increasing at SAR32u and significantly decreasing when tem-perature exceeded 40 °C. This should influence photosynthe-sis, as it did in sweet orange, abruptly decreasing at temperatures above 40 °C (Ribeiro et al. 2006), but this was not the case in grapevine, where photosynthesis was slightly higher in TR than in TN on SAR42.
TR-SR had the same photosynthetic behaviour as TR-SAR, contrasting with TN, where Amax and LCP responded more efficiently during and after the recovery from stress. In theory, this should in fact be the expected behaviour, as the catalytic activity of Rubisco increases with temperature (Salvucci & Crafts-Brandner 2004). Usually under moderate HS (30–42 °C), the inhibition of photosyn-thesis is the responsibility of a slower regeneration of Ribulose-1,5-bisphosphate (RuBP), caused by disruption of electron transport activity (Salvucci & Crafts-Brandner 2004). Quantum yield of photosynthesis in fact decreased on SR42/35, recovering slightly on SR25.
Maximum quantum efficiency of PSII in dark-adapted leaves (Fv/Fm) suffered a significant decrease in both varieties on SR32, recovery by SR25 while the maximum quantum efficiency of PSII in light-adapted leaves (F′v/F′m) also
decreased on SR32, not as abruptly and only marginally recovered by SR25. Quantum efficiency of photosynthesis is known to decrease upon HS and to increase in the recovery period, while the thermal dissipation of excitation energy, measured by NPQ, follows the opposite trend (Wang et al. 2010). This pattern was clearly visible on SR while when acclimation to stress was added, there was a clear absence of this pattern, especially in TR where Y did not decrease sig-nificantly nor NPQ increase markedly. This indication of low-energy dissipation in the photosynthetic electron transport chain is in accordance with the levels of gene expression of SODs, which point to high levels of O2−removal in the mito-chondria instead of the chloroplast.
In maize subjected to temperatures above 41 °C for 20 min, there was permanent damage unless the plants had been previously acclimated (Sinsawat et al. 2004). In our case, the influence of the acclimation process affected photo-synthesis in the same manner as it had affected cellular redox state, although significant differences were measured between varieties, with TN less affected than TR, and recov-ering after 24 h.
Transcriptional signature of HS
The common and most typical element present upon HS is the expression of HSPs (Vierling 1991). Their typical expression signature is an up-regulation upon stress and during recovery. Interestingly, in grapevine’s response to HS (42 °C for 1 h), the only HSPs with altered levels of expression were nine sHSPs (three HSP20, one HSP23.6 and five HSP26) only three of which had significantly changed expression levels in TR (Sup-porting Information Fig. S1). sHSPs play structural roles in preserving the integrity of cell membranes during stress and are known to return to basal levels shortly after the end of the stress applied (Barua et al. 2003), as was the case in SAR in both varieties and as was the pattern of the similar VvHSF30 (Liu et al. 2012). Although there are no conclusive studies of SHSPs in acclimation-to-stress studies, their contrasting response in SAR and SR indicates that their chief assignment might be closely connected to acclimation and that their concerted response might be triggered by acclimation itself.
In both varieties the mitochondria-located HSP23.6 was the only exception to this clear pattern of up-regulation. In fact, in Triticum durum the level of mitochondrial HSP tran-scripts, namely HSP23.6, was found to be related to the ability to acquire thermotolerance (Rampino et al. 2009). Its response in TN is a further confirmation that this variety might not have been suffering from severe stress, neither in SAR nor in SR. The HSP20 family is known for a strong up-regulation in response to various biotic and abiotic stresses (Swindell et al. 2007), so the high levels of up-regulation of HSP17.9 in both varieties and treatments was not surprising, and had already been reported (Larkindale et al. 2005; Schramm et al. 2008; Coito et al. 2012). The mitochondria targeted HSP26.5 (Desikan et al. 2001; Wang et al. 2004) was more significantly up-regulated in TN, in synchrony with the antioxidative response taking part in that plastid.
A second transcriptional signature of HS is the shutdown of housekeeping metabolism (Larkindale & Vierling 2008), which was more evident in TR than in TN (Supporting Infor-mation Fig. S1 and Rocheta et al. unpublished data). This is an additional indication that TN may not be suffering from such a severe stress.
CONCLUSION
In Mediterranean climate regions, grapevine leaves can attain temperatures over 40 °C in hot summer days. However, these peak temperatures are achieved after a steady increase and gradual decrease thereafter. An experi-mental set up with and without acclimation to increasing temperature followed by recovery was applied to TN and TR grapevine varieties. The response to the experimental condi-tions was clearly different in the two varieties. TR had the need to synthesize AsA and GSH and its response was slow and insufficient to maintain the redox pool at working levels. TN reacted rapidly, increasing reduction pools of AsA and GSH, and boosting the buffering capacity of the cell’s redox pool. The excess amount of ROS produced came mostly from the mitochondria and not from an overflow of the photosyn-thetic electron transport chain, and thus photosynthesis was not significantly affected. As TR was more intensely affected by stress for a longer period of time, the levels of up-regulation of antioxidative stress genes was more signifi-cant and was kept throughout recovery.
When comparing HS with acclimation and recovery (SAR) and HS without acclimation (SR), the response of the antioxidative metabolism upon the imposition of stress was similar, but this pattern changed at the end of recovery. In fact, after 24 h of recovery at 25 °C, almost all the effects of stress had returned to basal levels when plants had been previously acclimated while almost all parameters remained altered if the plants had not been acclimated. It is thus clear that acclimation leads to a swifter and clearly to a shorter-term response that affects the plant to a much lesser extent than acute stress.
ACKNOWLEDGMENTS
This research was funded by the Fundação para a Ciência e Tecnologia (FCT) through project PTDC/AGR-GPL/ 099624/2008 that included a research grant to J.L.C.; SFRH/ BPD/85767/2012 to L.C., and CBAA Funding (PestOE/ AGR/UI0240/2011). This work also benefited from the European Project KBBE InnoVine (ref. 311775) and the European COST Action FA1106 ‘QualityFruit’.
REFERENCES
Alscher R.G., Erturk N. & Heath L.S. (2002) Role of superoxide dismutases (SODs) in controlling oxidative stress in plants. Journal of Experimental
Botany 53, 1331–1341.
Anderson M.D., Prasad T.K. & Stewart C.R. (1995) Changes in isozyme profiles of catalase, peroxidase and glutathione reductase during acclimation to chilling in mesocotyls of maize seedlings. Plant Physiology 109, 1247– 1257.
Barua D., Downs C. & Heckathorn S. (2003) Variation in chloroplast small heat-shock protein function is a major determinant of variation in thermotolerance of photosynthetic electron transport among ecotypes of
Chenopodium album. Functional Plant Biology 30, 1071–1079.
Berry J. & Björkman O. (1980) Photosynthetic response and adaptation to temperature in higher plants. Annual Review of Plant Physiology 31, 491– 543.
Bohnert H.J., Gong Q., Li P. & Ma S. (2006) Unraveling abiotic stress tolerance mechanisms – getting genomics going. Current Opinion in Plant Biology 9, 180–188.
Busch W., Wunderlich M. & Schöffl F. (2005) Identification of novel heat shock factor-dependent genes and biochemical pathways in Arabidopsis thaliana.
The Plant Journal 41, 1–14.
Camejo D., Rodríguez P., Morales M.A., Dell’Amico J.M., Torrecillas A. & Alarcón J.J. (2005) High temperature effects on photosynthetic activity of two tomato cultivars with different heat susceptibility. Journal of Plant
Physiology 162, 281–289.
Carvalho L.C., Vilela B.J., Vidigal P., Mullineaux P.M. & Amancio S. (2006) Activation of the ascorbate-glutathione cycle is an early response of micropropagated Vitis vinifera L. explants transferred to ex vitro.
Interna-tional Journal of Plant Sciences 167, 759–770.
Coito J.L., Rocheta M., Carvalho L.C. & Amâncio S. (2012) Microarray-based uncovering reference genes for quantitative real time PCR in grapevine under abiotic stress. BMC Research Notes 5, 220.
Conklin P.L. & Loewus F.A. (2001) Bbiosynthesis of ascorbic acid in plants: a renaissance. Annual Review of Plant Biology and Plant Molecular Biology 52, 437–467.
Costa J.M., Ortuño M.F., Lopes C.M. & Chaves M.M. (2012) Grapevine vari-eties exhibiting differences in stomatal response to water deficit. Functional
Plant Biology 39, 179–189.
Cramer G.R. (2010) Abiotic stress and plant responses from the whole vine to the genes. Australian Journal of Grape and Wine Research 16, 86–93. Creissen G., Firmin J., Fryer M., Kular B., Leyland N., Reynolds H., . . .
Mulineaux P. (1999) Elevated glutathione biosynthetic capacity in the chlo-roplasts of transgenic tobacco plants paradoxically causes increased oxida-tive stress. The Plant Cell 11, 1277–1291.
Demmig-Adams B. & Adams III W.W. (1992) Photoprotection and other responses of plants to high light stress. Annual Review of Plant Physiology
and Plant Molecular Biology 43, 599–626.
Desikan R., Mackerness S.A.H., Hancock J.T. & Neill S.J. (2001) Regulation of the Arabidopsis transcriptome by oxidative stress. Plant Physiology 127, 159–172.
Edge R., McGarvey D.J. & Truscott T.G. (1997) The carotenoids as anti-oxidants – a review. Journal of Photochemistry and Photobiology. B, Biology 41, 189–200.
Foyer C.H. & Noctor G. (2005) Redox homeostasis and antioxidant signaling: a metabolic interface between stress perception and physiological responses.
The Plant Cell 17, 1866–1875.
Frank G., Pressman E., Ophir R., Althan L., Shaked R., Freedman M., . . . Firon N. (2009) Transcriptional profiling of maturing tomato (Solanum
lycopersicum L.) microspores reveals the involvement of heat shock
pro-teins, ROS scavengers, hormones, and sugars in the heat stress response.
Journal of Experimental Botany 60, 3891–3908.
Ganea E. (2001) Chaperone-like activity of alpha-crystallin and other small heat shock proteins. Current Protein and Peptide Science 2, 205–225. Ghosh S. & Pugh B.F. (2011) Sequential recruitment of SAGA and TFIID in a
genomic response to DNA damage in Saccharomyces cerevisiae. Molecular
and Cellular Biology 31, 190–202.
Greer D.H., Weedon M.M. & Weston C. (2011) Reductions in biomass accu-mulation, photosynthesis in situ and net carbon balance are the costs of protecting Vitis vinifera ‘Semillon’ grapevines from heat stress with shade covering. AoB Plants 2011, plr023.
Hiscox J.D. & Israelstam G.F. (1979) A method for the extraction of chloro-phyll from leaf tissue without maceration. Canadian Journal of Botany 57, 1332–1334.
Hong S.W. & Vierling E. (2000) Mutants of Arabidopsis thaliana defective in the acquisition of tolerance to high temperature stress. Proceedings
of the National Academy of Sciences of the United States of America 97,
4392–4397.
Howell G.S. (2001) Sustainable grape productivity and the growth-yield rela-tionship: a review. American Journal of Enology and Viticulture 52, 165–174. Jenks M. & Hasegawa P. (2014) Plant Abiotic Stress, 2nd edn, Wiley-Blackwell,
Oxford. 336 pp.
Kotak S., Larkindale J., Lee U., von Koskull-Döring P., Vierling E. & Scharf K.-D. (2007) Complexity of the heat stress response in plants. Current
Opinion in Plant Biology 10, 310–316.
Koyama Y. (1991) New trends in photobiology: structures and functions of carotenoids in photosynthetic systems. Journal of Photochemistry and
Photobiology. B, Biology 9, 265–280.
Larkindale J. & Knight M.R. (2002) Protection against heat stress-induced oxidative damage in arabidopsis involves calcium, abscisic acid, ethylene, and salicylic acid. Plant Physiology 128, 682–695.
Larkindale J. & Vierling E. (2008) Core genome responses involved in accli-mation to high temperature. Plant Physiology 146, 748–761.
Larkindale J., Hall J.D., Knight M.R. & Vierling E. (2005) Heat stress pheno-types of Arabidopsis mutants implicate multiple signaling pathways in the acquisition. Plant Physiology 138, 882–897.
Lee U., Wie C., Escobar M., Williams B., Hong S.-W. & Vierling E. (2005) Genetic analysis reveals domain interactions of Arabidopsis HSP100/ClpB and cooperation with the small heat shock protein chaperone system. The
Plant Cell 17, 559–571.
Liu G.-T., Wang J.-F., Cramer G., Dai Z.-W., Duan W., Xu H.-G., . . . Li S.-H. (2012) Transcriptomic analysis of grape (Vitis vinifera L.) leaves during and after recovery from heat stress. BMC Plant Biology 12, 174.
Livak K.J. & Schmittgen T.D. (2001) Analysis of relative gene expression data using real-time quantitative PCR and the 2(−Delta Delta C(T)method. Methods 25, 402–408.
Mullineaux P.M., Karpinski S. & Baker N.R. (2006) Spatial dependence for hydrogen peroxide-directed signaling in light-stressed plants. Plant
Physiol-ogy 141, 346–350.
Noctor G. & Foyer C.H. (1998) Ascorbate and glutathione: keeping active oxygen under control. Annual Review of Plant Physiology and Plant
Molecular Biology 49, 249–279.
Okamura M. (1980) An improved method for determination of L-ascorbic acid and L-dehydroascorbic acid in blood plasma. Clinica Chimica Acta 103, 259–268.
Porra R.J., Thompson W.A. & Kriedemann P.E. (1989) Determination of accu-rate extinction coefficients and simultaneous equations for assaying chloro-phylls a and b extracted with four different solvents: verification of the concentration of chlorophyll standards by atomic absorption spectrometry.
Biochimica et Biophysica Acta 975, 384–394.
Rampino P., Mita G., Pataleo S., De Pascali M., Di Fonzo N. & Perrotta C. (2009) Acquisition of thermotolerance and HSP gene expression in durum wheat (Triticum durum Desf.) cultivars. Environmental and Experimental
Botany 66, 257–264.
Ribeiro R.V., Machado E.C. & Oliveira R.F. (2006) Photosynthesis and its interaction with light intensity in sweet orange leaf discs under non-photorespiratory condition. Ciência e Agrotecnologia 30, 670–678. Richardson A.D., Duigan S.P. & Berlyn G.P. (2002) An evaluation of
nonin-vasive methods to estimate foliar chlorophyll content. New Phytologist 153, 185–194.
Rizhsky L., Liang H., Shuman J., Shulaev V., Davletova S. & Mittler R. (2004) When defense pathways collide: the response of Arabidopsis to a combina-tion of drought and heat stress. Plant Physiology 134, 1–14.
Rocheta M., Becker J.D., Coito J.L., Carvalho L.C. & Amâncio S. (2014) Heat and water stress induce unique transcriptional signatures of heat-shock pro-teins and transcription factors in grapevine. Functional & Integrative
Genomics 14, 135–148.
Salvucci M.E. & Crafts-Brandner S.J. (2004) Inhibition of photosynthesis by heat stress: the activation state of Rubisco as a limiting factor in photosyn-thesis. Physiologia Plantarum 120, 179–186.
Schramm F., Larkindale J., Kiehlmann E., Ganguli A., Englich G., Vierling E. & von Koskull-Döring P. (2008) A cascade of transcription factor DREB2A and heat stress transcription factor HSFA3 regulates the heat stress response of Arabidopsis. The Plant Journal 53, 264–274.
Sinsawat V., Leipner J., Stamp P. & Fracheboud Y. (2004) Effect of heat stress on the photosynthetic apparatus in maize (Zea mays L.) grown at control or high temperature. Environmental and Experimental Botany 52, 123–129.
Slesak I., Libik M., Karpinska B., Karpinski S. & Miszalski Z. (2007) The role of hydrogen peroxide in regulation of plant metabolism and cellular signal-ling in response to environmental stresses. Acta Biochimica Polonica 54, 39–50.
Sun W., Van Montagu M. & Verbruggen N. (2002) Small heat shock proteins and stress tolerance in plants. Biochimica et Biophysica Acta 1577, 1–9. Swindell W.R., Huebner M. & Weber A.P. (2007) Transcriptional profiling of
Arabidopsis heat shock proteins and transcription factors reveals extensive overlap between heat and non-heat stress response pathways. BMC
Genomics 8, 125.
Valliyodan B. & Nguyen H.T. (2006) Understanding regulatory networks and engineering for enhanced drought tolerance in plants. Current Opinion in
Plant Biology 9, 189–195.
Vierling E. (1991) The role of heat shock proteins in plants. Annual Review of
Plant Physiology and Plant Molecular Biology 42, 579–620.
Vilela B.J., Carvalho L.C., Ferreira J. & Amâncio S. (2007) Gain of function of stomatal movements in rooting Vitis vinifera L. plants: regulation by H2O2is independent of ABA before the protruding of roots. Plant Cell Reports 26, 2149–2157.
Vinocur B. & Altman A. (2005) Recent advances in engineering plant toler-ance to abiotic stress: achievements and limitations. Current Opinion in
Biotechnology 16, 123–132.
Wahid A., Gelani S., Ashraf M. & Foolad M. (2007) Heat tolerance in plants: an overview. Environmental and Experimental Botany 61, 199–223. Wang L.-J., Fan L., Loescher W., Duan W., Liu G.-J., Cheng J.-S., . . . Li S.-H.
(2010) Salicylic acid alleviates decreases in photosynthesis under heat stress and accelerates recovery in grapevine leaves. BMC Plant Biology 10, 34. Wang W., Vinocur B. & Altman A. (2003) Plant responses to drought, salinity
and extreme temperatures: towards genetic engineering for stress tolerance.
Planta 218, 1–14.
Wang W., Vinocur B., Shoseyov O. & Altman A. (2004) Role of plant heat-shock proteins and molecular chaperones in the abiotic stress response.
Trends in Plant Science 9, 244–252.
Waters E.R., Lee G.J. & Vierling E. (1996) Evolution, structure and function of the small heat shock proteins in plants. Journal of Experimental Botany 47, 325–338.
Received 1 April 2014; received in revised form 29 August 2014; accepted 2 September 2014
SUPPORTING INFORMATION
Additional Supporting Information may be found in the online version of this article at the publisher’s web-site:
Figure S1. Relative gene expression ratios obtained by
RT-qPCR in TN and TR in the treatments SAR and SR of the five most up-regulated and the five most down-regulated transcripts obtained with the 23 K custom-made Affymetrix Vitis GeneChip after acute heat stress (1 h at 42 °C).
Table S1. Leaf temperature (°C) measured along the light
response curves in SAR and SR in leaves of Trincadeira and Touriga Nacional. Each column corresponds to measure-ments taken in the six replicate plants of each time point. Different number of temperature values result from auto-matic reads at different time intervals (ranging from five to 10 readings per minute). The images represent the average leaf temperatures in SAR and SR of both varieties.