ISSN 1800-6450
António Duarte
Santos
1Nelson Tavares da
Silva
Guilherme Castela
Article info: Received 15.06.2019 Accepted 05.09.2019 UDC – 330.341 DOI – 10.24874/IJQR13.04-10A COSTATIS APPROACH TO BUSINESS
SUSTAINABILITY IN TURBULENT
ENVIRONMENTS FROM 2008 TO 2014
Abstract: European countries continue to differ considerably
from one another economically, not only in economic growth assessed by GDP growth rates but also in their companies’ population by Economic Activities. Nonetheless these regular differences, the occurrence of crisis and other economic events can promote economic turbulence conducing to different responses, conditioned by each country’s specificities. The occurrence of the 2008 financial crisis, the subsequent economic and sovereign debt crisis introduced additional factors of turbulence in the business sustainability of the European (EU) companies. This research, supported by the COSTATIS method, analyses the co-structure and measures the discrepancy between the population of EU companies for each NACE and the GDP components in their dynamics from 2008 to 2014. The results detected greater discrepancies between the population of companies and the stability of economic growth for a subset of EU countries with particularities regarding their NACE and GDP components.
Keywords: European Companies; Economic Growth; Business
Sustainability; Turbulence; COSTATIS.
1. Introduction
In the context of turbulence, for a population of firms, is frequently assumed that entries, exits and the turnover in the stock of firms are not only symptoms of economic evolution but also that aspects of market dynamics are somehow related to growth processes (Fritsch, 1996). Nonetheless, results of recent research suggest a lack of clarity regarding the relationship between the level of new firm formation and economic growth (Bosma et al., 2011). In some cases, this could be attributed to longtime lags that are needed for the main effects of the new firm formation to become evident (Fritsch & Mueller, 2004). The financial crisis of 2007 and 2008 followed by a global credit crunch and a banking crisis after Lehman Brothers
bankruptcy had its consequences on European countries (Shiller & Quinn, 2008). From 2008 onwards, additional factors of turbulence have been introduced in the business sustainability of the European (EU) companies. This situation affected the stability of GDP growth and on the diversity of the companies that populate each economic activity. The global crises conducted, highlighting the pre-existing conditions, to an euro area sovereign debt crisis in which the financial markets lost confidence in the ability of governments in some of these countries to comply with their debt obligations, which led to some EU countries requiring financial assistance and suffering severe effects of imposed austerity (Wallace et al., 2015).
In this sense, identifying the factors that characterise the behaviour of the economies, through the analysis of the evolving population of companies by Economic Activities (NACE), and its relation with GDP components, is fundamental in the study of the economic dynamics. Historically, Economic Activities and GDP are distributed heterogeneously by economic spaces. Within the European Union (EU) this heterogeneity encompasses a space-time dimension that directly or indirectly influences the growth of economies, both in periods of stability and in periods of change. In this sense, the occurrence of a crisis like this can affect the performance of countries regarding economic growth and the companies that populate each Economic Activity. This research supported by the COSTATIS method (Thioulouse, 2011), a multivariate symmetric exploratory model, analyses the co-structure and measures the discrepancy between the population of EU companies for each NACE and the GDP components in their dynamics from 2008 to 2014. Thus, the following specific goals are proposed:
• Study the stability and relations between the population of companies by Economic Activities and the GDP component evolution for sixteen EU countries detecting discrepancies, gaps, and inconsistencies in the relations and influences between this two data sources;
• Identify the co-inertia and stability relations of EU countries and the specificities of their behavioural evolution through the different phases of the crisis period;
• Contribute, using the COSTATIS method, to the elaboration of a more detailed diagnosis of the situation. This paper is structured into five chapters. The first chapter, Introduction, contextualizes the research and its main goals; the second chapter, Literature Review, synthesizes previous frameworks on heterogeneity of economic growth, turbulence and the
economic activities within EU countries and the occurrence of crisis; the third Chapter, Methodology, describes the methodological approach, the variables, and observations; the fourth Chapter, Results and Discussion, presents the main outputs and specific insights arising from the analysis and, finally, the fifth Chapter, Conclusions, where the main findings are presented.
2. European Companies and
Economic Growth
Economic growth is measured by the increase in the market value of the goods and services produced by an economy, conventionally per year. The GDP growth rate is widely used to measure the economic performance of a country between periods and supports the evaluation of economic policies and limits if an economy is in recession. An increase in growth can be generated by more efficient use of inputs or by increasing inputs such as capital, population, and even territory. The international standard for measuring GDP was defined in the book System of National Accounts of 1993, created by the International Monetary Fund, European Union, Organization for Economic Co-operation and Development, United Nations, and World Bank. In this approach of GDP, final expenditures are expenditures on goods and services purchased for final use, that is, for final consumption or gross capital formation. Final consumption consists of goods and services used by individual households or the community to satisfy their individual collective households and general government. Gross Capital Formation (GCF) comprises gross fixed capital formation, change in inventories and acquisitions less disposals of valuables. Gross capital formation expenditures are incurred by resident producers of goods and services, incorporated enterprises, unincorporated enterprises, general government and non-profit institutions. Final expenditures do not include expenditures on intermediate consumption (OECD, 2012), that is, the
goods and services, other than fixed assets, which are used or consumed as inputs by a production process.
The EU single market with 28 countries is a major trading power worldwide and the EU economy, from a perspective of the total value of goods and services produced (GDP), is larger than the US economy totalizing 15 326 billion euros in 2017. The EU trade with the rest of the world comprehends approximately 15.6% of world exports and imports, and more than 64% of EU trade takes place within the EU (European Union [EU], 2018).
The heterogeneity of economic growth and development encompasses a space-time dimension that directly or indirectly influences the growth within the European Union (EU) economies, both in periods of stability and in periods of change (Santos et al., 2017). In the history of EU economics, economic growth has been thought of as a critical factor in Eu convergence. Nonetheless, European countries continue to differ considerably from one another economically, not only in economic growth assessed by GDP growth rates but also in their population of companies by Economic Activities (EUROSTAT, 2018). Frankel and Rose (1998) emphasised on the substantial historical evidence that countries with closer trade relations are more likely to have correlated business cycles and the cyclical changes of macroeconomic factors influence the number of new firms (Parker 2012; Koellinger & Thurik 2012). According to Abdesselam et al. (2017), the economic performance of countries depends on their level of development and the trajectory of economies conditioned by their institutional system. Recent research suggests a lack of clarity regarding the relationship between the level of new firm formation and economic growth (Bosma et al., 2011) as many positive and negative factors can influence the formation of new firms, like foreign direct investments, supports within the European Union, and the economic culture of countries.
The financial crisis of 2007 and 2008, followed by a global credit crunch and a banking crisis, had a significant impact on the European countries (Shiller & Quinn, 2008). From 2008 onward, the crisis introduced additional factors of turbulence in the business sustainability of the European (EU) companies and produced significant losses of economic activity on many countries (Dijkstra et al., 2015). This situation is in line with the greater variability regarding GDP growth and, therefore, less stability on EU economic growth (Santos et al., 2017). This situation had its toll on the stability of GDP growth, on the diversity of the companies that populate each economic activity and highlighted the pre-existing conditions. Some EU countries required financial assistance and had severe effects from the following imposed austerity (Wallace et al., 2015). Previous economic research before the crisis offered a variety of historical evidence that convergence had occurred, especially on average incomes (Siljak, 2015; Dvoroková, 2014; Marques & Soukiazis, 1998) but more recent research (Caputo & Forte, 2015; Strielkowski & Höschle, 2015) indicates that the global financial crisis of 2008 stopped this convergence and led to some divergence. The occurrence of a crisis like this one affected the economic performance of countries (Santos et al., 2017). Ferreiro et al. (2017) emphasised that the global financial crisis increased the divergence in many macroeconomic outcomes, generating the risk of a higher heterogeneity if the crisis makes structural the underperformance of growth documented in many countries.
In 2015, the EU-28’s business economy encompassed more than 26 million active enterprises, with the most significant active enterprise population in Italy (3.8 million), followed by France (3.5 million), Spain (3.0 million), Germany (2.8 million) and the United Kingdom (2.3 million). The services sector had the highest proportion of active enterprises in every country (EUROSTAT, 2018), accounting for 75.8%, and provided work for 67.7% of the total number of persons
employed. On the other side, industry accounted only 9.8% of active enterprises in the EU nonetheless these enterprises provided work for 23.5% of the total number of persons employed, being the average size of industrial enterprises (regarding the number of persons employed) considerably higher than for services (EU, 2018).
According to the European Commission (European Commission, 2017) in 2016 the industry was the largest economic activity in the EU regarding output generated accounting for 19.4% of EU total gross value added (GVA), ahead of the economic activities "Wholesale and retail trade, transport, accommodation and food services" (19.0%) and Public administration, defense, education, human health and social work activities (18.8%). Real estate activities (11.4%) and Professional, scientific and technical activities (11.0%) also accounted for a relevant share of EU total gross value added.
Nonetheless the evolution of shares of these economic activities have had diverging trends from 1996 to 2016 (European Commission, 2017) for instance the percentage of gross value added that has generated grew in "Professional, scientific and technical activities" (+2.3 percentage points – pp), "Information and communication" and "Real estate activities" (both +0.9 pp) as well as in "Public administration, defence, education, human health and social work activities" (+0.8 pp). "Wholesale and retail trade, transport, accommodation and food services" remained fairly stable at around 19%. The share of industry decreased significantly (-3.5 pp) as well as agriculture, forestry and fishing (by -1.1 pp).
For a population of firms is frequently assumed that entries, exits and the turnover in the stock of firms are not only symptoms of economic evolution but that these aspects of market dynamics are somehow related to growth processes subjacent to the concept of turbulence (Fritsch, 1996), and the existing socioeconomic environment can create an
adequate or inadequate background for businesses. In this sense, Fritsch (1996) stated that “a positive relationship between turbulence and economic development can be assumed from the perspective of creative destruction as well as when applying a ‘survival-of-the-fittest’ argument.” Regional growth is, therefore, a complex process that involves large numbers of start-ups in diverse industries, firms exit, and growing and declining incumbent firms (Fritsch, 2013). In this sense, new business formation and the market process encompasses (1) Start-ups or market entries, (2) Market process (selection), which includes (2.1) New capacities (direct effect): Development of new businesses, and (2.2) Exiting capacities (indirect effect): Decline or closure of incumbents, the supply-side effects (indirect), include securing efficiency, acceleration of structural change, amplified innovation, greater variety, conducing to improved competitiveness and growth. According to Colombelli et al. (2016), many sectors are characterized by a fringe of firms operating at a sub-optimal scale where the likelihood of survival is unusually low and where firms are continuously entering and exiting the market. For Santarelli and Vivarelli (2006), entry and exit rates are positively and significantly correlated and market disturbing is taken as a “standard” feature of industrial dynamics cross different sectors and countries. The existing socioeconomic environment of the EU an each of its members can promote a background more or less prone for businesses in determined economic activities (Fritsch, 1996). The occurrence of the global crisis (Caputo & Forte, 2015; Strielkowski & Höschle, 2015) can stop convergence and lead to some divergence affecting the economic performance of countries (Santos et al., 2017) making them underperform. The timeframe for better evidence of the relationship between the level of new firm formation and economic growth can involve longtime lags (Fritsch and Mueller, 2004). This relationship between the business formation and economic development can be
of an indirect nature, and very few studies use GDP-based indicators (Fritsch, 2012) to clarify this problematic.
3. Methodological Approach
This research intends, supported by the COSTATIS method (Thioulouse, 2011) a multivariate symmetric exploratory model, to analyse the co-structure and measures the discrepancy between the population of EU companies for each NACE and the GDP components in their dynamics from 2008 to 2014. For this purpose, the connections between two data structures were analysed: one with GDP component descriptors for Economic Growth; the other with the population of firms by economic activities. In a first stage the Co-Inertia Analysis (Doledec & Chessel, 1994; Dray et al., 2003) couples existing information between two data matrices. On a second stage the Partial Triadic Analysis (Thioulouse & Chessel, 1987; Kroonenberg, 1989; Thioulouse, 2011) explores the relationships between existing information in a series of data matrices, assessing the stability or diversity of structures in all the matrices. In this way COSTATIS benefits from the advantages of the two methods, analysing the stability or
diversity for each of the two sources of information in different times, spaces or occasions through the Partial Triadic Analysis (PTA) and measuring the differences or similarities between the two sources of information economic growth and population of firms by economic activities through the Co-Inertia Analysis (COIA), for the fifteen EU countries under analysis.
3.1. The experimental data
The data used in this research was collected from EUROSTAT databases a) GDP and main components (output, expenditure and
income) [nama_10_gdp]; b) Business
demography by size class (from 2004 onwards, NACE Rev. 2) [bd_9bd_sz_cl_r2]. The research, using the COSTATIS method (Thioulouse, 2011), encompassed five gross domestic product (GDP) components with direct implications on economic activities (NACE) reflecting on the population of companies from fifteen EU countries from 2008-2014.
3.1.1. The EU countries
The study was conducted with observations from fifteen EU countries, for the period 2008-2014 (Figure 1). AT Austria LT Lithuania BE Belgium LU Luxembourg CY Cyprus LV Latvia DE Germany NL Netherlands EE Estonia PT Portugal ES Spain SI Slovenia FI Finland SK Slovakia IT Italy Figure 1. 15 EU countries (2008-2014)
3.1.2. The economic activities
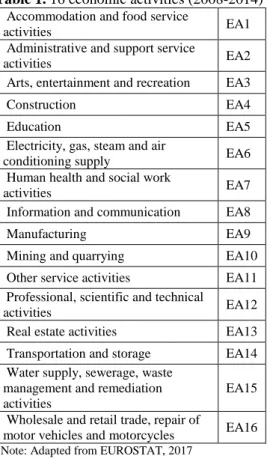
The NACE is a four-digit classification framework for collecting and presenting statistical data according to economic activity in the fields of economic statistics (EUROSTAT, 2017). The active enterprises in the business economy provide a general overview of the business enterprise population according to the NACE. The active population of enterprises according to statistical classification of economic activities in the European Community (NACE) was sampled from 2008 to 2014 for 15 EU members. Data was collected from EUROSTAT database. A total of 16 economic activities of NACE was used. The NACE used in this research are presented in Table 1.
Table 1. 16 economic activities (2008-2014)
Accommodation and food service
activities EA1
Administrative and support service
activities EA2
Arts, entertainment and recreation EA3
Construction EA4
Education EA5
Electricity, gas, steam and air
conditioning supply EA6
Human health and social work
activities EA7
Information and communication EA8
Manufacturing EA9
Mining and quarrying EA10 Other service activities EA11 Professional, scientific and technical
activities EA12
Real estate activities EA13 Transportation and storage EA14 Water supply, sewerage, waste
management and remediation activities
EA15 Wholesale and retail trade, repair of
motor vehicles and motorcycles EA16 *Note: Adapted from EUROSTAT, 2017
The economic activities covered by these indicators are NACE Rev. 2 from sections B to N, voluntarily sections P to S, and excluding management activities of holding companies. Activities relating to industry, construction, distributive trades, and services are covered, but agriculture, public administration, non-market activities of households, and extra-territorial agencies are not. These indicators include market-oriented legal forms but exclude units in the central and local government sectors (EUROSTAT, 2018).
3.1.3. The Gross Domestic Product Components
From an expenditure-based perspective, GDP is total final expenditures at purchasers’ prices (Commission of the European Communities-Eurostat et al., 1994). In the system of national accounts, only households, Non-Profit Institutions Serving Households (NPISH) and governments have final consumption, whereas corporations have intermediate consumption (EUROSTAT, 2017).
The five components of GDP are presented in Table 2.
Table 2. Five GDP components (2008-2014)
Final Consumption Expenditure of
General Government FCEGG
Household and NPISH Final
Consumption Expenditure HNFCE Gross Fixed Capital Formation +
Changes in Inventories GFCFCI Exports of Goods and Services EGS Imports of Goods and Services IGS
*Note: Adapted from EUROSTAT, 2017 Regarding the GDP components and related indicators of economic output, imports and exports, domestic private and public consumption and investments, can give valuable insights into the driving forces in an economy and thus be the basis for the design, monitoring and evaluation of specific EU policies (EUROSTAT, 2017).
3.2. The COSTATIS Method
COSTATIS (Thioulouse, 2011) is an exploratory method of three-way multivariate data analysis methodology for analysing the relationships between the structures of two sets of data matrices as a whole. For this, it uses data coupling processes such as those used in the Analysis of Canonical Correspondence, Redundancy Analysis or Co-Inertia Analysis (Dolédec and Chessel, 1994; Dray et al., 2003). In addition to providing convenient ways of extracting and summarising the main characteristics of the structures of two series of data matrices, the method provides information about the stability or diversity in the structures common to all matrices of the data series, where the repetitions may correspond to space, time, or experimental situations. The COSTATIS is
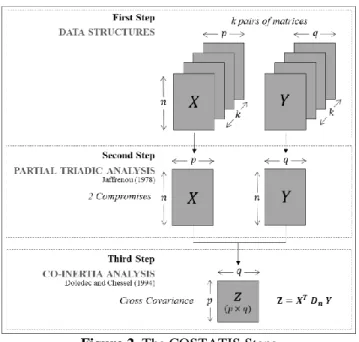
based on two methods of multivariate data analysis: Co-Inertia Analysis (COIA: Dolédec and Chessel, 1994; Dray et al., 2003) and Partial Triadic Analysis (PTA: Thioulouse & Chessel, 1987; Kroonenberg, 1989; Thioulouse, 2011). In fact, COSTATIS benefits from the advantages of PTA and COIA for it adds the possibility of analysing the stability or diversity between two sources of information (from different time horizons or conditions) through the PTA, with the measuring the differences or similarities between these two sources of information, through of the COIA. We show how the outputs of the COSTATIS method can be used to interpret the relationships between the companies of different economic actives distribution and economic growth parameters. The implementation of COSTATIS is described in Figure 2.
Figure 2. The COSTATIS Steps *Note: Adapted from Thioulouse, 2011 In summary, the three steps of COSTATIS
are 1): is to prepare two three-dimensional data structures (e) individually. In other words, a subsequent simultaneous analysis of two table sequences, with the same or variables for all replicates and with the same
individuals in both sets of data, is prepared; 2) consists of using two PTAs simultaneously to calculate two matrices compromises, relative to (e). In other words, the stability or diversity between the two sources of information is analysed; 3) finally, the two compromises are
"coupled" using a COIA that provides an average image of the existing co-structure. That is, through the cross-covariance matrix, it becomes possible to analyse the relationships between these two compromises to measure the differences or similarities in stability/diversity, previously detected, in the two sources of information.
4. Results and discussion
For the structure of the databases and the period 2008-2014, two "data cubes" were created. A three-way structure with the number of companies in each of the economic activities and a second three-way structure with the information for the GDP components at current prices measured in millions EUR.
All the results were obtained from ADE4 Package for R-program (Dray & Dufour, 2007; R Development Core Team, 2008) which provided the advanced computation and graphical display necessary to implement the necessary methodologic approach to our two “data cubes”.
4.1 Results
The representation in factorial planes of the compromise matrices allows the characterization of common structures during the stability and / or instability detected from 2008 to 2014. The Euclidean representation of the compromise on the descriptors of economic activities can be observed in Figure 3.
Figure 3. Economic activities
*Note: Adapted from ADE4 outputs
Relatively to ec
onomic activities, twopatterns were detected.
Pattern 1: on the axis of maximum inertia
(2nd quadrant), formed by eight economic activities: Arts, entertainment and recreation (EA3), Electricity, gas, steam and air conditioning supply (EA6), Information and communication (EA8), Other service activities (EA11), Water supply, sewerage, waste management and remediation activities
(EA15), Real estate activities (EA13), Human health and social work activities (EA7), and designated by Less Turbulent Economic Activities. For the compromise analysis of the PTA, these are the economic activities with the highest contribution except EA5. Nevertheless, this pattern reveals greater stability linked to economic activities mostly associated with the provision of services with higher levels of technology and innovation.
Pattern 2: associated with the axis of least
inertia (3rd quadrant), also consisting of eight economic activities: Administrative and support service activities (EA2), Professional, scientific and technical activities (EA12), Accommodation and food service activities (EA1), Construction (EA4), Mining and quarrying (EA10), Manufacturing (EA9), Transportation and storage (EA14) and Wholesale and retail trade, repair of motor vehicles and motorcycles (EA16), and called More Turbulent Economic Activities. For the
compromise analysis of the PTA, these are the economic activities with the lowest contribution. In this case, this pattern presents less stability linked to economic activities mostly associated with the provision of services of lower technological and innovation rates.
Regarding economic growth, the Euclidean representation of the compromise on the GDP components is shown in Figure 4.
Figure 4. GDP components
*Note: Adapted from ADE4 outputs The compromise on the GDP components
identifies two patterns.
Pattern 1: on the axis of maximum inertia
(2nd quadrant), formed by 2 GDP components: Exports of Goods and Services (EGS) and Imports of Goods and Services (IGS), and designated by Trade Balance. These are the GDP components with the lowest contribution to the compromise.
Pattern 2: associated with the axis of least
inertia (3rd quadrant), consisting of 3 GDP components: Final Consumption Expenditure of General Government (FCEGG), Gross Fixed Capital Formation + Changes in Inventories (GFCFCI), and Household and NPISH Final Consumption Expenditure
(HNFCE), and called Domestic Demand. These are the GDP components with the highest contribution to the compromise. At this point it is possible to interrelate the economic growth with the economic activities, namely associating the patterns detected in the Figures 3 and 4. In other words, the Trade Balance is, on average, more stable and is connected to economic activities mostly with higher levels of technology and innovation and the Domestic Demand is, on average, less stable and is linked to economic activities with lower technological and innovation rates. These two realities, to a certain extent, briefly describe the turbulence observed in the number of companies that
populate each of the fifteen EU countries, from the perspective of economic activities and the economic growth influence, from the perspective of the GDP components.
Moreover, in this thread, Figure 5 shows the interrelationship detected during the 2008-2014 period.
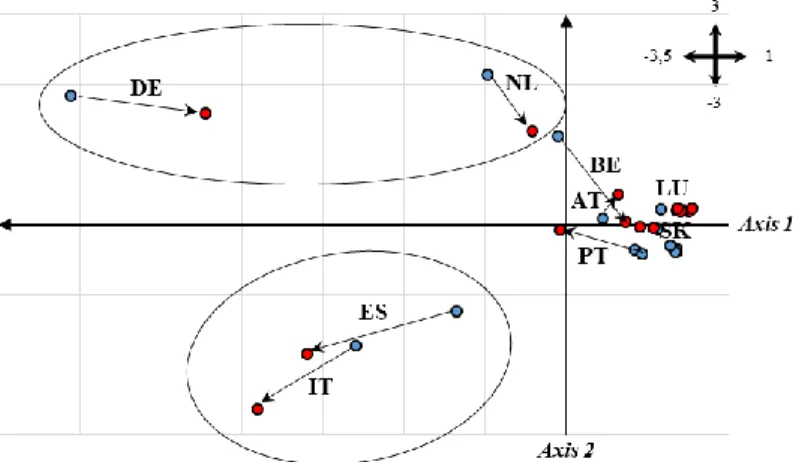
Figure 5. Relationship between Economic Activities and GDP Components (2008-2014)
*Note: Adapted from ADE4 outputs The tip of the arrow (blue) is the country
Enterprise by Economic Activities (NACE) representation, and the end of the arrow (red) is the GDP components representation. Also, in Figure 5 the largest the arrows the more significant are the discrepancies or minor influences (e.g., Belgium - BE and Spain - ES). The smallest arrows, where the tip and the end are almost superimposed, indicates stronger influences and, necessarily, fewer discrepancies (e.g., Slovakia - SK and Luxembourg - LU). Nevertheless, two patterns are also detected here.
Pattern 1: formed by 2 EU countries:
Germany (DE) and the Netherlands (NL) with the Less Turbulent Economic Activities and related to Trade Balance. Maybe the stability associated with economic growth in these two economies is due to the influence on the Trade balance (same quadrant positioning in Figure 4) through the development of economic activities with higher levels of technology and innovation (same quadrant positioning in Figure 3).
Pattern 2: also formed by 2 EU countries:
Spain (ES) and Italy (IT) with More Turbulent Economic Activities and related
Domestic Demand. Perhaps the instability associated with economic growth in these two economies is due to the influence on the Domestic Demand (same quadrant positioning in Figure 4) through to the development of economic activities with lower levels of technology and innovation (same quadrant positioning in Figure 3). Finally, in Figure 6, are highlighted the discrepancies between the number of companies for economic activities and economic growth for all the fifteen EU countries.
The Figure 4.4 confirms that Slovakia (SK) and Luxembourg (LU) have strong alignment between economic activities and GDP components behaviour, being, therefore, less discrepant in opposition to Spain (ES) and Belgium (BE). In other words, Slovakia and Luxembourg presented, in the period between 2008 and 2014, a more consistent behaviour between economic turbulence and economic growth. On the contrary, Spain and Belgium presented, in the same period, a less consistent behaviour between economic turbulence and economic growth.
Figure 6. Discrepancies between the number
of companies for economic activities and economic growth
4.2. Discussion
For the period between 2008 and 2014, the results obtained pointed to different business realities among the fifteen countries of the euro zone studied here. In fact, the relationship between economic turbulence and the GDP outputs evidences several behavioural patterns in terms of greater or lesser consistency in the economic growth. For example, Germany and the Netherlands show some stability in their economic growth derived from the lower changeability (less turbulence) in economic activities with higher levels of technology and innovation whose productions are associated with relations with the outside world (the Trade Balance). On the other hand, Spain and Italy exposed some instability in their economic growth resulting from the greater variability (more turbulence) in economic activities with lower levels of technology and innovation whose productions are associated with relations with the domestic economy (the Domestic Demand).
The empirical evidences, from the research results, are aligned with the previous
identified aspects of market dynamics somehow related to economic growth processes (Fritsch, 1996). By encompassing the timeframe of 2008 to 2016, translated what actually occurred during the financial and economic crisis period with intensifying competition in the EU market and the effects a post-crisis environment on the EU economies with some divergence in the fashion of what was stated by Caputo and Forte (2015), Strielkowski and Höschle (2015), Ferreiro et al. (2017). Nonetheless the responses of the sixteen EU countries, concerning the firm behaviour on the various economic activities and their linkage with the GDP components had interesting specificities that allowed a richer characterization and representation of the EU business sustainability in turbulent environments.
5. Conclusions
The results previously analysed and discussed corroborate with what actually occurred during the period under analysis. In recent years, with intensifying competition in the EU market and the effects of the transition from a pre-crisis to a post-crisis environment of many economies has not been either smooth or stable. In fact, the rapid deterioration of some economic activities forced the companies, depending on the degree of innovation and technology available to them, to implement alternative strategies to help them survive and grow and, in this sense, the option for relations with the outside world or the domestic economy was real. It is now possible to produce the main conclusions from this research:
1) The economic activities on which the enterprises had larger or smaller turbulence, where characterised and summarised, identifying groups of activities more affected by the financial and economic crisis. 2) The connection between economic
turbulence and the GDP evidences different managerial patterns in
terms of greater or lesser consistency in the economic growth.
3) The economic growth relation of GDP with turbulence and EU countries was clarified, allowing for a gradient creation from trade balance, especially for Germany (DE) and the Netherlands (NL), to domestic demand positioning, especially for Spain (ES) and Italy (IT).
4) The influences and discrepancies of GDP components on the population of enterprises on economic activities for EU countries where detected and highlighted.
5) It was also possible to identify the countries where their enterprise's
population are more or less sensible [Luxembourg (LU) and Slovakia (SK) versus Belgium (BE) and Spain (ES)] to the economic growth evolution.
6)
The COSTATIS method allowed the elaboration of a more detailed diagnosis of the analyzed reality and to present a different perspective using currently available EUROSTAT data, highlighting the stable structures of each data cube from 2008 to 2014 (1st for population of active enterprises and 2nd for GDP component) and the co-structure between these two data cubes.References
:
Abdesselam, R., Bonnet, J., Renou-Maissant, P., & Aubry, M. (2017). Entrepreneurship, economic development, and institutional environment: evidence from OECD countries. Journal of International Entrepreneurship, 15(4), 1-43.
Bosma, N., Stam, E., & Schutjens, V. (2011). Creative destruction and regional productivity growth: Evidence from the Dutch manufacturing and services industries. Small Business Economics, 36(4), 401-418.
Caputo, M., & Forte, F. (2015). Difficult Convergence among the Five Main European Union Countries and the Crisis of the Euro Area. Atlantic Economic Journal, 43(4), 416-430. Colombelli, A., Krafft, J., & Vivarelli, M. (2016). Entrepreneurship and innovation: New
entries, survival, growth (No. 2016-04). Groupe de Recherche en Droit, Economie, Gestion (GREDEG CNRS), University of Nice Sophia Antipolis, 1-38. Retrieved from https://econpapers.repec.org/paper/grewpaper/2016-04.htm
Commission of the European Communities & Inter-Secretariat Working Group on National Accounts (1994). System of national accounts 1993 (Vol. 2). International Monetary Fund. Dijkstra, L., Garcilazo, E., & McCann, P. (2015). The effects of the global financial crisis on
European regions and cities. Journal of Economic Geography, 15(5), 935-949.
Doledec, S., & Chesssel, D. (1994). Co-inercia analysis: an alternative method for studying species-environment relantionships. Freshwater Biology, 31, 227-294.
Dray, S., & Dufour, A. B. (2007). The ade4 package: implementing the duality diagram for ecologists. Journal of Statistical Software, 22(4), 1-20. Retrieved from: http://pbil.univ-lyon1.fr/ADE-4.
Dray, S., Chessel, D., & Thioulouse, J. (2003). Coinertia analysis and the linking of ecological data tables. Ecology, 84(11), 3078-3089.
Dvoroková, K. (2014). Sigma Versus Beta-Convergence in EU28: Do they lead to different results? In R. Neck (Ed.), Proceedings of the Mathematical Methods in Finance and Business Administration, 88-94.
European Commission (2017) Output of economic activities in the EU Member States. Retrieved from: http://ec.europa.eu/eurostat/web/products-eurostat-news/-/DDN-20171023-1?inherit Redirect=true [Accessed: 06/06/2018].
European Union [EU] (2018). The economy. Official website of the European Union. Retrieved from: https://europa.eu/european-union/about-eu/figures/economy_en [Acessed: 06/06/2018] EUROSTAT (2017) GDP and household accounts at regional level. Retrieved from:
http://ec.europa.eu/eurostat/statistics-explained/index.php [Accessed: 06/06/2018].
EUROSTAT (2018) Business demography statistics. Retrieved from: http://ec.europa.eu/eurostat/statistics-explained/index.php/Business_demography_statistics [Accessed: 06/06/2018].
Ferreiro, J., Gálvez, C., Gómez, C., & González, A. (2017). Economic crisis and convergence in the Eurozone countries. Panoeconomicus, 64(2), 223-244.
Frankel, J., & Rose, A. K. (1998). The Endogeneity of the Optimum Currency Area Criteria. Economic Journal, 108, 1009-1025.
Fritsch, M. (1996). Turbulence and growth in West Germany: a comparison of evidence by regions and industries. Review of Industrial Organization, 11(2), 231-251.
Fritsch, M. (2012): Methods of analyzing the relationship between new business formation and regional development. Jena Economic Research Papers, No. 2012,064. Univ. u.a., Jena. Fritsch, M. (2013). New business formation and regional development: A survey and assessment
of the evidence. Foundations and Trends® in Entrepreneurship, 9(3), 249-364.
Fritsch, M., & Mueller, P. (2004). Effects of new business formation on regional development over time. Regional Studies, 38(8), 961-975.
Koellinger, P., & Thurik, R. (2012). Entrepreneurship and the Business Cycle. Review of Economics and Statistics, 94, 1143-1156.
Kroonenberg, P. M. (1989). The analysis of multiple tables in factorial ecology. III.-three-mode principle component analyses:'Analyse triadique complète'. Acta Oecologica Oecologia Generalis, 10, 245-256.
Marques, A., & Soukiazis, E. (1998). Per capita income convergence across countries and across regions in the European Union: Some new evidence. In Proceedings of the 2nd International Meeting of the European Economy, Lisbon, Portugal, December 1998.
OECD/Eurostat (2012). Component expenditures of GDP. Eurostat-OECD Methodological
Manual on Purchasing Power Parities (pp.64-86). OECD Publishing.
http://dx.doi.org/10.1787/9789264189232-7-en
Parker, S. C. (2012). The Economics of Entrepreneurship. Cambridge: Cambridge University Press.
R Development Core Team (2008). R: A language and environment for statistical computing. R Foundation for Statistical Computing, Vienna, Austria. ISBN 3-900051-07-0. Retrieved from: http://www.R-project.org
Santarelli, E., & Vivarelli, M. (2006). Entrepreneurship and the process of firms’ entry, survival and growth. Industrial and corporate change, 16(3), 455-488.
Santos, A. D., Ribeiro, S., Castela, G., & da Silva, N. T. (2017). The Dynamics between Economic Growth and Living Standards in EU Countries: A STATICO Approach for the Period 2006-2014. Estudios de economía aplicada, 35(3), 629-652.
Shiller, R., & Quinn, B. (2008). The Subprime Solution: How Today's Financial Crisis Happened, and What To Do About it. Financial Regulator, 13(2), 75.
Siljak, D. (2015). Real economic convergence in the European Union from 1995 to 2013. Business and Management Review, 6, 213-225.
Strielkowski, W., & Höschle, F. (2015). Evidence for economic convergence in the EU: The analysis of past EU enlargements. Technological and economic development of economy, 22(4), 617-630.
Thioulouse, J. (2011). Simultaneous analysis of a sequence of paired ecological tables: A comparison of several methods. The Annals of Applied Statistics, 5, 2300-2325.
Thioulouse, J., & Chessel, D. (1987). Les analyses multitableaux en écologie factorielle. I: De la typologie d'état à la typologie de fonctionnement par l'analyse triadique. Acta Oecologica Oecologia Generalis, 8, 463-480.
Wallace, H., Pollack, M. A., & Young, A. R. (2015). Policy-making in the European Union (7th edition). USA: Oxford University Press. pp. 176-180.
António Duarte Santos
CARS - Centre for Economic Analysis of Social Regulation, Autonoma University of Lisbon. Rua de Santa Marta, nº 47 – 6th, 1150-293 Lisbon, Portugal [email protected]
Nelson Tavares da Silva
Faculty of Economics of the University of Algarve, Campus de Gambelas-Building 9, 8005-139 Faro, Portugal [email protected] Guilherme Castela
CIEO-Research Centre for Spatial and Organizational Dynamics University of Algarve Campus de Gambelas-Building 9, 8005-139 Faro, Portugal [email protected]