Repositório ISCTE-IUL
Deposited in Repositório ISCTE-IUL:
2018-05-10Deposited version:
Post-printPeer-review status of attached file:
Peer-reviewedCitation for published item:
Cidral, W. A., Oliveira, T., Di Felice, M. & Aparicio, M. (2018). E-learning success determinants: Brazilian empirical study. Computers and Education. 122, 273-290
Further information on publisher's website:
10.1016/j.compedu.2017.12.001Publisher's copyright statement:
This is the peer reviewed version of the following article: Cidral, W. A., Oliveira, T., Di Felice, M. & Aparicio, M. (2018). E-learning success determinants: Brazilian empirical study. Computers and Education. 122, 273-290, which has been published in final form at
https://dx.doi.org/10.1016/j.compedu.2017.12.001. This article may be used for non-commercial purposes in accordance with the Publisher's Terms and Conditions for self-archiving.
Use policy
Creative Commons CC BY 4.0
The full-text may be used and/or reproduced, and given to third parties in any format or medium, without prior permission or charge, for personal research or study, educational, or not-for-profit purposes provided that:
• a full bibliographic reference is made to the original source • a link is made to the metadata record in the Repository • the full-text is not changed in any way
The full-text must not be sold in any format or medium without the formal permission of the copyright holders.
Serviços de Informação e Documentação, Instituto Universitário de Lisboa (ISCTE-IUL) Av. das Forças Armadas, Edifício II, 1649-026 Lisboa Portugal
Phone: +(351) 217 903 024 | e-mail: [email protected] https://repositorio.iscte-iul.pt
E-learning success determinants: Brazilian empirical study
Wilmar Audye Cidral, Tiago Oliveira, Massimo Di Felice, Manuela Aparicio
PII: S0360-1315(17)30258-0
DOI: 10.1016/j.compedu.2017.12.001
Reference: CAE 3270
To appear in: Computers & Education
Received Date: 8 February 2017 Revised Date: 1 December 2017 Accepted Date: 2 December 2017
Please cite this article as: Cidral W.A., Oliveira T., Di Felice M. & Aparicio M., E-learning success determinants: Brazilian empirical study, Computers & Education (2018), doi: 10.1016/ j.compedu.2017.12.001.
This is a PDF file of an unedited manuscript that has been accepted for publication. As a service to our customers we are providing this early version of the manuscript. The manuscript will undergo copyediting, typesetting, and review of the resulting proof before it is published in its final form. Please note that during the production process errors may be discovered which could affect the content, and all legal disclaimers that apply to the journal pertain.
M
AN
US
CR
IP
T
AC
CE
PT
ED
1
E-learning success determinants: Brazilian empirical
study
Wilmar Audye Cidral
124<[email protected]>
, Tiago Oliveira
2<[email protected]>
, Massimo Di Felice
1<[email protected]>
,
and Manuela Aparicio
23*
[email protected]
¹ ECA-USP - Escola de Comunicação e Artes / Universidade de São Paulo
(Brazil)
² NOVA, Information Management School (NOVA IMS), Universidade Nova de
Lisboa (Portugal)
³ Instituto Universitario de Lisboa (ISCTE-IUL) ISTAR-IUL (Portugal)
⁴
Sustentare Escola de Negócios (Brazil)
*
Corresponding Author:
Manuela Aparicio,
M
AN
US
CR
IP
T
AC
CE
PT
ED
1E-learning success determinants: Brazilian empirical study
ABSTRACT
E-learning is a web-based learning ecosystem for the dissemination of information, communication, and knowledge for education and training. Understanding the impact of e-learning on society, as well as its benefits, is important to link e-learning systems to their success drivers. The aim of this study is to find the determinants of user perceived satisfaction, use, and individual impact of e-learning. This study proposes a theoretical model integrating theories of information systems’ satisfaction and success in the e-learning systems. The model was empirically validated in higher education institutions and university centers in Brazil through a quantitative method of structural equation modeling. Collaboration quality, information quality, and user perceived satisfaction explain e-learning use. The drivers of user perceived satisfaction are information quality, system quality, instructor attitude toward e-learning, diversity in assessment, and learner perceived interaction with others. System quality, use, and user perceived satisfaction explain individual impact.
Keywords
M
AN
US
CR
IP
T
AC
CE
PT
ED
2E-learning success determinants: Brazilian empirical study
1. Introduction
E-learning is a web-based learning ecosystem integrating several stakeholders with technology and processes. With the popularization and expansion of access to the World Wide Web and greater access to devices to access the Internet, such as smartphones, laptops, tablets, and computers, learning using e-learning practices has expanded rapidly all around the world. The main examples of global e-learning systems are Coursera, EDX, Udacity, and Khan Academy among others that are also known as Massive Open Online Courses (MOOCs) (Alraimi, Zo, & Ciganek, 2015; Chauhan, 2014).
Studies of Zhang & Nunamaker (2003) addressed the impact of e-learning in the new millennium. The new economy is characterized by industrial change, globalization, the rise of intensive competition, sharing and transferring knowledge, the revolution of information technology, the reinvention of the classroom, and the lack of meeting new needs of the new learning world and of life. Learning is changing its center point, from teacher to student. At the same time, it offers previously unthinkable possibilities of interaction and access to knowledge virtually anywhere in the world (Felice, 2009; Yanaze, 2006). E-learning provides people with a flexible and personalized way to learn; allowing learning on demand and reducing the cost of learning. A variety of core technologies that can facilitate the design and implementation of e-learning systems are emerging, and therefore a far-reaching impact on learning is achieved in the new millennium. Brazil is a large country characterized by varying degrees of access to the digital world. It still registers considerable difficulties concerning digital inclusion (Haddad & Oliveira, 2017; Haddad, Oliveira, & Cardoso, 2016). Studies point out that the “Telecentros”, a public digital “meeting point”, are important for digital inclusion of those who are poor and excluded from the traditional educational system. In Brazil from 2005 to 2010 a new policy of distance learning was launched, named Brazilian Open University System, involving various stakeholders, such as public universities, municipalities, and the federal government. This program intended from the outset to address the opportunity to provide supplementary educational programs to adults (da Cruz Duran & da Costa, 2016). .
M
AN
US
CR
IP
T
AC
CE
PT
ED
3 To date, several studies have used the original version of the classic model, the DeLone & McLean (D&M) IS Success Model (DeLone & McLean, 1992, 2003) to measure and evaluate the success of e-learning systems (Holsapple & Lee‐Post, 2006; Lin, 2007; Lin & Lee, 2006). As far as we know however, one of the first studies conducted to understand and modulate the e-learning Brazilian reality was Machado-Da-Silva, Meirelles, Filenga, & Filho (2014). In that study the authors found that information quality, service quality, and system quality had direct impact on e-learning systems use and satisfaction. Even so, these authors point out that future studies should be conducted, mainly to understand the perceived impacts of e-learning systems in Brazil, such as net benefits, which result from the individual and organizational impacts. Other studies referring to the use of e-learning systems in Brazil are scarce. Some authors who study e-learning in Brazil study learners’ satisfaction and use, not measuring the individual performance (individual impacts) (Dias, 2008; George et al., 2014; Machado-Da-Silva et al., 2014; Moreno Jr. & Zaroni, 2015). The purpose of this article is to achieve a better understanding of satisfaction, use, and success of e-learning in the Brazilian context. Several surveys of e-learning have been conducted, but no study makes use of DeLone & McLean (1992), but instead integrate models of Sun, Tsai, Finger, Chen, & Yeh (2008), and Urbach, Smolnik & Riempp (2010a), and consider that further studies are needed to better understand the reality (Al-Samarraie, Teng, Alzahrani, & Alalwan, 2017). As main contributions of this study, we outline the integration of information systems success theory D&M with e-learning satisfaction theory. Another feature of the study is that it was conducted in several organizational environments of a developing country, in which technology may help to decrease the educational, digital, and geographical divide.The next section describes the theoretical foundations of e-learning and provides a review of the literature on use, as well as satisfaction and success of e-learning. In the following section, we explain how the theoretical model was developed and the characteristics of the constructs and case studies. The section describes the method of the approach to the creation of the constructs and empirical data collection. In the section of analysis and results, the measurement model and evaluation of the model are addressed through structural equation modeling. The discussion section presents the study results and outlines the implications of the research, its limitations, and contributions.
M
AN
US
CR
IP
T
AC
CE
PT
ED
42. Theoretical Foundation
E-learning is the use of information technology to disseminate information and knowledge for education and training; e-learning emerges as a paradigm of modern education. E-learning comprises the use of the web to access information and knowledge, disregarding time and space (Aparicio, Bacao, & Oliveira, 2014b, 2014a). E-learning is changing in the way it is used through several devices, according to Liu & Hwang (2010). Access to courses through computer networks (e-learning), mobile devices, wireless communications (m-learning) (Amasha & AbdElrazek, 2016), the mobile sensor technologies, and wireless communications are changing the e-learning paradigm. A new system architecture of the learning environment is in progress: context-awareness and ubiquitous learning (u-learning).
2.1. E-learning systems studies
The use of virtual learning environments in addition to classroom study (blended learning), were surveyed by Stricker, Weibel, & Wissmath, (2011). These authors compared two groups of students: a group with the support of virtual learning environment (VLE), and a group without contact with the VLE. The students’ performance of the VLE support had better results than those having only face to face learning. The research of Sorgenfrei, Borschbach, & Smolnik (2013) points out three major drivers that guide the process of education through e-learning tools: technical and design size, individual motivation, and environment characteristics. According to the authors, each of these drivers will affect the intention of students to take other e-learning courses. E-learning acceptance predictors were studied by Cheng (2011), who concluded that perceived usefulness, ease of use, perceived enjoyment, network externality factor, system factor, individual factors, and social factors are the main determinants of acceptance of the e-learning systems. Recent studies found that the encouragement of a higher social ability affects positively the intention to continue using e-learning, by motivating a greater use of communication tools during courses, allowing learners to increase social participation among students (Brahmasrene & Lee, 2012).
Appendix A outlines some of the satisfaction and e-learning success studies. Satisfaction factors identified by Frankola (2001) explain the low rates of satisfaction with the learning: students do
M
AN
US
CR
IP
T
AC
CE
PT
ED
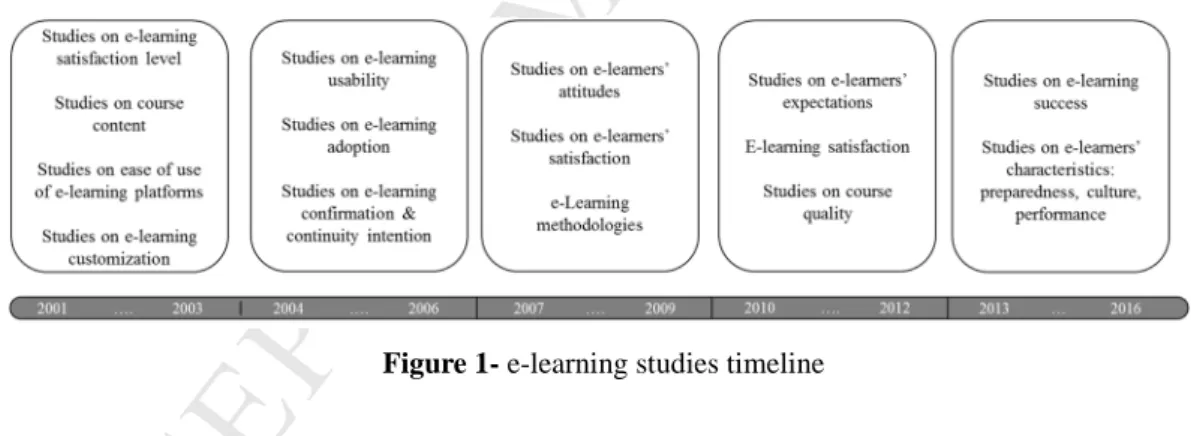
5 not have enough time, there is failure in supervision or management of e-learning structure, the lack of motivation, problems with the technology chosen, erratic support to the student, preference for traditional learning, poor graphic design adopted by the platform, and instructor deficiency (lack of knowledge and/or ability to deliver). A study on student satisfaction of e-learning (Wang, 2003) highlighted important determinants such as student interface, learning community, content, and customization. Selim (2003) found that the ease of use of web courses is the main determinant of acceptance as an effective and efficient technology for learning. Selim (2007) described the critical success factors of e-learning as grouped into four categories: trainer, student, information technology, and university support. From literature it is known that students’ dimension, teachers, courses, technology, design, and environment determine e-learning success (Sun et al., 2008). Research shows that attitude of students and instructors toward e-learning can determine success (Liaw, Huang, & Chen, 2007). Their study posed a three-tier technology use model (3-TUM). Figure 1 depicts the evolution of e-learning systems based on the studies in Appendix A. In general, earlier studies focused more on technology itself and on content, but the latest studies reflect that students’ attitude and interaction also play an important role in e-learning success.Figure 1- e-learning studies timeline
These studies confirm that the research trend from 2001 to 2003, began with a focus on course contents and customization. Then, from 2004 to 2006 the research focus was on usability of e-learning platforms, and on adoption and confirmation to continuity intention. Later, from 2007 to 2009, studies focused more on students’ satisfaction level and e-learning methodologies. In the interval of 2010 to 2012, we found studies on e-learners’ expectations and satisfaction. Recently, from 2013 to 2016, studies are more focused on the overall success of e-learning and on how students’ characteristics affect e-learning.
M
AN
US
CR
IP
T
AC
CE
PT
ED
62.2. Information System (IS) success
Information systems success has been studied regarding the End-User Computing Satisfaction (EUCS) developed by Doll & Torkzadeh (1988). DeLone & McLean (1992) proposed one of the most tested IS success models. The 1992 D&M model is composed of six theoretical constructs: system quality, information quality, use, user satisfaction, individual impact, and organizational impact. Afterwards, in 2003, the D&M success model was updated and found theoretical evidence that service quality is also a success determinant regarding positive influence on the use and user satisfaction (DeLone & McLean, 2003). In this model a new construct was included, net benefits, a result of merging the individual impacts and organizational impacts constructs. According to these authors (DeLone & McLean, 2003), system quality corresponds to the technological characteristics, performance, and usability of the system itself. Information quality corresponds to the system’s accuracy, validity, and currency regarding the system contents. Service quality relates to the responsiveness and perceived competence of the technological staff. Use is one of the literature success measures, and corresponds to the effective use of a system, therefore full adoption, the first phase of success. User satisfaction is the perceived level of agreeableness toward the entire system. It is measured by the appropriateness and effectiveness. Net benefits are the perceived individual and organizational impacts on tasks/job performance and efficiency.
3. Theoretical model
This study modulates the e-learning success in the Brazilian context. The proposed model is based on the previous theory of e-learning satisfaction and IS success theory. The proposed research model, Figure 2, integrates two theories, e-learning satisfaction and IS success (DeLone & McLean, 2003; Sun et al., 2008; Urbach, Smolnik, & Riempp, 2010a). These theories have been validated by several empirical studies and are therefore models with solid foundations (Bento, Costa, & Aparicio, 2017).
M
AN
US
CR
IP
T
AC
CE
PT
ED
73.1. Constructs
The proposed research model comprises 11 theoretical constructs: collaboration quality (CQ), service quality (SerQ), information quality (IQ), system quality (SysQ), learner computer anxiety (LCA), instructor attitude toward learning (IATL), diversity assessment (DA), learner perceived interaction with others (LPIO), user satisfaction (US), use, and individual impacts (II). Collaboration quality corresponds to the web environment features, digital culture and the universal use of the web on various platforms such as smartphones, tablets, and computers (Benbya, Passiante, & Belbaly, 2004; Detlor, 2000; Urbach et al., 2010a; Wang, 2003). Service quality is the e-learning system requirements for efficient service support, which can be measured by points responsiveness, empathy, trust, and security (DeLone &McLean, 2003; Urbach et al., 2010a). Information quality: for the quality of information of an e-learning system some items are needed, such as applicability, comprehensiveness, and reliability. System quality of an e-learning system comprehends functionality, usability, navigability, and the accessibility that users perceive from the usage of an e-learning platform during the course. Learner computer anxiety: anxiety is an internal personal characteristic, stable and durable, as a result of the external environment (Spielberger & Anton, 1976). Instructor attitude toward e-learning is measured by the student perception of the usefulness pointed out by the teacher during the course, compared to face to face learning (Sun et al., 2008). Diversity in assessment is the presence of various assessment methods in the course. Learner-perceived interactions with others comprehend three types of interaction, students with teachers, students with course materials, and students with students (Moore, 1989). User satisfaction is one success measure of the overall level of fulfilment of learners’ expectations (Sun et al., 2008). Use measures the actual use of e-learning system by the students to perform their learning tasks, for example, retrieve and publish information and communicate with others. The individual impact is the degree of benefit perceived by students when using an e-learning system.
3.2. Hypotheses
Based on the findings of Urbach et al. (2010a), collaboration quality emerged as a significant determinant on the system usage and also on the user satisfaction. Thus, it creates possibilities for
M
AN
US
CR
IP
T
AC
CE
PT
ED
8 co-creation, communities of practice, and collaborative knowledge (Benbya et al., 2004; Detlor, 2000; Urbach et al., 2010a; Wang, 2003). The efficiency of different collaborative features, ease of use, efficiency and comfortability for collaboration, facilitating communication and information sharing on multi platforms (e.g.: LMS, networks, and social media), are essential for supporting collaborating tasks. Therefore, the current research hypothesizes that:(H1a). Collaboration Quality has a positive influence on the Individual Impact of e-learning systems.
(H1b). Collaboration Quality has a positive influence on the Use of e-learning systems.
(H1c). Collaboration Quality has a positive influence on the User Satisfaction of e-learning systems.
Service quality of e-learning systems needs responsiveness, empathy, trust, and security of the supporting staff. According to earlier studies, service quality is essential to satisfaction and use (Chang & King, 2005; Pitt, Watson, & Kavan, 1995; Uppal, Gulliver, & Ali, 2017), and in e-learning context service quality impacts positively e-e-learning usage and students’ satisfaction (Aparicio, Bacao, & Oliveira, 2017; Machado-Da-Silva et al., 2014). Our proposal is that service quality has an impact not only on use and on satisfaction, but also on individual performance. Therefore, the current research hypothesizes that:
(H2a). Service Quality has a positive influence on the Individual Impact of e-learning systems. (H2b). Service Quality has a positive influence on the Use of e-learning systems.
(H2c). Service Quality has a positive influence on the User Satisfaction of e-learning systems.
Rich content provides quality of the information regarding its usefulness, understandability, and reliability (DeLone & McLean, 1992). Several studies have found that information quality has a positive impact on the use and satisfaction (Lin & Lee, 2006; Machado-Da-Silva et al., 2014; McKinney, Yoon, & Zahedi, 2002; Urbach et al., 2010a; Yang, Cai, Zhou, & Zhou, 2005). Information quality can also have a direct impact on individual performance (DeLone & McLean, 2002). Therefore, the current research hypothesizes that:
(H3a). Information Quality has a positive influence on the Individual Impact of e-learning systems.
M
AN
US
CR
IP
T
AC
CE
PT
ED
9(H3c). Information Quality has a positive influence on the User Satisfaction of e-learning systems.
System quality of an e-learning system is critical to a good user experience of e-learning (Ahn, Ryu, & Han, 2004). It is also identified as having an impact on performance characteristics, functionality, and usability, among others (McKinney et al., 2002). System quality is the level of ease of use and carrying out of tasks (Elkaseh, Wong, & Fung, 2016; Schaupp, Fan, & Belanger, 2006). Studies by Urbach et al. (2010a) also demonstrate the importance of navigability, accessibility, structure, visual logic, and stability of e-learning systems to ensure a good user experience and learning (Butzke & Alberton, 2017; Tarhini, Hone, Liu, & Tarhini, 2017). Studies demonstrate that system quality has a positive impact on use and satisfaction (Aparicio et al., 2017; Urbach et al., 2010a). DeLone & McLean (2002) hypothesize that system quality has a direct and positive impact on individual performance. Therefore, the current research hypothesizes that:
(H4a). System Quality has a positive influence on the Individual Impact of e-learning systems. (H4b). System Quality has a positive influence on the Use of e-learning systems.
(H4c). System Quality has a positive influence on the User Satisfaction of e-learning systems.
Students’ anxiety toward computers is different from their attitude. Computer anxiety represents beliefs and feelings about computers (Heinssen, Glass, & Knight, 1987). However, learners’ anxiety has a negative impact on satisfaction, preventing e-learning success (Sun et al., 2008). These authors found that the greater is the anxiety, the smaller will be the task performance (Kanfer & Heggestad, 1997). The attitudes of individuals well-adjusted to technology would be more positive and will lower anxiety levels (Barbeite & Weiss, 2004). Therefore, the current research hypothesizes that:
(H5). The Learner Computer Anxiety has a negative influence on the User Perceived Satisfaction of e-learning user.
Instructor attitude toward e-learning corresponds to teachers’ reactions about students’ problems (Soon, Sook, Jung, & Im, 2000). In an online course, instructor assistance encourages students to continue their studies. Consequently, if a teacher can handle the e-learning activities and responds to students’ needs and problems promptly, the satisfaction of learning will improve (Levy &
M
AN
US
CR
IP
T
AC
CE
PT
ED
10 Ramim, 2017). Studies support the impact of this variable on satisfaction (Webster & Hackley, 1997; Sun et al., 2008). Therefore, the current research hypothesizes that:(H6). The instructor attitude toward Learning influences User Perceived Satisfaction of the e-learning user.
Diversity in the assessment are the appropriate feedback evaluation methods and mechanisms. These mechanisms are essential for e-learning users, allowing the follow-up of learning. According to some studies this considerably influences students’ satisfaction (Thurmond, Wambach, Connors, & Frey, 2002; Sun et al., 2008). Therefore, if an e-learning system provides more assessment tools and diverse methods, the level of user satisfaction will be greater. As a consequence, the current research hypothesizes that:
(H7). The Diversity In Assessment has a positive influence on the User Perceived Satisfaction of e-learning user.
In a virtual learning environment the electronic interactions between students or between students and course materials can help to solve problems and improve the frequency and quality of the learning process. Arbaugh’s (2002) study suggests that when students realize greater interaction with others, there is an increase of user satisfaction. Therefore, the current research hypothesizes that:
(H8). The Learner Perceived Interaction with Others has a positive influence on the User Perceived Satisfaction of e-learning user.
User perceived satisfaction toward an information system influences the actual usage of a system (DeLone & McLean, 2003). This relationship between satisfaction and use of an information system is sustained by several studies (Costa, Ferreira, Bento, & Aparicio, 2016; Seddon, 1997; Sun et al., 2008; Urbach et al., 2010a). Some studies on e-learning success also support that the more satisfied the students are the more they will use e-learning systems (Aparicio, Bacao, & Oliveira, 2016b; Aparicio et al., 2017; Wang & Chiu, 2011). Therefore, the current research hypothesizes that:
M
AN
US
CR
IP
T
AC
CE
PT
ED
11 Information systems usage is positively related to individual performance (Aparicio et al., 2016; DeLone & McLean, 2002; Tam & Oliveira, 2016; Urbach et al., 2010a). If e-learners’ usage perception is aligned with their needs, students can accomplish their tasks in a more effective way. The more students use e-learning systems, the more they perceive positive individual impacts (Aparicio et al., 2016). Therefore, the current research hypothesizes that:(H10). The Use has a positive influence on the Individual Impact of e-learning user.
The greater the user satisfaction, the greater the individual impact (DeLone & McLean, 1992; Tam & Oliveira, 2016; Urbach et al., 2010a). Studies on e-learning success report that user satisfaction has a significant impact on value (Alsabawy, Cater-Steel, & Soar, 2011), and positive impact on individual performance (Aparicio et al., 2016, 2017; Piccoli, Ahmad, & Ives, 2001). Therefore, the current research hypothesizes that:
(H11). The User Perceived Satisfaction has a positive influence on the Individual Impact of e-learning user.
Figure 2 presents the research model proposal based on the above hypotheses. The most studied dimension of e-learning systems success is users’ satisfaction (Aparicio et al., 2016; George et al., 2014). Satisfaction has a positive impact on usage and on individual impacts (DeLone & McLean, 2003). For this reason we included another theory validated for e-learning systems (Sun et al., 2008), as other dimensions, such as learners’ attitude toward technology, instructor attitude, assessment, and interaction between learners’ satisfaction of e-learning. We included individual aspects of learners to better understand their role in success. We also included collaboration quality in the model (Urbach et al., 2010a) because on-line students tend to be in different physical locations, and that can affect their individual performance.
M
AN
US
CR
IP
T
AC
CE
PT
ED
12 Figure 2- e-learning systems’ success research model proposal4. Methodological approach
As the theoretical model has qualitative approaches to generalization, the quantitative method was chosen, as deemed more suitable (Johnson & Duberley, 2013). The survey collected 301 valid responses. An online survey was conducted with students (undergraduate and graduate) to collect data for the empirical evaluation of our theoretical model. The research design is in line with most studies and best practices.
4.1. Construct Operationalization
The research model constructs’ operationalization is composed of tested scales of several studies, of both information systems success theory and e-learning systems theory (Appendix A). Each construct of the conceptual model made use of tested and proven measures in order to increase the validity of the study. The latent variables, collaboration quality (CQ), service quality (SerQ), information quality (IQ), use, user satisfaction (US), and individual impacts (II), are operationalized according to items adaptation of Urbach et al. (2010). Learner computer anxiety (LCA), instructor attitude toward e-learning (IATL), diversity assessment (DA), and learner perceived interaction with others (LPIO) are according to the items of Sun et al. (2008).
M
AN
US
CR
IP
T
AC
CE
PT
ED
134.2. Survey environment & data collection strategy
The data collection instrument was initially developed in English, according to validated literature scales (Appendix B). Then, the final version was translated to Portuguese, by a professional translator, and then back into English by a different translator to ensure conversion correspondence (Brislin, 1970). The questionnaire was pre-tested by a group of 20, non-distance learners, to certify that it was well interpreted by university students. The sampling strategy undertaken consisted of directly contacting 24 organizations of higher education institutions all over Brazil, requesting collaboration to disseminate the online survey among their students. A hyperlink was provided by email to the coordinators so they could pass it on to the students, asking them to distribute the e-mail to all students. Course coordinators (graduate and undergraduate) in Brazil were contacted. Participation was encouraged by offering higher education institutions the survey results. When necessary, telephone contact with the course coordinators (and in some cases with principals) was made to clarify the objectives of the study and discussion of new procedures. The data collection process followed a strict path. The research is approved by the university committee, and in an ethical point of view, the universities involved did not oppose the study. The study is anonymous and private, and all the questions concern the study context. At the beginning of the questionnaire, all the respondents were informed about the academic research purpose of the survey, in which they voluntarily agreed to participate. The questionnaire was totally anonymized, no personal information was asked for from respondents, and no tracking systems were employed. As a delimitation, the study was addressed only to higher education institutions, such as colleges, universities, and university centers, either public or private. To minimize bias and obtain respondents, it was emphasized that all the data would be treated with total confidentiality and that the identity of the respondent could not be inferred.
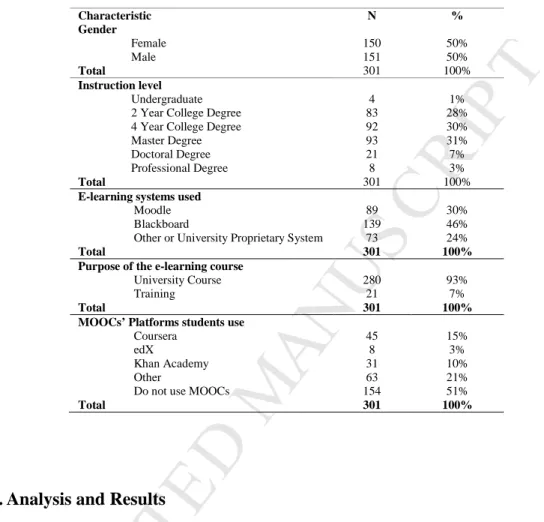
From January of 2015 to June of 2015, 381 responses to the survey were obtained, although due to incomplete answers only 301 were considered valid and complete for analysis. Students’ responses included both the classroom mode with learning as support (blended learning) and 100% e-learning. Learners answered on a seven-point scale, from 1 point - strongly disagree, to 7 points - strongly agree. The questionnaire also included queries about general respondents characteristics, such as gender, age, and which e-learning platform they use and general comments (Table 1). The survey is balanced in terms of male (50%) and female (50%) respondents. The university students
M
AN
US
CR
IP
T
AC
CE
PT
ED
14 are respectively 48% male and 52% female (INEP, 2016; OECD, 2015). Most learners in the sample are at a university level. There is no statistically significant difference (p>0.10) between the gender of our sample and the university student population.Table 1- Sample Characterization
Characteristic N % Gender Female 150 50% Male 151 50% Total 301 100% Instruction level Undergraduate 4 1%
2 Year College Degree 83 28% 4 Year College Degree 92 30%
Master Degree 93 31%
Doctoral Degree 21 7%
Professional Degree 8 3%
Total 301 100%
E-learning systems used
Moodle 89 30%
Blackboard 139 46%
Other or University Proprietary System 73 24%
Total 301 100%
Purpose of the e-learning course
University Course 280 93%
Training 21 7%
Total 301 100%
MOOCs’ Platforms students use
Coursera 45 15%
edX 8 3%
Khan Academy 31 10%
Other 63 21%
Do not use MOOCs 154 51%
Total 301 100%
5. Analysis and Results
For data analysis we used the structural equation model (SEM) method. Using the empirical survey data, the measurement properties were evaluated and the hypotheses were tested using the approach of partial least squares (PLS) (Chin, 1998; Wold, 1985). PLS was chosen for data analysis due to its advantages, even if compared to approaches based on the covariance. When the search model is complex, it has a large number of constructs, and the measures are not well established, (Chin & Newsted, 1999; Fornell & Bookstein, 1982). Furthermore, PLS software may be more suitable because it has less-stringent requirements on the distributions (Fornell & Bookstein, 1982; Gefen, Straub, & Boudreau, 2000). Finally, the approach by the PLS is the most suitable for management problems focused on forecasts (Fornell & Bookstein, 1982; Huber, Herrmann, Meyer, Vogel, & Vollhardt, 2007). The software used was Smart PLS version 2.0 (Ringle, Wende, & Becker, 2015) for statistical calculations.
M
AN
US
CR
IP
T
AC
CE
PT
ED
155.1. Measurement model evaluation
Reflective indicators were used to establish the constructs. Following the validation guidelines proposed by Lewis, Templeton, & Byrd, (2005) and by Straub, Boudreau, & Gefen, (2004), models of reflective measurement for one-dimensionality, internal consistency, indicator reliability, convergent validity, and discriminant validity were tested by applying standard decision rules. The traditional criterion to assess the internal consistency is Cronbach's Alpha (CA). All the CA are above 0.700, indicating internal consistency, and the scores of all items of the constructs have the same scope and meaning as defined by Cronbach (1951). An alternative measure for CA is composite reliability (CR) (Werts, Linn, & Jöreskog, 1974). The CR is recommended by Chin (1998) as the preferred measure, as it overcomes some of the deficiencies of the CA. The CA and CR values of all constructs in our model are, as shown in Table 2, above the minimum recommended 0.700 (Nunnally & Bernstein, 1994). The model measures the CR above 0.800, meeting the criteria established by Peter (1979).
We evaluated the indicator reliability checking the criteria that the loadings should be greater than 0.70 (Henseler, 2010; Henseler, Ringle, & Sinkovics, 2009). As reported in Table 2, loadings are greater than 0.7, except two items (Use1 and Use 5), which are lower than 0.7 but greater than 0.4. Hence, no items in the table were eliminated. The measuring instrument presented good indicator reliability. Convergent validity relates to the level at which individual items are reflected in the construct and converge compared to items that measure different constructs. A commonly applied convergent validity criterion is the average variance extracted (AVE) proposed by Fornell & Larcker (1981). As shown in Table 2, all model constructs have indicators above 0.500, indicating that the variance of the construct is greater than the variation caused by the respective measurement errors and thus indicating that all constructs have adequate validity (Segars, 1997).
Table 2. Measurement model results
Constructs Items Loadings
Composite Reliability (CR) Cronbach’s Alpha (CA) Average Variance Extracted (AVE) Discriminant Validity Collaboration Quality (CQ) CQ1 0.917 0.952 0.933 0.831 Yes CQ2 0.944 CQ3 0.859 CQ4 0.925 Service Quality (SerQ) SerQ1 0.931 0.946 0.923 0.814 Yes SerQ2 0.872 SerQ3 0.942 SerQ4 0.861
M
AN
US
CR
IP
T
AC
CE
PT
ED
16Constructs Items Loadings
Composite Reliability (CR) Cronbach’s Alpha (CA) Average Variance Extracted (AVE) Discriminant Validity (IQ) IQ2 0.884 IQ3 0.902 IQ4 0.816 System Quality (SysQ) SysQ1 0.922 0.956 0.939 0.845 Yes SysQ2 0.929 SysQ3 0.922 SysQ4 0.904 Learner Computer Anxiety (LCA) LCA1 0.905 0.952 0.925 0.870 Yes LCA2 0.959 LCA3 0.933 Instructor Attitude Toward e-Learning (IATL) IATL1 1.000 1.000 1.000 1.000 Yes Diversity in
Assessment (DA) DA1 1.000 1.000 1.000 1.000 Yes
Learner Perceived Interaction with Others (LPIO) LPIO1 0.775 0.868 0.773 0.686 Yes LPIO2 0.845 LPIO3 0.862 User Perceived Satisfaction (US) US1 0.895 0.930 0.899 0.771 Yes US2 0.753 US3 0.936 US4 0.916 Use (Use) Use1 0.617 0.851 0.777 0.537 Yes Use2 0.809 Use3 0.808 Use4 0.793 Use5 0.604 Individual Impact (II) II1 0.893 0.944 0.920 0.808 Yes II2 0.939 II3 0.935 II4 0.824
As all the AVEs are above 0.500, requirements are met (Barclay, Higgins, & Thompson, 1995; Fornell & Larcker, 1981; Hair, Hult, Ringle, & Sarstedt, 2014; Urbach & Ahlemann, 2010). Finally, the discriminant validity measures the level at which the scale of different constructs differs from each other. To further validate that all measures are in fact different, the AVE square root extracted for each construct was examined and found to be higher than the correlation between constructs (Table 3). Conceptually, this test requires that each construct represents more of the variance in its indicators than it shares with other constructs (Fornell & Larcker, 1981). A second criterion was used; we compare the loadings with the cross-loadings. We can see in Appendix C that the loadings (in bold) are greater than respective cross-loadings. Consequently, for both criteria the discriminant validity was achieved.
Table 3. Correlation between constructs and square root of AVEs
CQ SerQ IQ SysQ LCA IATL DA LPIO US Use II
CQ 0.912
SerQ 0.472 0.902 IQ 0.460 0.386 0.884 SysQ 0.482 0.418 0.578 0.919 LCA -0.011 -0.038 -0.177 -0.218 0.933
M
AN
US
CR
IP
T
AC
CE
PT
ED
17CQ SerQ IQ SysQ LCA IATL DA LPIO US Use II IATL 0.287 0.332 0.353 0.331 -0.109 1.000 DA 0.420 0.298 0.472 0.347 -0.131 0.402 1.000 LPIO 0.654 0.363 0.432 0.405 -0.052 0.364 0.472 0.828 US 0.407 0.390 0.660 0.563 -0.220 0.485 0.505 0.458 0.878 Use 0.503 0.285 0.443 0.350 -0.034 0.319 0.300 0.432 0.411 0.733 II 0.426 0.387 0.553 0.547 -0.240 0.399 0.379 0.384 0.671 0.452 0.899 Note: Diagonal elements (in bold) represent the square root of the AVE
5.2. Assessment of the structural model
After validation of the measurement model, the structural model was studied and the possible relationships between the constructs were tested. The results of the test conducted in the structural model are given in Figure 3 and Table 4. The test used 5,000 bootstrap resamples to determine the significance of the paths within the structural model. The quality of the model explains a considerable part of the variation of the latent variables. The model explains respectively 57.1% of the variation in user perceived satisfaction, 32.2% of the variation in use of e-learning, and 52.5% of the variation in individual impact. Since most of the constructs are explained well, we consider the model substantial. The model explains 32.2% of the e-learning use variation. Collaboration quality ( =0.370; p<0.001), information quality ( =0.189; p<0.050), and user perceived satisfaction ( =0.150; p<0.010) are statistically significant.
M
AN
US
CR
IP
T
AC
CE
PT
ED
18Notes: * significant at p<0.05; ** significant at p<0.01; *** significant at p<0.001
Figure 3. Research model results
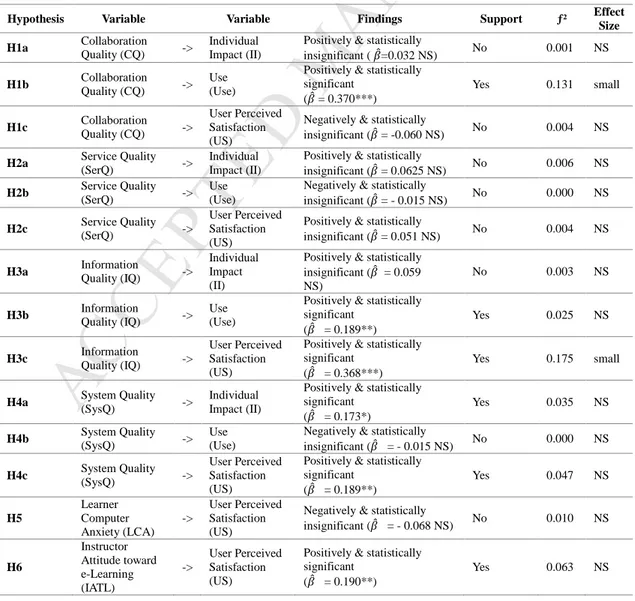
Consequently, H1b, H3b, and H9 are confirmed. The model explains 57.1% of the user perceived satisfaction variation. Information quality ( =0.368; p<0.001), system quality ( =0.189; p<0.050), instructor attitude toward e-learning ( =0.190; p<0.010), diversity in assessment ( =0.141; p<0.010), and learner perceived interaction with others ( =0.103; p<0.050) are statistically significant. Hence H3c, H4c, H6, H7, and H8 are confirmed. Finally, the model explains 52.5% of the individual impact variation. System quality ( =0.173; p<0.050), use ( =0.153; p<0.010), and user perceived satisfaction ( =0.433; p<0.001) are statistically significant. Thus, H4a, H10, and H11 are confirmed.
Table 4. Correlation between constructs and square root of AVEs
Hypothesis Variable Variable Findings Support ƒ² Effect
Size H1a Collaboration
Quality (CQ) ->
Individual Impact (II)
Positively & statistically
insignificant ( =0.032 NS) No 0.001 NS H1b Collaboration Quality (CQ) -> Use
(Use)
Positively & statistically significant ( = 0.370***) Yes 0.131 small H1c Collaboration Quality (CQ) -> User Perceived Satisfaction (US)
Negatively & statistically
insignificant ( = -0.060 NS) No 0.004 NS H2a Service Quality
(SerQ) ->
Individual Impact (II)
Positively & statistically
insignificant ( = 0.0625 NS) No 0.006 NS H2b Service Quality
(SerQ) -> Use (Use)
Negatively & statistically
insignificant ( = - 0.015 NS) No 0.000 NS H2c Service Quality (SerQ) -> User Perceived Satisfaction (US)
Positively & statistically
insignificant ( = 0.051 NS) No 0.004 NS H3a Information Quality (IQ) ->
Individual Impact (II)
Positively & statistically insignificant ( = 0.059 NS) No 0.003 NS H3b Information Quality (IQ) -> Use (Use)
Positively & statistically significant ( = 0.189**) Yes 0.025 NS H3c Information Quality (IQ) -> User Perceived Satisfaction (US)
Positively & statistically significant
( = 0.368***)
Yes 0.175 small
H4a System Quality (SysQ) ->
Individual Impact (II)
Positively & statistically significant ( = 0.173*) Yes 0.035 NS H4b System Quality (SysQ) -> Use (Use)
Negatively & statistically
insignificant ( = - 0.015 NS) No 0.000 NS H4c System Quality (SysQ) ->
User Perceived Satisfaction (US)
Positively & statistically significant ( = 0.189**) Yes 0.047 NS H5 Learner Computer Anxiety (LCA) -> User Perceived Satisfaction (US)
Negatively & statistically
insignificant ( = - 0.068 NS) No 0.010 NS H6 Instructor Attitude toward e-Learning (IATL) -> User Perceived Satisfaction (US)
Positively & statistically significant
( = 0.190**)
M
AN
US
CR
IP
T
AC
CE
PT
ED
19Hypothesis Variable Variable Findings Support ƒ² Effect
Size H7 Diversity In Assessment (DA) ->
User Perceived Satisfaction (US)
Positively & statistically significant ( = 0.141**) Yes 0.030 NS H8 Learner Perceived Interaction With Others (LPIO) -> User Perceived Satisfaction (US)
Positively & statistically significant ( = 0.103*) Yes 0.013 NS H9 User Perceived Satisfaction (US) -> Use (Use)
Positively & statistically significant
( = 0.150**)
Yes 0.017 NS
H10 Use (Use) -> Individual Impact (II)
Positively & statically significant ( = 0.153**) Yes 0.034 NS H11 User Perceived Satisfaction (US) -> Individual Impact (II)
Positively & statistically significant
( = 0.433***)
Yes 0.197 small Notes: NS = not significant; * significant at p<0.05; ** significant at p<0.01; *** significant at p<0.001; effect Size ƒ²: > 0.350 large; > 0.150 and ≤0.350 medium; > 0.20 and ≤0.150 small; (Chin, 1998; Cohen, 1988)
6. Discussion
Most of the hypothesized relationships were verified. Use is explained by collaboration quality, information quality, and user satisfaction. Users’ satisfaction is explained by information quality, e-learning system quality, instructor attitude toward e-learning, diversity in assessment, and learner interaction with others. Individual impacts on learning usage are determined by use of e-learning systems, user satisfaction, and system quality. Although collaboration quality does not determine user satisfaction or individual impacts, and service quality determines none of the e-learning success dimensions, learner computer anxiety was found significant to satisfaction (Table 4).
The study indicates that collaboration quality positively influences e-learning systems’ use (H1b), and that collaboration quality of e-learning therefore systems appears to be an important success factor. If available, collaborative features are used by the users, achieving a greater overall satisfaction with e-learning. Therefore, providing additional collaboration capabilities and improving existing ones may directly increase use and user perceived satisfaction, and hence the individual impact. Similar results were found in employee portal usage and e-learning usage (Urbach et al., 2010a; Wang, 2003). Results indicate that service quality (H2) has no significant impact on user satisfaction, use, and individual impact. This finding is consistent with the results reported by other authors (Chiu, Sun, Sun, & Ju, 2007; Choe, 1996; Urbach et al., 2010), although a study conducted in Brazil found different results (Machado-Da-Silva et al., 2014). These authors found a statistically significant impact of service quality on use ( = 0.56***) and on satisfaction
M
AN
US
CR
IP
T
AC
CE
PT
ED
20 ( = 0.63***). This might be due to the sample differences. In our study participants were all in university programs, whereas the other study sample had learners from various levels of instruction. The results confirm hypotheses H3b and H3c, that information quality has a positive impact on use and on user satisfaction, corroborating similar results on e-learning systems success (Aparicio et al., 2017; Machado-Da-Silva et al., 2014; Ramírez-Correa, Rondan-Cataluña, Arenas-Gaitán, & Alfaro-Perez, 2017). Another study also found that the access to resource contents predicted success (Bandeira, dos Santos, Ribeiro, & Neto, 2016). Hypotheses H4a and H4c are validated; system quality is positive and statistically significant on user perceived satisfaction, and on individual impacts. Similar results were found in e-learning studies, and employee portal, in ERP usage satisfaction. In these studies system quality also had a positive impact on user satisfaction, and system quality was not significant in these systems’ use (Aparicio et al., 2017; Costa et al., 2016; McGill & Klobas, 2005; Urbach et al., 2010 a). Machado-da-Silva et al. (2014) found no significant impact of system quality on use, or on satisfaction. The impact of learner computer anxiety on satisfaction (H5) was not found significant, which is at odds with Sun et al.’s (2008) findings. One reason for that is that students today might not feel as anxious toward technology usage. It is likely that the last generations are more familiarized with digital platforms, or because 99% of the respondents had at least a two-year college degree.Instructor attitude toward e-learning, diversity assessment, and learner perceived interaction with others have a positive impact e-learner satisfaction (H6, H7, and H8). These findings corroborate Sun et al.’s (2008) results. Many assessment methods allow the instructors to establish the effects of learning, and different aspects of education can be more effective. As for the students, diversified rating methods are motivational factors, as evidenced by the efforts of students, engaging them in e-learning activities. Communication functionalities may also allow instructors to engage more students, and students themselves can interact more easily with their peers. Results show evidence that user satisfaction has a positive impact on e-learning systems use (H9). Similar results were reported in other studies (Urbach et al., 2010a; Wu & Wang, 2006). E-learning systems use and user satisfaction have a positive impact on individual performance (H10, H11), and these findings are consistent with various studies (Aparicio et al., 2017; Urbach et al., 2010a; Wu & Wang, 2006). The significant impact of user perceived satisfaction on individual impacts supports the suggestion that user perceived satisfaction can serve as a valid substitute for individual impact (Iivari, 2005; Piccoli, Ahmad, & Ives, 2001). Our study demonstrates that
M
AN
US
CR
IP
T
AC
CE
PT
ED
21 collaboration, and information and system quality are determinant factors of e-learning systems success, and that instructor attitude, diversity in assessment, and learner interaction with others, are also determinants for e-learning success.6.1. Conclusions and implications
This article presents a theoretical background that includes IS success and e-learning systems satisfaction and success. Based upon theory, a model was proposed and validated empirically in Brazilian universities. This study demonstrates that use and user satisfaction are interdependent, and both have a positive impact on individual performance. The hypotheses developed (information quality, system quality, instructor attitude toward e-learning, diversity in assessment, and learner perceived interaction with others) explain the user perceived satisfaction. Collaboration quality, information quality, and user perceived satisfaction are important drivers for e-learning use. Collaboration quality, service quality, information quality, system quality, user perceived satisfaction, and use explain the individual impact. This Brazilian e-learning success model explains 52% of the variation of individual impacts.
This study presents two theoretical implications, as it contributes to information systems theory. Our model combines the information systems success theory of DeLone & McLean (1992, 2003) with e-learning systems satisfaction theory (Sun et al., 2008) and collaboration quality (Urbach et al., 2010a). As another theoretical contribution, this model validates information systems success theory for the case of e-learning systems usage in the context of Brazil.
The practical implications of this study bring insights to e-learning systems designers and providers. One such implication derived from this study is that e-learning platforms should provide technological features to enable a collaboration environment, an important aspect in e-learning systems success. According to our findings, stakeholders would benefit if considering collaboration modules in the platforms. As an example, technological platforms should allow the articulation of communication and collaboration between students, thereby influencing use and learners’ satisfaction. This study also implies that information quality has a significant impact on use and satisfaction, such as course contents. Content should be retrievable, useful, understandable, interesting, and reliable. Institutions should design various ways of
self-M
AN
US
CR
IP
T
AC
CE
PT
ED
22 assessment through quizzes, tests, and other ways of testing knowledge. Thus, providers would increase overall success level by investing in the contents of the course. From this study we also learned that if e-learning systems provide a variety of ways for learning assessment, and if learners interact with each other, it will lead to an increase of satisfaction. We found from this study that the perception of individual performance is due to the learners’ perceived system quality. If the system is easy to navigate and well-structured in terms of content and functionalities, it will increase satisfaction and usage of e-learning systems.6.2. Limitations and future research
The results indicate that the dimensions of DeLone & McLean, (2003), Sun et al., (2008) and Urbach et al., (2010) are not enough to fully capture the determinants of use, satisfaction, and success of e-learning. Thus, our study contributes to the advancement of theory development and serves as a basis for future research. Future research can be carried out using universities and colleges (public and private) conducting comparative studies of e-learning systems success at different levels, such as comparing the learners’ perceived impact with teachers’ perceived impact. Other specific research can evaluate learning when used in blended format (classroom and learning) and other studies in fully online format. The components of change of paradigm in e-learning, according to Liu & Hwang, (2010), are computer networks (e-learning), mobile devices and wireless communications, and device sensor technologies mobile and wireless communications (context-aware u-learning). A new system architecture of the learning environment is in progress: context-aware and u-learning. As a result, new research that takes into account such variables is recommended. Comparing the e-learning in different countries is also recommended for future studies.
References
Aggelidis, V. P., & Chatzoglou, P. D. (2012). Hospital information systems: Measuring end user computing satisfaction (EUCS). Journal of Biomedical Informatics, 45(3), 566–579. https://doi.org/10.1016/j.jbi.2012.02.009
Ahn, T., Ryu, S., & Han, I. (2004). The impact of the online and offline features on the user acceptance of Internet shopping malls. Electronic Commerce Research & Applications,
M
AN
US
CR
IP
T
AC
CE
PT
ED
23 Alraimi, K. M., Zo, H., & Ciganek, A. P. (2015). Understanding the MOOCs continuance: Therole of openness and reputation. Computers & Education, 80, 28–38. https://doi.org/10.1016/j.compedu.2014.08.006
Alsabawy, A. Y., Cater-Steel, A., & Soar, J. (2011). Measuring e-learning system success (Research in progress). Presented at the Proceedings of the 15th Pacific Asia Conference on Information Systems (PACIS 2011), Queensland University of Technology. 1–15. Al-Samarraie, H., Teng, B. K., Alzahrani, A. I., & Alalwan, N. (2017). E-learning continuance satisfaction in higher education: A unified perspective from instructors and students.
Studies in Higher Education, 1–17.
Amasha, M. A., & AbdElrazek, E. E. (2016). An M-Learning framework in the podcast form (MPF) using context-aware technology. International Journal Of Advanced Computer
Science And Applications, 7(12), 226–234.
Aparicio, M., Bacao, F., & Oliveira, T. (2014a). MOOC’s business models: Turning black swans into gray swans. Proceedings of the International Conference on Information Systems
and Design of Communication - ISDOC ’14, 45–49.
https://doi.org/10.1145/2618168.2618175
Aparicio, M., Bacao, F., & Oliveira, T. (2014b). Trends in the e-learning ecosystem: A
bibliometric study. In 20th Americas Conference on Information Systems, AMCIS 2014. Aparicio, M., Bacao, F., & Oliveira, T. (2016). Cultural impacts on e-learning systems’ success.
The Internet and Higher Education, 31, 58–70.
https://doi.org/10.1016/j.iheduc.2016.06.003
Aparicio, M., Bacao, F., & Oliveira, T. (2017). Grit in the path to e-learning success. Computers in
Human Behavior, 66, 388–399. https://doi.org/10.1016/j.chb.2016.10.009
Arbaugh, J. B. (2002). Managing the on-line classroom. Journal of High Technology Management
Research, 13(2), 203–223. https://doi.org/10.1016/S1047-8310(02)00049-4
Bandeira, M., dos Santos, N. B., Ribeiro, V. G., & Neto, W. P. G. (2016). Mineração de dados: A nova maneira de compreender o comportamento do usuário do ensino a distância. Blucher
Design Proceedings, 2(9), 2536–2548.
Barbeite, F. G., & Weiss, E. M. (2004). Computer self-efficacy and anxiety scales for an Internet sample: testing measurement equivalence of existing measures and development of new scales. Computers in Human Behavior, 20(1), 1–15.
Barclay, D., Higgins, C., & Thompson, R. (1995). The partial least squares (PLS) approach to causal modeling: Personal computer adoption and use as an illustration. Technology
Studies, 2(2), 285–309. https://doi.org/10.1017/CBO9781107415324.004
Benbya, H., Passiante, G., & Belbaly, N. A. (2004). Corporate portal: A tool for knowledge management synchronization. International Journal of Information Management, 24(3), 201–220. https://doi.org/10.1016/j.ijinfomgt.2003.12.012
Bento, F., Costa, C. J., & Aparicio, M. (2017). S.I. success models, 25 years of evolution. In 2017
12th Iberian Conference on Information Systems and Technologies (CISTI) (pp. 1–6).
M
AN
US
CR
IP
T
AC
CE
PT
ED
24 Brahmasrene, T., & Lee, J. W. (2012). Determinants of intent to continue using online learning: Atale of Two Universities. Interdisciplinary Journal of Information, Knowledge, and
Management.
Brislin, R. W. (1970). Back-translation for cross-cultural research. Journal of Cross-Cultural
Psychology, 1(3), 185–216.
Butzke, M. A., & Alberton, A. (2017). Estilos de aprendizagem e jogos de empresa: a percepção discente sobre estratégia de ensino e ambiente de aprendizagem. REGE-Revista de
Gestão, 24(1), 72–84.
Chang, J. C.-J., & King, W. R. (2005). Measuring the performance of information systems: A functional scorecard. Journal of Management Information Systems, 22(1), 85–115. Chauhan, A. (2014). Massive open online courses (MOOCS): Emerging trends in assessment and
accreditation. Digital Education Review, (25), 7–17.
Cheng, Y. M. (2011). Antecedents and consequences of e-learning acceptance. Information
Systems Journal, 21(3), 269–299. https://doi.org/10.1111/j.1365-2575.2010.00356.x
Chin, W. (1998). The partial least squares approach to structural equation modeling. Modern
Methods for Business Research, 295(2), 295–336.
https://doi.org/10.1016/j.aap.2008.12.010
Chin, W., & Newsted, P. (1999). Structural equation modeling analysis with small samples using partial least squares. In Statistical strategies for small sample research (pp. 307–341). Chiu, C. M., Sun, S. Y., Sun, P. C., & Ju, T. L. (2007). An empirical analysis of the antecedents of
web-based learning continuance. Computers and Education, 49(4), 1224–1245. https://doi.org/10.1016/j.compedu.2006.01.010
Choe, J. (1996). The relationships among performance of accounting information systems, influence factors, and evolution level of information systems. Journal of Management
Information Systems, 12(4), 215–239. https://doi.org/10.1080/07421222.1996.11518107
Chow, W. S., & Shi, S. (2014). Investigating students’ satisfaction and continuance intention toward e-learning: An extension of the expectation–confirmation model. Procedia-Social
and Behavioral Sciences, 141, 1145–1149.
Cohen, J. (1988). Statistical power analysis for the behavioral sciences, 2nd ed R Erlbaum. New
Jersey.
Costa, C. J., Ferreira, E., Bento, F., & Aparicio, M. (2016). Enterprise resource planning adoption and satisfaction determinants. Computers in Human Behavior, 63, 659–671.
https://doi.org/10.1016/j.chb.2016.05.090
Cronbach, L. J. (1951). Coefficient alpha and the internal structure of tests. Psychometrika, 16(3), 297–334. https://doi.org/10.1007/BF02310555
da Cruz Duran, M. R., & da Costa, C. J. (2016). Brazilian open university system: a public policy on distance learning education in Brazil (2005-2010). Revista Tecnología, Ciencia Y
M
AN
US
CR
IP
T
AC
CE
PT
ED
25 DeLone, W H, & McLean, E. R. (1992). Information systems success: The quest for the dependent variable. Information Systems Research, 3(1), 60–95. https://doi.org/10.1287/isre.3.1.60 DeLone, W H, & McLean, E. R. (2003). The DeLone and McLean model of information systems success: A ten-year update. Journal of Management Information Systems / Spring, 19(4), 9–30. https://doi.org/10.1073/pnas.0914199107DeLone, William H, & McLean, E. R. (2002). Information systems success revisited (pp. 2966– 2976). Presented at the System Sciences, 2002. HICSS. Proceedings of the 35th Annual Hawaii International Conference on IEEE.
Detlor, B. (2000). Corporate portal as information infrastructure: Towards a framework for portal design. International Journal of Information Management, 20(2), 91–101.
https://doi.org/10.1016/S0268-4012(99)00058-4
Dias, L. M. de P. (2008). A avaliação de contextos de aprendizagem organizacional por e-learning pelos diferentes estilos de aprendizagem individual. Retrieved from
https://repositorio.iscte-iul.pt/handle/10071/1510
Doll, W. J., & Torkzadeh, G. (1988). The measurement of end-user computing satisfaction. MIS
Quarterly, 12(2), 259–274. https://doi.org/10.1002/9781118785317.weom070002
Elkaseh, A. M., Wong, K. W., & Fung, C. C. (2016). Perceived ease of use and perceived usefulness of social media for e-learning in Libyan higher education: A structural equation modeling analysis. International Journal of Information and Education
Technology, 6(3), 192.
Felice, M. Di. (2009). Paisagens pós-urbanas: o fim da experiência urbana e as formas
comunicativas do habitar. São Paulo: Editora Annablume.
Fornell, C., & Bookstein, F. L. (1982). Two structural equation models: LISREL and PLS applied to consumer exit-voice theory. Journal of Marketing Research, 19(4), 440.
https://doi.org/10.2307/3151718
Fornell, C., & Larcker, D. F. (1981). Structural equation models with unobservable variables and measurement error: Algebra and statistics. Journal of Marketing Research, 18(3), 382– 388. https://doi.org/10.2307/3150980
Frankola, K. (2001). Why online learners drop out. Workforce, Oct (80), 52.
Gefen, D., Straub, D. W., & Boudreau, M.-C. (2000). Structural equation modeling and regression: Guidelines for Research Practice. Communications of the Association for Information
Systems, 4(October), 7. https://doi.org/10.1.1.25.781
George, P. P., Papachristou, N., Belisario, J. M., Wang, W., Wark, P. A., Cotic, Z., Car, L. T. (2014). Online eLearning for undergraduates in health professions: a systematic review of the impact on knowledge, skills, attitudes and satisfaction. Journal of Global Health,
4(1).
Haddad, S. R., & Oliveira, A. (2017). Perception of digital citizenship among poor adult and elderly users of "Telecentros"; in Belo Horizonte. In 2017 12th Iberian Conference on
Information Systems and Technologies (CISTI) (pp. 1–6).
M
AN
US
CR
IP
T
AC
CE
PT
ED
26 Haddad, S. R., Oliveira, A., & Cardoso, G. (2016). Framework for evaluation of digital citizenship among less favored population in Brazil. In 2016 11th Iberian Conference on InformationSystems and Technologies (CISTI) (pp. 1–8).
https://doi.org/10.1109/CISTI.2016.7521448
Hair, J. F. J., Hult, G. T. M., Ringle, C. M., & Sarstedt, M. (2014). A primer on partial least
squares structural equation modeling (PLS-SEM). (Vicki Knight, Ed.) (Vol. 1). Thousand
Oaks, California, EUA: Sage Publications, Inc. https://doi.org/10.1017/CBO9781107415324.004
Hassanzadeh, A., Kanaani, F., & Elahi, S. (2012). A model for measuring e-learning systems success in universities. Expert Systems with Applications, 39(12), 10959–10966. https://doi.org/10.1016/j.eswa.2012.03.028
Heinssen, R. K., Glass, C. R., & Knight, L. A. (1987). Assessing computer anxiety: Development and validation of the computer anxiety rating scale. Computers in Human Behavior, 3(1), 49–59.
Henseler, J. (2010). On the convergence of the partial least squares path modeling algorithm.
Computational Statistics, 25(1), 107–120. https://doi.org/10.1007/s00180-009-0164-x
Henseler, J., Ringle, C. M., & Sinkovics, R. R. (2009). The use of partial least squares path
modeling in international marketing (SSRN Scholarly Paper No. ID 2176454). Rochester,
NY: Social Science Research Network. Retrieved from http://papers.ssrn.com/abstract=2176454
Holsapple, C., & Lee‐Post, A. (2006). Defining, assessing, and promoting e‐learning success: An information systems perspective. Decision Sciences Journal of Innovative Education
4(1), 67–85. https://doi.org/10.1111/j.1540-4609.2006.00102.x
Huber, F., Herrmann, A., Meyer, F., Vogel, J., & Vollhardt, K. (2007). Kausal modellierung mit partial least squares: eine anwendungsorientierte einführung. Accident; Analysis and
Prevention, 68, 57–74. https://doi.org/10.1016/j.aap.2014.02.002
Iivari, N. (2005). The role of organizational culture in organizational change-identifying a realistic position for prospective IS research. ECIS 2005 Proceedings.
INEP. (2016). Sinopses estatísticas da educação superior, Graduação - INEP. Retrieved May 21, 2017, from http://portal.inep.gov.br/sinopses-estatisticas-da-educacao-superior
Johnson, P., & Duberley, J. (2013). Understanding management research - An introduction to
epistemology (Vol. 53). SAGE Publications.
https://doi.org/10.1017/CBO9781107415324.004
Johnson, R. D., Hornik, S., & Salas, E. (2008). An empirical examination of factors contributing to the creation of successful e-learning environments. International Journal of
Human-Computer Studies, 66(5), 356–369.
Kanfer, R., & Heggestad, E. D. (1997). Motivational traits and skills: A person-centered approach to work motivation. Research In Organizational Behavior, Vol 19, 1997, 19, 1–56. Lee, J.-K., & Lee, J.-H. (2005). The effect of learning management system quality and
self-regulated learning strategy on effectiveness of an e-Learning. The Journal of Information