INTRODUCTION
Shifts in the relative abundance of microalgae within phytoplankton communities define seasonal succes-sions of organisms belonging to different taxa. Phyto-plankton successions in natural waters of temperate regions have been well documented for decades
(Hutchinson 1967, Smetacek 1985, Cloern 1996). While a great variety of eukaryotic microalgae and cyano-bacteria usually coexist in the same water body in late spring and early summer, this diversity may drop drastically towards the end of summer, giving way to the mass development of cyanobacterial populations (Hutchinson 1961, Rocha et al. 2002).
© Inter-Research 2008 · www.int-res.com *Email: hgalvao@ualg.pt
Cyanobacterial blooms in natural waters in
southern Portugal: a water management perspective
Helena M. Galvão
1,*, Margarida P. Reis
1, Elisabete Valério
2, Rita B. Domingues
1,
Cristina Costa
1, Dulce Lourenço
3, Sílvia Condinho
3, Rute Miguel
1, Ana Barbosa
1,
Conceição Gago
4, Natália Faria
2, Sérgio Paulino
2, Paulo Pereira
21Faculdade de Ciências do Mar e do Ambiente (FCMA), Universidade do Algarve, Campus de Gambelas, 8005-139 Faro, Portugal 2National Health Institute Dr. Ricardo Jorge, Av. Padre Cruz, 1649-016 Lisboa, Portugal
3Águas do Algarve, S.A., Rua do Repouso n° 10, 8000-302 Faro, Portugal
4CCDR Algarve (Ambiente e Ordenamento), R. Dr. José de Matos n° 13, 8000-503 Faro, Portugal
ABSTRACT: This synthesis of 3 studies from 2 regions of southern Portugal (Alentejo and Algarve) was part of a workshop focusing on cyanobacteria held at the SAME 10. The first study monitored impacts of the large Alqueva dam on the Guadiana estuary since 1996, revealing changes in sediment load, nutrient regime and phytoplankton succession. Prior to dam construction, dense cyanobacterial blooms occurred in the upper estuary during summer and fall. After dam construction, chlorophyll concentration, phytoplankton diversity and abundances of cyanobacteria decreased, contrary to predictions. Mycrocystins remained at low levels in the seston and undetectable in water samples, except during summer 2003 when the particulate fraction contained 1 µg l–1, while
chlorophyll concentrations and abundances of potentially toxic cyanobacteria remained low. Algarve reservoirs studied since 2001 revealed differences in phytoplankton dynamics. In the western mesotrophic reservoirs (Bravura and Funcho), 40 to 50% of surface samples contained cyanobacter-ial concentrations of ≥2000 cells ml–1, while over 80% of samples from the eastern oligotrophic
reservoirs (Odeleite and Beliche) exceeded this value. Spring blooms were dominated by Oscillatori-ales in Odeleite and Beliche and by ChroococcOscillatori-ales in Bravura and Funcho. Bloom composition
seemed to depend on water temperature and management strategies, while toxin concentrations reflected the increased biomass of toxic species. Finally, phytoplankton communities and microcystin production in 5 Alentejo freshwater reservoirs were studied from May to December 2005 and April to July 2006. Cyanobacterial blooms occurred, with varying intensities, not only during summer but also occasionally in winter. Microcystins were detected in 23% of the samples (n = 51), but without correlation with cyanobacterial biomass. Although Microcystis aeruginosa seemed to be the major
producer of microcystins, other potentially toxic species were found. In summary, the varying pattern of cyanobacterial bloom occurrence and toxicity requires a systematic approach to monitoring programs for adequate risk assessment.
KEY WORDS: Cyanobacteria · Microcystins · Phytoplankton · Estuary · Freshwater reservoirs Resale or republication not permitted without written consent of the publisher
Contribution to AME Special 1 ‘Progress and perspectives in aquatic microbial ecology’
O
PEN
PEN
Alhough this pattern of seasonal succession can be assumed to be a general trend, phytoplankton dynam-ics are affected by a more complex scenario of internal and external driving factors, in which different species interact not only with each other but also with the environment, rendering any attempt at prediction or modeling particularly challenging. In the last few decades, a lot of effort has been invested in discerning which environmental factors control bloom formation, especially with respect to toxic species such as cyano-bacteria. Understanding the conditions that trigger toxic blooms of cyanobacteria in lakes, reservoirs and rivers is a complex quest, hindered by the lack of information on natural ecological relationships be-tween plankton populations.
Blooms of cyanobacteria have been repeatedly asso-ciated with eutrophication processes (Berg et al. 1987, Carmichael et al. 1988, Druvietis 1997, Pinckney et al. 1998, Codd 2000, Chorus 2005). Factors such as high water retention time in lakes and reservoirs, increased temperature, low N:P ratio, as well as surface radiation and wind conditions have been reported to influence bloom development (Carmichael 1996, Kononen et al. 1996, Kawara et al. 1998, Chorus & Bartram 1999). Most species preferentially occur in stable, well stratified water bodies that provide optimal conditions for their vertical migration. Species like Microcystis aeruginosa and Anabaena spp. contain intracellular
gas vesicles and become buoyant, accumulating on the water surface where they can be blown around by the wind, forming very dense stable scums that are easily detected by simple observation of the water reservoir from above (Dittmann & Wiegand 2006). In contrast, other species like Planktothrix spp. and Oscillatoria
spp. are more sensitive to high light conditions and usually tend to accumulate in deeper water layers or disperse homogeneously in the water column (Dittmann & Wiegand 2006).
Cyanobacterial blooms can be harmful to humans due to the ability of several bloom-forming species to synthesize highly toxic secondary metabolites: cyano-toxins (Dittmann & Wiegand 2006). Hepatotoxic micro-cystins are the most commonly found and widespread cyanotoxins. They are associated with several bloom-forming genera of cyanobacteria, including Microcys-tis, Anabaena, Anabaenopsis, Planktothrix, Nostoc, Hapalosiphon, Snowella, Woronichinia, and Oscillato-ria (Codd et al. 2005, Falconer 2005). However, not all
cyanobacteria are capable of toxin production. Differ-ent strains may produce differDiffer-ent types of toxins in dif-ferent quantities and at difdif-ferent rates along their growth cycle, while others are non-toxigenic (Sivonen & Jones 1999, Codd et al. 2005). These characteristics explain why the occurrence of toxic blooms in natural environments is, apparently, unpredictable.
Current awareness of hazards from toxic cyanobac-teria in different countries has made considerable progress due to cooperative programs between coun-tries and regions that are aimed towards implementing existing regulations (Chorus 2005). The prevention of harmful cyanobacterial blooms has been based on the assessment and minimization of eutrophication condi-tions, thus falling within the scope of the EU Water Framework Directive, which calls for a ‘good ecologi-cal status’ of public water resources by 2015.
A general picture of the extent of cyanobacterial and cyanotoxin occurrence is emerging from scientific research, preliminary surveys and on-going monitor-ing in many countries (Chorus 2005). In Portugal, awareness of potential health risks has led to several research projects on freshwater and estuarine micro-bial ecology in the southern regions of Alentejo and Algarve. Furthermore, a working group, coordinated by the Portuguese General Directorate for Health, was formed in 1995–1996 to present a proposal for a national monitoring program of cyanobacteria and cyanotoxins in freshwater reservoirs. Since then, vari-ous laboratories have been carrying out regular screening of cyanobacteria in many freshwater reser-voirs, alerting environmental and water management agencies to the more serious toxic occurrences and assessing the efficiency of water treatment processes in removing cyanobacteria and associated toxins.
The southwest region of the Iberian Peninsula is a semi-arid region with a Mediterranean climate where the dry season usually extends from May to September and annual precipitation averages ca. 500 mm. The concentration of rainy days defines a torrential regime, where years of extended droughts alternate with years of intense rain and floods. Water reservoir manage-ment is strongly limited by water availability, leading to several situations of high hydraulic residence time while new dam construction further restricts river flow. All these conditions influence the development of cyanobacterial blooms and aggravate their environ-mental and economic impact.
This paper presents 3 different case studies from Alentejo and Algarve. The studies were presented at a workshop on harmful algal blooms, focusing primarily on cyanobacteria, organized within the SAME 10 held in September 2007 in Faro, Portugal. The first study focuses on the Guadiana River estuary, which runs through both regions. The second study compares cyanobacterial dynamics in 4 freshwater reservoirs of the Algarve region (Bravura, Funcho, Odeleite and Beliche), and the third relates microcystin production with the community composition of cyanobacteria in 5 reservoirs from the Alentejo region (Alqueva, Alvito, Enxoé, Odivelas and Roxo). Although describing dif-ferent situations in terms of cyanobacterial occurrence
and toxicity, these 3 case studies represent comple-mentary approaches to understanding the complexity of cyanobacterial blooms in Portuguese environments.
IMPACT OF DAM CONSTRUCTION ON THE GUADIANA ESTUARY
The Guadiana River, running along the southern border between Portugal and Spain (Fig. 1), has the fourth largest drainage basin of all Iberian rivers (67 840 km2), but a series of dams have severely
restricted its freshwater flow by ca. 75%, and the construction of the large Alqueva dam increased flow regulation to up to 81% of the total catchment area (55 000 km2) starting in 2003.
Cyanobacterial blooms have been reported in the Guadiana River in association with seasons and/or years of low freshwater flow (Cabeçadas & Brogueira 1981, Oliveira 1985, 1991). Microbial ecology studies carried out from 1996 to 1998 showed a well-defined chlorophyll maximum in the upper estuary (Fig. 2), ca. 30 km upstream from the mouth of the river (Rocha et al. 2002, Domingues et al. 2005). This observation has been made in many temperate estuaries where estuar-ine circulation leads to the development of a maximum turbidity zone at the toe of the salt-wedge, upstream of which phytoplankton find optimal conditions for growth (Cloern 1987, 1996, 1999). Moreover, Rocha et al. (2002) indicated that high winter loads of nitrogen and phosphorus in the upper estuary were followed by silicate depletion during early spring caused by spring diatom blooms. This nutrient regime determined the phytoplankton succession from diatoms in early spring to chlorophytes, followed by cyanobacteria during sum-mer and fall (Rocha et al. 2002, Domingues et al. 2005).
Changes in freshwater flow lead to alterations in water quality and hydrography, thus affecting phytoplankton composition and succession. River flow after completion of the Alqueva dam was severely restricted even during winter months with high rainfall (Fig. 3). During the period of dam construction (1999 to 2000), the sediment load transported downstream increased dramatically, causing severe photolimitation for the phytoplankton and resulting in the absence of blooms and very low chlorophyll values throughout spring and summer. One exception occurred in April 2001, when chlorophyll reached a record high of 216 µg l–1due to an unknown
chain-forming centric diatom coinciding with a sharp decrease in seston when dam construction was termi-nated (Fig. 4). Afterwards, during the filling period of the reservoir (2002 to 2003), nutrient concentrations as well as cyanobacterial abundance increased, while diatom abundance remained low (Domingues et al. 2007). After this period, total phytoplankton abundance and succes-Fig. 1. Location of study sites: Guadiana estuary and freshwater reservoirs of
Alqueva, Alvito, Beliche, Bravura, Enxoé, Funcho, Odeleite, Odivelas and Roxo
0 10 20 30
Distance to river mouth (km) 0
2 4 6 8 10 12 14 16 18 20 22 24 26 28 30 32 34 36 Station s N D J F M A M J J A S O N D J F Chl a (µg l–1) 1996 1997 1998 P 1 2 3 4 5 6 7 8 9 10
Fig. 2. Interpolation plots showing the longitudinal and sea-sonal distribution of surface chl a concentrations at selected stations in the Guadiana estuary (P: river mouth, 1: Vila Real
sion followed the typical trend observed before dam filling. However, specific diversity and chlorophyll con-centrations decreased from 2002 to 2005 (Domingues & Galvão 2007).
Microcosm studies undertaken in 2005 to explain the phytoplankton community structure based on nutrient regime indicated that nitrogen limitation could have influenced phytoplankton succession (R. B. Domingues unpubl. data). However, this type of experiment was not designed to simulate an important factor, namely estuarine circulation. In fact, the salinity regime in the estuary was affected during dam filling and construc-tion due to the salt-wedge intrusion reaching further upstream, causing saltwater to be detected in the nor-mally freshwater upper estuary (ca. 70 km upstream from the river mouth). The phytoplankton community found in the upper estuary, including cyanobacteria, was composed strictly of freshwater species with lim-ited halotolerance. Therefore, an increase in salinity, particularly during late spring and early summer when maximum growth should occur, could
have had a deleterious impact resulting in lower chlorophyll values and species numbers after construction of the Alqueva dam.
Microcystins were detected in 1999, 2000, 2002 (Caetano et al. 2001, Sobrino et al. 2004), 2004 and 2005 (H. M. Galvão un-publ. data) in concentrations well below the World Health Organization (WHO) guideline for drinking water of 1 µg l–1
(WHO 1998). Microcystin levels re-mained low, even during cyanobacterial blooms with abundances of potentially toxic species, such as Microcystis aerugi-nosa, reaching 106 to 108 cells ml–1
(Caetano et al. 2001, Rocha et al. 2002). Microcystin concentrations higher than the WHO guideline were detected only once, on 25 July 2003, when values of 1.2 µg l–1were reached in Mértola (70 km upstream from the river mouth) and 6.8 µg l–1upstream from Mértola (C.
So-brino unpubl. data). Interestingly, these higher toxin levels were detected while total cyanobacteria counts, determined using epifluorescence microscopy (Haas 1982), were relatively low (maximum of 6× 10⁵ cells ml–1) and potentially toxic
genera such as M. aeruginosa registered
low abundance. However, these low total counts could have reflected a shift in predominance from chroococcoid species towards filamentous forms such as Oscil-latoria and Anabaena spp. with higher
specific biomass and potential toxin production. Further-more, other samples taken on 30 July 2003 (M. R. Reis unpubl. data) contained high numbers of M. aeruginosa
(> 6 × 10⁵cell ml–1) and potentially toxic filamentous
forms (>1 × 10⁵cells ml–1). Bathing and fishing in this
area were forbidden by health authorities during July and August 2003 because high toxin concentrations persisted for several weeks.
Cyanobacterial blooms in freshwater reservoirs in the Algarve region
In the Algarve, strong demographic changes induced by tourism have led to the building of several freshwater reservoirs in order to ensure the water quantities required for activities such as agriculture, golf, landscaping and human consumption. Thus, from 2000 onwards, there was a shift from groundwater to surface water as a source of drinking water.
0 50 100 150 200 250 300 0 500 1000 1500 2000 2500 3000 3500 4000 4500 5000 R a in fa ll ( m m ) R iver f lo w ( m 3s –1) River flow Rainfall 1996 1997 1998 1999 2000 2001 2002 2003 2004 2005
I
I
Fig. 3. Monthly river flow volume (Pulo do Lobo upstream from Mértola, mean values) and total monthly rainfall (Alcoutim) from 1996 to 2005 in the upper Guadiana estuary (data source: www.inag.pt/SNIRH/). The arrow marks the
dam construction and filling period
Fig. 4. Seston and chl a concentrations in surface water samples from 1997 to 2001 at the Alcoutim station in the upper Guadiana estuary. The arrow marks the dam construction period. Gaps in the data reflect periods without regular
In western Algarve, the main reservoir used for drinking water production is Funcho (Fig. 1), while water removal from Bravura is seasonal, usually occurring from May to October. The eastern Algarve is supplied by water from Beliche, which is connected to the Odeleite reservoir by underwater sluices that regulate the flow from Odeleite to Beliche and which are usually opened in spring and closed in autumn. Basic information about location and dimension of the 4 main reservoirs in the Algarve is compiled in Table 1.
These reservoirs have been subject to standard physical, chemical and microbiological water quality monitoring since 1996 and, since 2001, to simultaneous monitoring of phytoplankton and cyanobacteria toxins. We organized all collected data into 2 types of data-base: one containing a long-term data series of physi-cal and chemiphysi-cal variables and one with a shorter data series, but including biological data and diversity indices like Shannon diversity, eveness, Berger-Parker dominance (Berger & Parker 1970) and species rich-ness (Magurran 1988). For the present study, multivari-ate analysis of these data sets was carried out in order to assess the main factors triggering cyanobacteria blooms.
Relative abundances of cyanobacteria and micro-cystin concentrations obtained over a 2.5 yr period in the western and eastern Algarve are illustrated in Figs. 5 & 6, respectively. In the western reservoirs, 40 to 50% of the water samples contained cyanobacterial concentrations higher than the WHO alert level 1 for raw waters (≥2000 cells ml–1). However, more than
80% of the samples in Odeleite and Beliche exceeded this alert level. Furthermore, 13 to 17% of all analyzed samples presented concentrations of > 20 000 cells ml–1, but WHO alert level 2 (≥100 000 cells ml–1) was
only occasionally exceeded in Funcho in 2001, 2002 and 2005, when Microcystis spp. reached >106 cells
ml–1. Microcystin concentrations were always
negligi-ble with respect to human health risk, only exceeding WHO guideline value of 1 µg l–1in scums of a winter
bloom detected in Funcho in 2002, and in bottom sam-ples of a spring bloom detected in Beliche in 2004.
Cyanobacterial blooms occurred during the dry as well as during the rainy season, and no evident rela-tionship between weather conditions and bloom oc-currence was found. Data analyses of monthly water column profiles for temperature and oxygen concen-trations revealed strong differences in the stratification of the 4 reservoirs (M. R. Reis unpubl. data), probably related to the different water management strategies. While Funcho reservoir behaved as a warm monomic-tic lake with winter destratification occurring only from December to February, the Bravura water column
tended to destratify 2 mo earlier and stratify 2 to 3 mo Reser
voir Str eam W atershed Catchment Latitude Longitude Y ear of Max. water T otal Flooded Mean anual ar ea (° N) (° W) closur e column volume sur face pr ecipitation (km 2) height (m) (× 10 6m 3) (ha) (mm) Algar ve Bravura Ribeira de Odiáxer e Ribeiras do Algar ve 76.58 37° 1 2’ 6’ ’ 8° 41’ 52’ ’ 1952 23 35 285 821 Funcho Arade Arade 212.59 37° 1 5’ 46’ ’ 8° 22’ 57’ ’ 1993 31 48 360 744 Odeleite Ribeira de Odeleite Guadiana 347.51 37° 1 9’ 52’ ’ 7° 29’ 11’ ’ 1996 30 130 720 722 Beliche Ribeira de Beliche Guadiana 98.47 37° 1 6’ 35’ ’ 7° 30’ 33’ ’ 1986 30 48 292 644
Alentejo Alqueva Guadiana
Guadiana 55 289.00 38° 1 1’ 50’ ’ 7° 29’ 43’ ’ 2002 22 4150 25 000 593 Alvito Ribeira do Alvito Sado 210.77 38° 1 6’ 44’ ’ 7° 54’ 37’ ’ 1968 25 132 1480 640 Odivelas Ribeira de Odivelas Sado 431.88 38° 1 1’ 05’ ’ 8° 06’ 55’ ’ 1972 12 96 973 622 Enxoé Ribeira de Enxoé Guadiana 61.15 37° 5 9’ 38’ ’ 7° 27’ 55’ ’ 1998 10 10 – 555 Roxo Ribeira do Roxo Sado 351.1 37° 5 5’ 47’ ’ 8 ° 0 4’ 55’ ’ 1967 14 96 1378 559 T
able 1. Location and dimensions of Algar
ve and Alentejo fr
eshwater r
eser
later. This difference could only be explained by the artificial reinforcement of the Funcho ther-mocline, caused by year-round cold water removal from the hypolimnion for drinking water production.
Concerning the 2 eastern reservoirs, manage-ment of the underground channel between Odeleite and Beliche artificially induced a polymictic behavior that can also be associated with conditions favouring blooms of filamentous cyanobacteria through the resuspension of bot-tom sediment and nutrients. This hydraulic reg-ulation may also have caused differences in the observed phytoplankton succession. The eastern reservoirs (Odeleite and Beliche) systematically developed mixed cyanobacterial blooms of Nos-tocales and Oscillatoriales in late spring, which
were then gradually replaced by Chroococcales.
However, in 2005, the channel between Odeleite and Beliche was opened earlier because of a severe drought. Nutrients and akinetes were resuspended in cold waters unfavourable for
Nostocales blooms. During this drought, Chro-ococcales dominated spring blooms even in the
eastern reservoirs.
Based on the dominance of cyanobacteria, all 4 reservoirs could be considered eutrophic, but based on soluble reactive phosphorus (SRP) and dissolved inorganic nitrogen (DIN) concentra-tions, the western reservoirs (Bravura and Fun-cho) would be classified as slightly mesotrophic and the eastern (Odeleite and Beliche) as oligo-trophic. Frequent cyanobacterial blooms occur-ring in oligotrophic reservoirs are in contra-diction with most published reports, which cor-relate bloom formation with eutrophication or low N:P ratios (Chorus 2001).
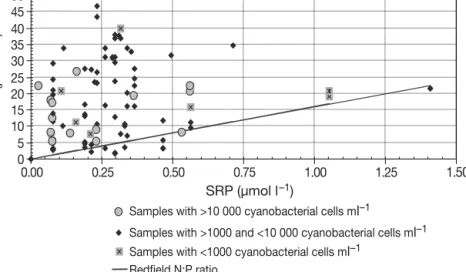
Fig. 7 illustrates how blooms and associated DIN:SRP ratios in Funcho were related to the Redfield ratio of 16N:1P. In fact, DIN never exceeded the desirable limit for a lake in an arid region (US Environmental Protection Agency standard, www.epa.gov/waterscience/criteria/ nutrient) in the eastern reservoirs. In the western reservoirs, this value was only exceeded occa-sionally in winter. In view of potential SRP-limita-tion, cyanobacterial blooms during summer were generally not linked to SRP levels, except for the 2002 winter bloom.
Fig. 5. Relative abundances of cyanobacteria in the Western Algarve reservoirs, (a) Bravura and (b) Funcho. Arrows show samples positive for microcystins; values beside arrows represent microcystin
concentrations (ng l–1)
Fig. 6. Relative abundances of cyanobacteria in the Eastern Algarve reservoirs (a) Odeleite and (b) Beliche. Arrows show samples positive for micro-cystins; values beside arrows represent microcystin
Exclusive use of physical and chemical data in multi-variate analysis of bloom dynamics was not sufficient to discriminate bloom conditions (Reis 2005). This led to the inclusion of biological variables in multivariate analysis of bloom dynamics. Using methods such as distance based redundancy analysis (db-RDA), summer Chro-ococcales blooms could be associated with increased
temperature while the winter Aphanizomenon flos-aquae bloom was associated with increased SRP. Trend
analysis through dynamic factor analysis (Zuur et al. 2003) applied to biological variables revealed no sea-sonal pattern and a tendency towards decreasing fre-quency and density of cyanobacterial blooms. This could be related to the fact that these reservoirs are relatively young water bodies that have not yet developed a stable food web with effective top-down control (Reis 2005).
Cyanobacterial blooms and associated microcystins in freshwater reservoirs in the Alentejo region The occurrence of microcystins in Portuguese fresh-water resources has been mostly associated with blooms of Microcystis aeruginosa, although other
potentially toxic species also occur (Vasconcelos 1993, 1994, 2001, Vasconcelos et al. 1996, Pereira et al. 2001, Vasconcelos & Pereira 2001, Moreno et al. 2003, Saker et al. 2005). A wide range of microcystin concentra-tions have been encountered in many Portuguese rivers and reservoirs, though most reports are based on the sporadic analysis of environmental samples taken at the time of a bloom event, rather than on a system-atic survey of aqusystem-atic ecosystems.
In this study, cyanobacteria and micro-cystins were monitored in 5 Portuguese freshwater reservoirs over 2 consecutive time periods, from May to December of 2005 and from April to July of 2006. This was intended to evaluate changes in microcystin concentrations and persis-tence with respect to variations in cyanobacterial assemblages and bio-mass throughout the sampling period. Table 1 lists some basic information about each of the 5 reservoirs included in the study (Alqueva, Alvito, Enxoé, Odivelas and Roxo), while Fig. 1 shows their location.
Results concerning phytoplankton abun dance and microcystin concen-trations found in each reservoir during the monitoring period are shown in Fig. 8. The occurrence of cyanobacteria seemed to follow a seasonal pattern in most reservoirs, with major peaks being detected during summer periods and lower cell densities during cold periods. Although this appeared to be a general trend, the different reser-voirs also showed varying patterns in terms of bloom-forming species abundance, biomass and toxi-city. In Alqueva, a noticeable shift in phytoplankton composition towards cyanobacterial dominance was observed from July to October 2005. After being replaced by chlorophytes and cryptophytes during spring 2006, cyanobacteria dominated the phyto-plankton again in July 2006. Microcystis aeruginosa
and Anabaena circinalis were the predominant
bloom-forming species, accounting for 11 to 100% and 3 to 58% of total cyanobacterial biomass, respec-tively. However, although both potentially toxic spe-cies reached high cell densities, microcystins were not detected throughout the sampling period.
A different pattern was observed in the Alvito reser-voir, where microcystins were detected in several samples containing high counts of cyanobacteria. Al-though different bloom-forming species were found, toxin concentrations were better correlated with Mi-crocystis aeruginosa biomass than with total
cyanobac-terial biomass. In fact, Anabaena circinalis dominated
the cyanobacterial assemblage from July to August 2005, subsequently being replaced as a dominant spe-cies by Aphanizomenon flos-aquae, which formed an
extremely dense bloom in September. During this pe-riod, the relative contribution of M. aeruginosa to the
overall cyanobacterial community never exceeded 4% of total cell counts, and microcystins remained below 1.10 µg l–1. However, an increase in toxin
concentra-tion in October was associated with a change in bloom 0 5 10 15 20 25 30 35 40 45 50 0.00 0.25 0.50 0.75 1.00 1.25 1.50 SRP (µmol l–1)
Samples with >10 000 cyanobacterial cells ml–1
Samples with >1000 and <10 000 cyanobacterial cells ml–1 Samples with <1000 cyanobacterial cells ml–1
Redfield N:P ratio
DIN (µmol l
–1
)
Fig. 7. Relation between cyanobacterial cell concentration and molar propor-tions of dissolved inorganic nitrogen (DIN) to soluble reactive phosphorus (SRP) in the Funcho reservoir in western Algarve (July 2001 to June 2004).
composition, with abundances shifting towards M. aeruginosa dominance. Although cyanobacteria were
present in much lower total cell counts, microcystins reached a maximum of 2.58 µg l–1during this period.
In Enxoé, 2 phytoplankton blooms were observed throughout the sampling period. The first one occurred in September 2005, following a steady increase in cyanobacterial biomass throughout the summer period. The second bloom occurred in May 2006, when an extremely high abundance of cyanobacteria occurred after a period of low cell counts during win-ter. Both blooms were dominated by Planktothrix spp.
However, microcystins were only detected during the second bloom. Interestingly, no cyanobacteria were
found in June 2006, just one month after the major peak in toxic cyanobacteria. Subsequently, Plankto-thrix spp. dominated again in July and microcystins
were below detection limits, similar to the pattern observed in the previous year. In fact, microcystin con-centrations did not even co-vary with Planktothrix spp.
cell counts during the 2006 toxic bloom, when no other potentially toxic species were found.
In Odivelas, 2 distinct cyanobacterial blooms also occurred, but with a different species composition. In August 2005, 3 different species of Aphanizomenon
spp. predominated, contributing ca. 40% of the total cyanobacterial counts. Other species, such as Ana-baena spp. and Microcystis aeruginosa, were also
Fig. 8. Phytoplankton abundances and microcystin con-centrations in the 5 Alentejo reservoirs. Values above arrows
detected, but with much lower relative abundances (12 and 14% of total cyanobacterial counts, respectively). One month later, predominance shifted sharply to-wards M. aeruginosa, with abundances increasing
from 6500 cells ml–1in August to 131 000 cells ml–1in September, representing ca. 50% of total cyanobac-terial cell counts. Microcystin concentrations detected in the Odivelas reservoir were associated with high
M. aeruginosa cell counts and reached a maximum of
0.5 µg l–1 in September 2005. This M. aeruginosa
bloom was followed in October by an Aphanizomenon
spp. bloom, during which M. aeruginosa abundance
decreased to <1300 cells ml–1. Cyanobacteria were not
observed during winter, but dominated the phyto-plankton in the following spring with a different spe-cies composition. In fact, cyanobacterial blooms were mainly composed of Microcystis wesenbergii from
April to May 2006, while microcystins were not detected.
In the Roxo reservoir, high cyanobacterial counts occurred from July to December 2005. Two cyano-bacteria species dominated successively: Microcystis incerta in July and August (ca. 60% of the total
cyano-bacterial cell counts), followed by Planktothrix sp. from
September until December. High levels of microcystins were only detected at the onset of the Planktothrix sp.
bloom in September 2005. In 2006, cyanobacterial blooms did not occur until July, when Planktothrix sp.
reached abundances of 15 500 cells ml–1.
DISCUSSION
The 3 studies presented here used different yet com-plementary approaches towards understanding the complexity of cyanobacterial bloom dynamics in differ-ent ecosystems subject to differdiffer-ent sets of varying environmental constraints, which represent a major challenge for implementing adequate water manage-ment strategies.
The first study addressed the impact of a recently constructed dam on phytoplankton succession and cyanobacterial blooms in the Guadiana upper estuary and focussed on changes in hydrography and sediment load as well as light and nutrient regime. The second study examined cyanobacterial bloom dynamics in dif-ferent freshwater reservoirs in the Algarve region in an attempt to discern general patterns in bloom occur-rence as well as triggering factors. The third study evaluated seasonal changes in microcystin concentra-tions in relation to shifts in cyanobacteria species dominance, in terms of abundance and biomasses, in 5 freshwater reservoirs in the Alentejo region. Taken as a whole, these studies emphasize the need for a com-prehensive approach towards understanding
cyano-bacterial bloom dynamics and toxin production in natural environments in order to correctly assess po-tential risk and outline adequate monitoring programs. Initially, the impact of the Alqueva dam on phyto-plankton dynamics was predicted to increase the pre-dominance of cyanobacteria with a higher potential toxicity (Rocha et al. 2002). Instead, both cyanobacter-ial abundance and numbers of toxic species tended to decrease in 2003, after the period of dam construction and filling. Cyanobacterial peak abundances during summer and fall remained well below the maximum cell counts observed prior to dam construction in 1996 and 1997 (107 to 108cells ml–1), probably due to the
interaction of several environmental factors such as photolimitation resulting from increased sediment load and haloinhibition due to deeper intrusion of saltwater in the upper estuary.
Data from the Guadiana estuary collected since 1996 revealed that, in the upper estuary, the seasonal suc-cession of phytoplankton populations generally led to a predominance of cyanobacteria in the summer and fall, which could be explained by the nutrient regime (Rocha et al. 2002). Thus, silica depletion caused the demise of diatom blooms followed by increased abun-dance of chlorophytes in mid-spring. By the end of spring, nitrogen limitation favoured the predominance of small unicellular cyanobacteria from early summer to mid-fall. However, the construction of the Alqueva dam, which further restricted freshwater flow, caused changes in the nutrient regime with increased silica concentrations (Domingues et al. 2007), sediment load and saltwater intrusion in the upper estuary. In fact, estuarine circulation has probably been affected to such a degree that both the maximum turbidity zone and associated chlorophyll maximum no longer consti-tute well-defined features in the estuary. Unfortu-nately, slackwater runs (sampling following tidal excursion upstream during the slackwater phase), which enable proper delineation of longitudinal and vertical profiles, have not been regularly performed since 1998 due to lack of funding. However, a more recent project, financed by the Portuguese National Science Foundation (FCT), resumed this sampling program in 2008.
The freshwater reservoir studies demonstrated that different types of cyanobacterial blooms had diverse origins, while no clear seasonal pattern for cyanobac-terial abundances was found. In the Algarve reser-voirs, multivariate analysis was a useful tool to inter-pret reservoir dynamics with respect to water quality (Reis 2005). Cyanobacterial dominance in those reser-voirs was not always associated with the nutrient regime, but summer blooms were related to high water temperatures. Water management strategies and water removal level affected water column
stratifica-tion, thus affecting phytoplankton dynamics and cyanobacterial blooms. In the western reservoirs, the enhancement of water column stratification, caused by the removal of cold water from the hypolimnion, led to the export of nutrients and produced a chemostat-like system for the growth of Chroococcales. In fact, the
maintainenance of a warm water surface layer posi-tively selected for cyanobacteria and produced pro-longed summer blooms. In the eastern reservoirs, mix-ing of artificial sprmix-ing water caused by water level management strategies was associated with late spring blooms of Nostocales and Oscillatoriales, probably due
to nutrients and akinete resuspension.
Meteorological conditions such as temperature and radiation could not be associated with total cyano-bacterial abundances but only with particular bloom-forming species. Furthermore, trend analyses revealed that the abundance of bloom species decreased in both oligotrophic and mesotrophic reservoirs, perhaps due to increased top-down control. Finally, SRP limitation did not seem to affect summer blooms of cyanobac-teria. Time series analyses (Legendre et al. 1985, Zuur et al. 2003) could be a useful tool for determining selective mechanisms which affect phytoplankton composition and dominance of cyanobacterial species. However, existing time series lack important ecologi-cal data such as competition, viral abundance, preda-tion rates and selective predator abundance, which hinders the predictive accuracy of models for phyto-plankton dynamics.
Independent of environmental constraints, the Alen-tejo reservoir study showed that microcystin concen-trations in natural waters were not always related to cyanobacterial biomass or even to the abundance of potencially toxic species. Microcystin concentrations found in Alvito and Odivelas, for example, were related to Microcystis aeruginosa cell counts,
suggest-ing that primarily this species was responsible for toxin production in these reservoirs. However, no micro-cystins were detected in Alqueva, despite the presence of M. aeruginosa. In Roxo, microcystins were only
detected in high levels during the onset of the Plank-tothrix sp. bloom in September 2005. However, no
microcystins were found in the following months, despite the prevalence of high abundances of Plank-tothrix sp. In Enxoé, microcystins were only detected
in one Planktothrix sp. bloom, yet toxin concentrations
did not follow Planktothrix sp. cell counts during the
bloom.
Variations in toxin production between and within cyanobacterial species are well known from laboratory studies based on isolated strains (Rapala et al. 1997, Kameyama et al. 2004, Welker et al. 2004, Saker et al. 2005). Furthermore, blooms may be composed of cyanobacterial assemblages producing different toxins
at different rates, while the same bloom-forming spe-cies can occur as both toxic and non-toxic forms, which are impossible to differentiate based on morphological examination. In fact, all reservoirs included in this study showed very sharp changes in cyanobacterial abundance, whereas marked differences in toxicity were observed both between blooms and within the same bloom. These observations emphasize the irreg-ular pattern of cyanobacterial blooms and cyanotoxin production. Consequently, there is a pressing need for the implementation of systematic monitoring programs of cyanobacteria and cyanotoxins in natural waters in order to minimize potential health risks to animal and human populations resulting from exposure through drinking water and recreational activities.
CONCLUSIONS
The need for better integration of ecological aspects in water quality assessment is generally accepted, but the European Union Directive (http://ec.europa.eu/ environment/water/water-framework/) that encom-passes measures for protection of the ecological quality of waters is far from being fully implemented. System-atic approaches to reservoir ecology should lead to the establishment of ecological water quality criteria, which in turn should help to outline adequate monitor-ing programs with specific time-scale adjustments, depending on the ecosystem. Ecological water quality criteria should be useful not only in promoting envi-ronmental conservation and rehabilitation but also as a tool for raw water management, allowing, for instance, drinking water treatment plants to more efficiently adjust their technologies for the removal of Cyanobac-teria and cyanotoxins.
Acknowledgements. The Guadiana estuary monitoring was funded by a series of projects 16/REGII/6/96 and 15/ REGII/6/96 (INTERREGII program), EMERGE (ODIANA re-gional program), project nr. 45 (Risk evaluation of toxic blooms in lower Guadiana) from LEADER+ program. We also thank A. Matthiensen, C. Rocha, and C. Sobrino for contributing to dif-ferent parts of this study at difdif-ferent times. R. Domingues ac-knowledges PhD Grant SFRH/BD/27536/2006 and E. Valério PhD Grant SFRH/BD/8272/2002 from the Portuguese Science and Technology Foundation (FCT). Algarve reservoirs were studied within the framework of 4 research projects, namely CIANOTOX (2001 to 2004), funded by the regional water management company Águas do Algarve, S.A., and CIANOALERTA I, II and III (2003 to 2008) funded through IN-TERREG IIIA, contracts n° SP5/P35/01, SP5/P19/02 and SP5/P138/03 in collaboration with Águas do Algarve, the re-gional coordination commission CCDR-Algarve (Portugal), University of Huelva and the Southern Spain water manage-ment company GIAHSA (Spain). H.M.G., M.P.R. and P.P. coor-dinated the composition of the manuscript. H.M.G. coordi-nated and A.B., S.C., R.B.D., R.M. and M.P.R. participated in
the Guadiana estuary study. M.P.R. coordinated the research and D.L., S.C., R.M., C.C. and C.G. participated in the Algarve reservoir study. P.P. coordinated and E.V., N.F. and S.P. partic-ipated in the Alentejo reservoir study.
LITERATURE CITED
Berg K, Carmichael WW, Skulberg OM, Benestad C, Under-dal B (1987) Investigation of a toxic-water bloom of Micro-cystis aeruginosa (Cyanophyceae) in Lake Akersvatn, Norway. Hydrobiologia 144:97–103
Berger WH, Parker FL (1970) Diversity of planktonic Forami-nifera in deep sea sediments. Science 168:1345–1347 Cabeçadas G, Brogueira MJ (1981) Notas sobre a qualidade
da água do Rio Guadiana. Instituto Nacional de Investi-gação das Pescas e do Mar, Lisboa (in portuguese) Caetano S, Miguel R, Mendes P, Galvão H, Barbosa A (2001)
Cyanobacteria blooms and cyanotoxin occurrence in the Guadiana (SE-Portugal) — Preliminary results. Ecotox Environ Restor 4:53–59
Carmichael WW (1996) Toxic Microcystis and the environ-ment. In: Watanabe MF, Harada KI, Carmichael WW, Fujiki H (eds) Toxic microcystis. CRC Press, Boca Raton, FL, p 1–11
Carmichael WW, Min-Juan Y, Zheng-Rong H, Jia-Wan H, Jia-Lu Y (1988) Occurrence of the toxic cyanobacterium (blue-green alga) Microcystis aeruginosa in central China. Arch Hydrobiol 114:21–30
Chorus I (2001) Cyanotoxins: occurrence, causes, conse-quences. Springer Verlag, Berlin
Chorus I (2005) Current approaches to cyanotoxin risk assessment, risk management and regulations in different countries. Federal Environmental Agency, Dessau-Roßlau Chorus I, Bartram J (1999) Toxic cyanobacteria in water — a guide to their public health consequences, monitoring and management. E & FN Spon, London
Cloern JE (1987) Turbidity as a control on phytoplankton biomass and productivity in estuaries. Cont Shelf Res 7: 1367–1381
Cloern JE (1996) Phytoplankton bloom dynamics in coastal ecosystems: a review with some general lessons from sus-tained investigation of San Francisco Bay, California. Rev Geophys 34:127–168
Cloern JE (1999) The relative importance of light and nutrient limitation of phytoplankton growth: a simple index of coastal ecosystem sensitivity to nutrient enrichment. Aquat Ecol 33:3–16
Codd GA (2000) Cyanobacterial toxins, the perception of water quality, and the prioritisation of eutrophication control. Ecol Eng 16:51–60
Codd GA, Morrison LF, Metcalf JS (2005) Cyanobacterial toxins: risk management for health protection. Toxicol Appl Pharmacol 203:264–272
Dittmann E, Wiegand C (2006) Cyanobacterial toxins — occurrence, biosynthesis and impact on human affairs. Mol Nutr Food Res 50:7–17
Domingues RB, Galvão H (2007) Phytoplankton and environ-mental variability in a dam regulated temperate estuary. Hydrobiologia 586:117–134
Domingues RB, Barbosa A, Galvão H (2005) Nutrients, light and phytoplankton succession in a temperate estuary (the Guadiana, south-western Iberia). Estuar Coast Shelf Sci 64:249–260
Domingues RB, Sobrino C, Galvão H (2007) Effects of reser-voir filling on phytoplankton succession and cyanobacte-ria blooms in a temperate estuary. Estuar Coast Shelf Sci
74:31–43
Druvietis I (1997) Observations on cyanobacterial blooms in Latvia’s Inland. In: Reguera B, Blanco J, Fernández ML, Wyatt T (eds) Harmful algae. Xunta de Galicia, Intergov-ernamental Oceanographic Commision of UNESCO, Vigo, p 35–36
Falconer IR (2005) Cyanobacterial toxins of drinking water supplies—cylindrospermopsins and microcystins. CRC Press, Boca Raton, FL
Haas LW (1982) Improved epifluorescence microscopy for observing planktonic microorganisms. Ann Inst Oceanogr 58:261–266
Hutchinson GE (1961) The paradox of the plankton. Am Nat 95:137–145
Hutchinson GE (1967) A treatise on limnology. John Wiley & Sons, New York
Kameyama K, Sugiura N, Inamori Y, Maekawa T (2004) Characteristics of microcystin production cell cycle of Microcystis viridis. Environ Toxicol 19:20–25
Kawara O, Yura E, Fujii S, Matsumoto T (1998) A study on the role of hydraulic retention time in eutrophication of the Asahi river dam reservoir. Water Sci Technol 37: 245–252 Kononen K, Kuparinen J, Makela K, Laanemets J, Pavelson J, Nömmann S (1996) Initiation of cyanobacterial blooms in a frontal region at the entrance to the Gulf on Finland, Baltic Sea. Limnol Oceanogr 41:98–112
Legendre P, Dallot S, Legendre L (1985) Succession of species within a community: chronological clustering, with appli-cations to marine and freshwater zooplankton. Am Nat 125:257–288
Magurran A (1988) Ecological diversity and its measurement. Princeton University Press, Princeton, NJ
Moreno I, Cameán A, Tavares MJ, Pereira P, Franca S (2003) Toxicity of cyanobacteria isolated from the Guadiana River. Aquat Ecosyst Health Manag 6:409–413
Oliveira MR (1985) Relatório dos estudos biológicos realiza-dos no Rio Guadiana e na estação. de tratamento de águas da vila de Mértola. Relatório Técnico e Científico do IPIMAR, Lisboa (in portuguese)
Oliveira MR (1991) Eutrofização do Rio Guadiana. Blooms de cyanophyceae e influência na ictiofauna. Relatório Técnico e Científico do INIP, Lisboa (in portuguese) Pereira P, Onodera H, Andinolo D, Franca S, Araújo F, Lagos
N, Oshima Y (2001) Co-occurrence of PSP toxins and microcystins in Montargil freshwater reservoir, Portugal. In: Hallegraeff GM, Blackburn SI, Bolch CJ, Lewis RJ (eds) Harmful algal blooms 2000. IOC, UNESCO, Paris p 108–111
Pinckney JL, Paerl HW, Harrington MB, Howe KE (1998) Annual cycles of phytoplankton community-structure and bloom dynamics in the Neuse River Estuary, North Carolina. Mar Biol 131:371–381
Rapala J, Sivonen K, Lyra C, Niemelä SI (1997) Variation of microcystins, cyanobacterial hepatotoxins, in Anabaena spp. as a function of growth stimuli. Appl Environ Micro-biol 63:2206–2212
Reis MP (2005) Dynamics of cyanobacteria blooms in Funcho reservoir (Algarve-Portugal) — a multivariate analysis. PhD Thesis, Universidade do Algarve, Faro, Portugal Rocha C, Galvão H, Barbosa A (2002) Role of transient silicon
limitation in the development of cyanobacteria blooms in the Guadiana estuary, south-western Iberia. Mar Ecol Prog Ser 228:35–45
Saker ML, Fastner J, Dittmann E, Christiansen G, Vasconce-los VM (2005) Variation between strains of the cyanobac-terium Microcystis aeruginosa isolated from a Portuguese river. J Appl Microbiol 99:749–757
➤
➤
➤
➤
➤
➤
➤
➤
➤
➤
➤
➤
➤
➤
➤
➤
➤
➤
➤
➤
➤
➤
➤
➤
Sivonen K, Jones GJ (1999) Cyanobacterial toxins. In: Chorus I, Bartram J (eds) Toxic cyanobacteria in water. A guide to their public health consequences, monitoring and man-agement. WHO. E & FN Spon, London, p 41–111 Smetacek V (1985) The annual cycle of Kiel Bight plankton: a
long term analysis. Estuaries 8:145–157
Sobrino C, Matthiensen A, Vidal S, Galvão H (2004) Occurrence of microcystins along the Guadiana estuary. Limnetica 23:133–143
Vasconcelos VM (1993) Toxicity of cyanobacteria in lakes of North and Central Portugal. Ecological implications. Verh Internat Verein Limnol 25: 694–697
Vasconcelos VM (1994) Toxic cyanobacteria (blue-green algae) in Portuguese fresh waters. Arch Hydrobiol 130: 439–451
Vasconcelos VM (2001) Freshwater cyanobacteria and their toxins in Portugal. In: Chorus I (ed) Cyanotoxins: occur-rence, causes, consequences. Springer Verlag, Heidelberg p 62–67
Vasconcelos VM, Pereira E (2001) Cyanobacteria diversity and toxicity in a wastewater treatment plant (Portugal). Water Res 35:1354–1357
Vasconcelos VM, Sivonen K, Evans WR, Carmichael WW, Namikoshi M (1996) Hepatotoxic microcystin diversity in cyanobacterial blooms collected in Portuguese fresh-waters. Water Res 30:2377–2384
Welker M, Brunke M, Preussel K, Lippert I, von Döhren H (2004) Diversity and distribution of Microcystis (Cyano-bacteria) oligopeptide chemotypes from natural communi-ties studied by single-colony mass spectrometry. Micro-biology 150:1785–1796
WHO (World Health Organization) (1998) Cyanobacterial toxins: Microcystin-LR. In: Guidelines for drinking-water quality. World Health Organization, Geneva, p 95–110 Zuur AF, Fryer RJ, Jollife IT, Dekkere R, Beukema JJ (2003)
Estimating common trends in multivariate time series using dynamic factor analysis. Environmetrics 14: 665–685
Submitted: M;arch 3, 2008; Accepted: August 5, 2008 Proofs received from author(s): September 14, 2008