p.rito
Pedro Varela Rito
Licenciado em Ciências de Engenharia em Gestão Industrial
The effect of demand information
sharing in a supply chain under demand
uncertainty: a simulation study
Dissertação para obtenção do Grau de Mestre em Engenharia e Gestão
Industrial
Orientadora
: Professora Doutora Ana Paula Ferreira Barroso,
Professora Auxiliar, Faculdade de Ciências e Tecnologia da
Universidade Nova de Lisboa
Coorientadora
: Professora Doutora Virgínia Helena Arimateia de
Campos Machado, Professora Auxiliar, Faculdade de Ciências e
Tecnologia da Universidade Nova de Lisboa
Júri:
Presidente: Professor Doutor Rogério Puga Leal Arguente: Mestre Nuno Martins Cavaco Vogais: Professora Doutora Ana Paula Barroso e
Professora Doutora Virgínia Campos Machado
The effect of demand information sharing in a supply chain under demand uncertainty:
a simulation study
Copyright © Pedro Varela Rito, Faculdade de Ciências e Tecnologia, Universidade Nova de Lisboa.
A Faculdade de Ciências e Tecnologia e a Universidade Nova de Lisboa têm o direito, perpétuo e
sem limites geográficos, de arquivar e publicar esta dissertação através de exemplares impressos
reproduzidos em papel ou de forma digital, ou por qualquer outro meio conhecido ou que venha a ser
inventado, e de a divulgar através de repositórios científicos e de admitir a sua cópia e distribuição
com objetivos educacionais ou de investigação, não comerciais, desde que seja dado crédito ao autor
Acknowledgements
First of all, I would like to thank my supervisor, Professor Doctor Ana Paula Barroso and my co-supervisor, Professor Doctor Virgínia Machado, for their availability, encouragement, suggestions, the text reviews and all their support that contributed to the successful development of this thesis.
Furthermore, I want to thank the institution FCT-UNL for giving me the adequate training that was necessary to prosper in my professional and personal life.
I thank my colleagues for their valuable assistance and the constant encouragement manifested.
Abstract
The modern business environments are constantly subject to unpredictable events that can adversely
influence the supply chain (SC) performance. In order to remain competitive, SCs are therefore
striving to achieve greater coordination and collaboration among SC entities. The advances in
technology in the area of information technology are enabling instantaneous information sharing
amongst SC entities. Demand information sharing appears as a widely used tool to improve the SC
performance. In this context, SC simulation appears as a fundamental tool to quantitatively analyze
this management practice in a virtual system environment, enabling multiple scenario analysis.
This dissertation intends to verify through the use of discrete event simulation, the impact of the
presence of demand information sharing on the performance of a SC and whether this practice can
reduce the impact of an uncertain customer demand in terms of the total SC costs and the service
level. Considering that the customer demand follows a Normal distribution with an unknown standard
deviation, three different scenarios are simulated using three distinct standard deviations. Further, two
information sharing scenarios are considered, namely the presence and absence of demand
information sharing. This analysis is applied on a case study that is built for this purpose. The software
used to develop the simulation model and reproduce the operational behavior of the SC is Arena.
The analysis of the simulation results indicates that an increase in the variability of the customer
demand worsens all the studied performance measures. However, the introduction of demand
information sharing improves the SC performance in terms of the SC costs.
Resumo
Os ambientes empresariais atuais estão frequentemente sujeitos a eventos imprevisíveis que podem
influenciar negativamente o desempenho das cadeias de abastecimento e colocar em causa a sua
competitividade. Assim, de modo a permanecerem competitivas, as entidades da cadeia de
abastecimento têm preconizado uma maior coordenação e colaboração entre elas. Os progressos na
área das tecnologias de informação têm vindo a permitir a partilha de informação entre as várias
entidades da cadeia de abastecimento. A partilha da informação relativamente à procura ao nível do
cliente final surge como uma das práticas utilizadas para melhorar o desempenho da cadeia de
abastecimento. A simulação é uma ferramenta que permite analisar quantitativamente esta prática de
gestão num ambiente virtual, possibilitando a análise de diferentes cenários.
O principal objectivo desta dissertação é o desenvolvimento de um modelo de simulação discreta de
uma cadeia de abastecimento, no qual se analisa o efeito da partilha de informação no desempenho
da cadeia de abastecimento e se esta prática de gestão permite atenuar o efeito negativo da
incerteza da procura ao nível do cliente final relativamente às medidas de desempenho, nível de
serviço e custo total. Considera-se que a procura segue uma distribuição Normal com uma média
conhecida e desvio padrão desconhecido, sendo simulados cenários para três desvios padrão
distintos nos contextos, nomeadamente na presença e ausência de partilha de informação
relativamente à procura. Esta análise é aplicada num caso de estudo construído para o efeito. O
software utilizado para desenvolver o modelo de simulação e reproduzir o comportamento
operacional da cadeia de abastecimento é o Arena.
A análise dos resultados da simulação mostra que um aumento da variabilidade ao nível da procura
no cliente final provoca um agravamento das medidas de desempenho. No entanto, quando as
entidades da cadeia de abastecimento partilham a informação relativamente à procura do cliente final
o desempenho da cadeia de abastecimento é melhor, nomeadamente os custos totais.
Table of Contents
Chapter 1 Introduction ... 1
1.1 Context of the dissertation ... 1
1.2 Objectives ... 2
1.3 Research methodology... 2
1.4 Dissertation structure ... 3
Chapter 2 Literature Review ... 5
2.1 Supply chain management ... 5
2.1.1 Introduction... 5
2.1.2 Definition ... 6
2.1.3 Objective ... 6
2.2 Supply chain simulation ... 7
2.2.1 Introduction... 7
2.2.2 Supply chain uncertainties ... 7
2.2.3 Demand uncertainties ... 8
2.2.4 Supply uncertainties ... 9
2.2.5 Demand forecasting ... 10
2.2.6 Verification and validation ... 12
2.3 Demand information sharing ... 14
2.3.1 Introduction... 14
2.3.2 Characteristics ... 15
2.3.3 Demand information sharing applied in supply chains ... 15
Chapter 3 Case Study: Supply Chain Model ... 17
3.1. Physical model ... 17
3.2 Customer demand ... 18
3.3 Demand forecasting ... 20
3.4 Inventory management ... 20
3.5 Supply chain entities ... 23
3.6 Operational scheduling ... 25
3.7 Performance measures ... 29
3.8 Scenarios ... 30
3.8.1 Demand information sharing ... 30
3.8.2 No demand information sharing ... 31
3.8.3 Customer demand variability ... 31
Chapter 4 Case Study: Simulation Model ... 33
4.1 Supply chain entities ... 33
4.1.1 Retailer ... 33
4.1.2 Distributor ... 34
4.1.4 Suppliers ... 35
4.1.5 Other characteristics ... 35
4.2 Verification and validation of the simulation model ... 40
4.3 Simulation environment ... 40
4.3.1 Warm-up period ... 40
4.3.2 Number of replications ... 42
Chapter 5 Case Study: Results ... 45
5.1 Result analysis ... 45
5.1.1 Supply chain costs analysis ... 45
5.1.2 Service level analysis ... 55
Chapter 6 Conclusions ... 61
6.1 Conclusions ... 61
6.2 Future work ... 62
References………...63
Annexes……… 67
Annex 1 Development of the service levels when choosing the warm-up period with demand information sharing ... 67
Annex 1.1 – Service level of the retailer for W_sd10 ... 67
Annex 1.2 – Service level of the distributor for W_sd10 ... 67
Annex 1.3 – Service level of the manufacturer for W_sd10 ... 67
Annex 1.4 – Service level of supplier 1 for W_sd10 ... 67
Annex 1.5 – Service level of supplier 2 for W_sd10 ... 68
Annex 1.6 – Service level of the retailer for W_sd40 ... 68
Annex 1.7 – Service level of the distributor for W_sd40 ... 68
Annex 1.8 – Service level of manufacturer for W_sd40 ... 68
Annex 1.9 – Service level of supplier 1 for W_sd40 ... 69
Annex 1.10 – Service level of supplier 2 for W_sd40 ... 69
Annex 1.11 – Service level of the distributor for W_sd90 ... 69
Annex 1.12 – Service level of the manufacturer for W_sd90 ... 69
Annex 1.13 – Service level of supplier 1 for W_sd90 ... 70
Annex 1.14 – Service level of supplier 2 for W_sd90 ... 70
Annex 2 Development of the service levels when choosing the warm-up period with no demand information sharing ... 70
Annex 2.1 – Service level of the retailer for N_sd10 ... 70
Annex 2.2 – Service level of the distributor for N_sd10 ... 70
Annex 2.3 – Service level of the manufacturer for N_sd10 ... 71
Annex 2.4 – Service level supplier 1 for N_sd10 ... 71
Annex 2.5 – Service level of supplier 2 for N_sd10 ... 71
Annex 2.6 – Service level of the retailer for N_sd40 ... 71
Annex 2.7 – Service level of the distributor for N_sd40 ... 72
Annex 2.8 – Service level of the manufacturer for N_sd40 ... 72
Annex 2.10 – Service level of supplier 2 for N_sd40 ... 72
Annex 2.11 – Service level of the distributor for N_sd90 ... 73
Annex 2.12 – Service level of the manufacturer for N_sd90 ... 73
Annex 2.13 – Service level of supplier 1 for N_sd90 ... 73
Annex 2.14 – Service level of supplier 2 for N_sd90 ... 73
Annex 3 Determination of the number of replications of the performance measures ... 74
Annex 3.1 – Determination of the number of replications for the service levels for W_sd10 ... 74
Annex 3.2 – Determination of the number of replications for the SC costs for W_sd10 ... 74
Annex 3.3 – Determination of the number of replications for the service levels for W_sd90 ... 74
Annex 3.4 – Determination of the number of replications for the SC costs for W_sd90 ... 74
Annex 3.5 – Determination of the number of replications for the service levels for N_sd10 ... 74
Annex 3.6 – Determination of the number of replications for the SC costs for N_sd10 ... 74
Annex 3.7 – Determination of the number of replications for the service levels for N_sd40 ... 75
Annex 3.8 – Determination of the number of replications for the SC costs for N_sd40 ... 75
Annex 3.9 – Determination of the number of replications for the service levels for N_sd90 ... 75
Annex 3.10 – Determination of the number of replications for the SC costs for N_sd90 ... 75
Annex 4 –Retailer’s and distributor’s simulation model in arena... 77
Annex 5 –Manufacturer’s simulation model in arena ... 79
List of Figures
Figure 1.1 – Outline of the dissertation ... 2
Figure 2.1 – Simulation model development process ... 13
Figure 3.1 – Supply chain constitution ... 17
Figure 3.2 – Bill of Materials ... 17
Figure 3.3 – Supply chain model ... 18
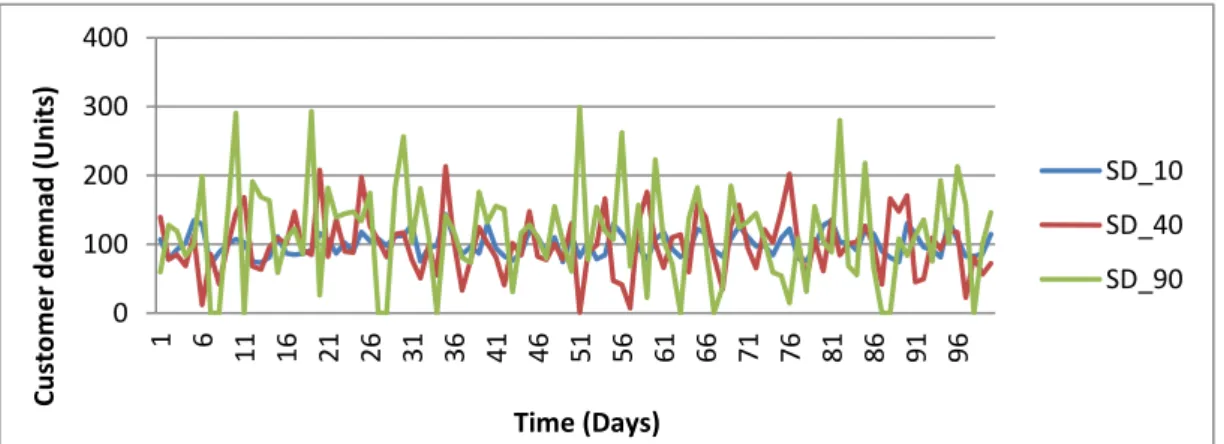
Figure 3.4 – Daily customer demand using a standard deviation of 10, 40 and 90 units for a simulation of 100 days ... 19
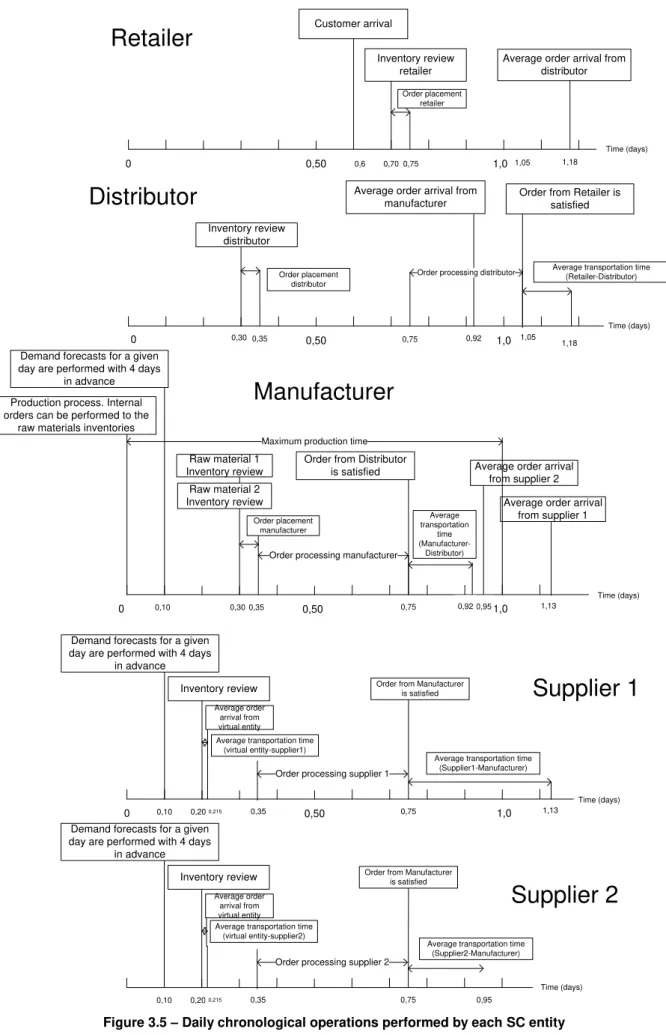
Figure 3.5 – Daily chronological operations performed by each SC entity ... 28
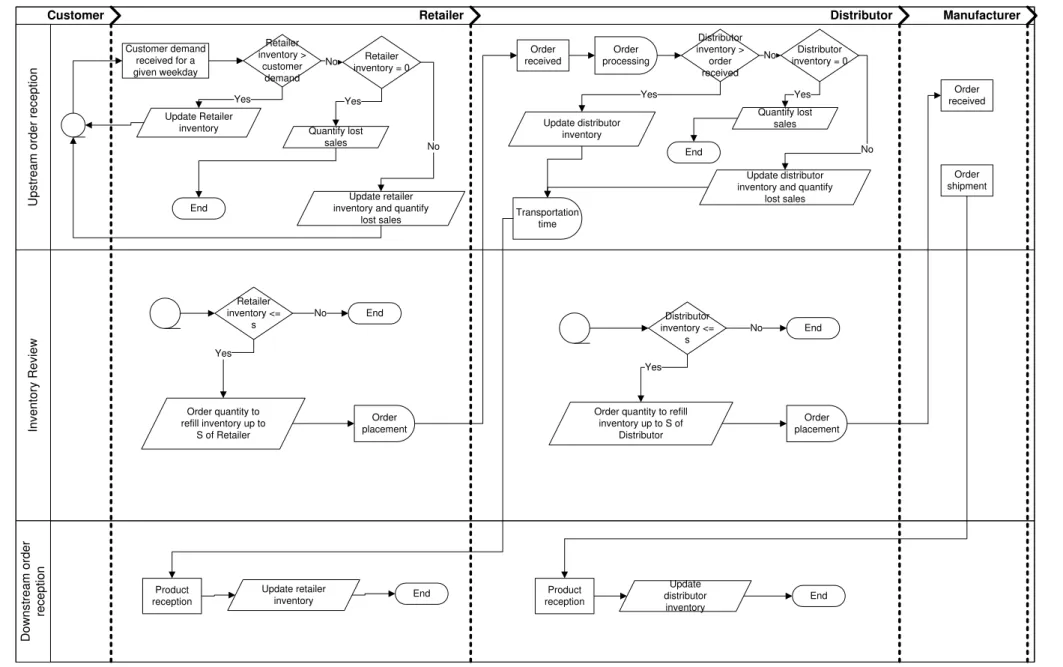
Figure 4.1 –Retailer’s and distributor’s flowchart ... 37
Figure 4.2 –Manufacturer’s flowchart ... 38
Figure 4.3 –Supplier’s flowchart ... 39
Figure 4.4 – Warm-up period estimate using the service level of supplier 2 W_sd90 ... 41
Figure 4.5 – Warm-up period estimate using the service level of supplier 2 N_sd90 ... 41
Figure 5.1 – Proportion of the types of SC costs in terms of percentage in the presence of demand information sharing ... 47
Figure 5.2 – Proportion of the types of SC costs in terms of percentage in the absence of demand information sharing ... 48
Figure 5.3 – Average total SC costs composition in percentage per entity in the presence and absence of demand information sharing ... 49
Figure 5.4 –Overview of the entities’ service levels under W_sd10 and N_sd10 ... 55
Figure 5.5 –Overview of the entities’ service levels under W_sd40 and N_sd40 ... 56
Figure 5.6 –Overview of the entities’ service levels under W_sd90 and N_sd90 ... 56
Figure 5.7 –Overview of the entity’s service levels under W_sd10, W_sd40 and W_sd90 ... 57
List of Tables
Table 2.1 – SCM definitions ... 6
Table 3.1 – Geographical locations of the SC entities ... 18
Table 3.2 – Seasonal factors ... 19
Table 3.3 – Daily customer demand pattern ... 19
Table 3.4 – Relationship between the desired service level and the Z-score ... 21
Table 3.5 – Inventory management parameters with a customer demand standard deviation of 10 units ... 22
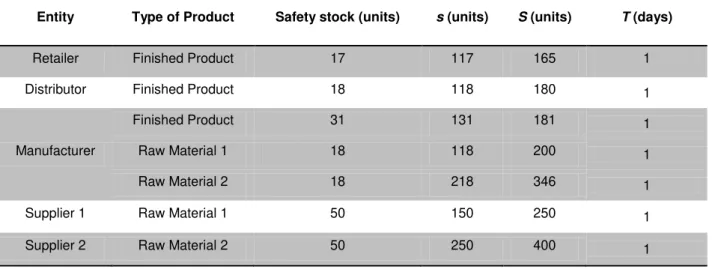
Table 3.6 – Inventory management parameters with a customer demand standard deviation of 40 units ... 23
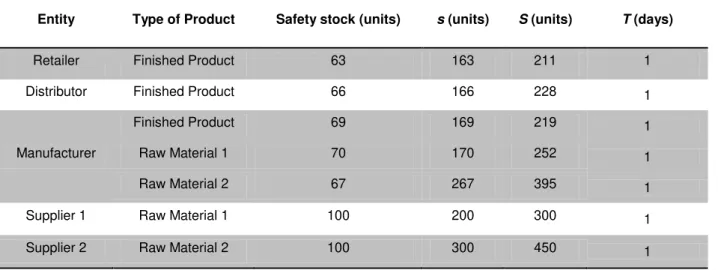
Table 3.7 – Inventory management parameters with a customer demand standard deviation of 90 units ... 23
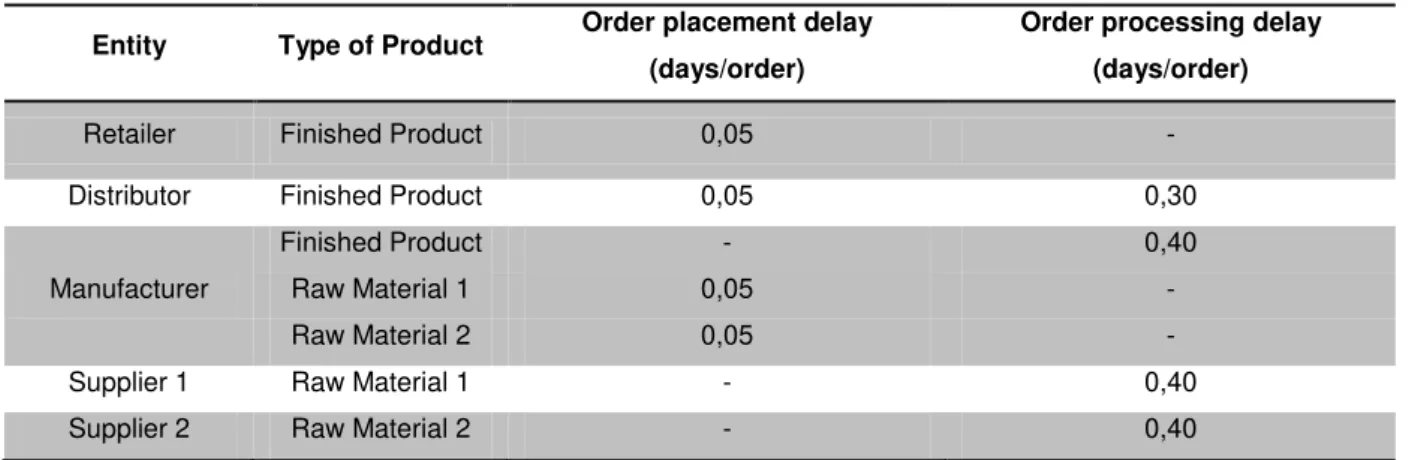
Table 3.8 – Order delays suffered by SC entities ... 25
Table 3.9 – Transportation time between SC entities (triangular distribution, in days) ... 26
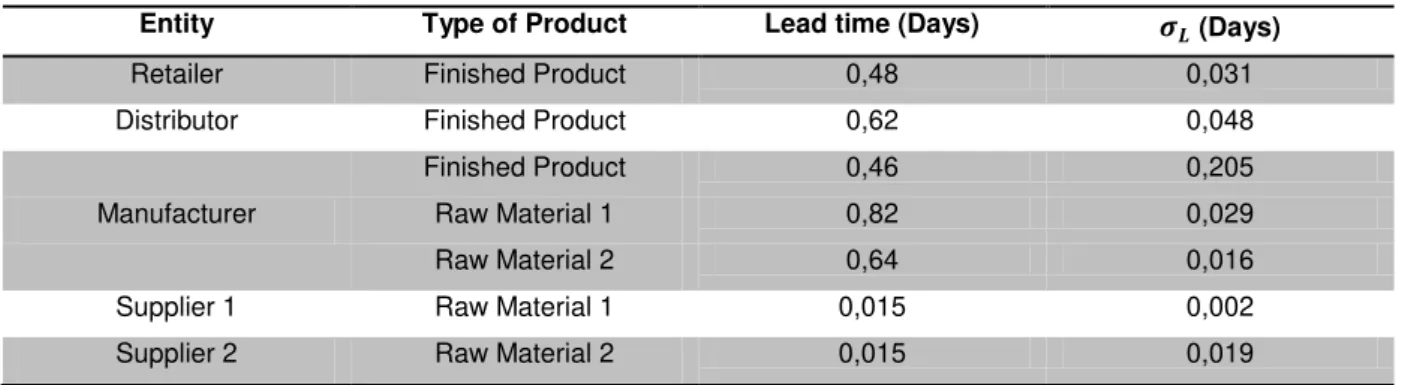
Table 3.10 – Lead time and the standard deviation of the lead of each entity ... 27
Table 3.11 – SC costs of the entities ... 30
Table 3.12 – Scenario abbreviations ... 31
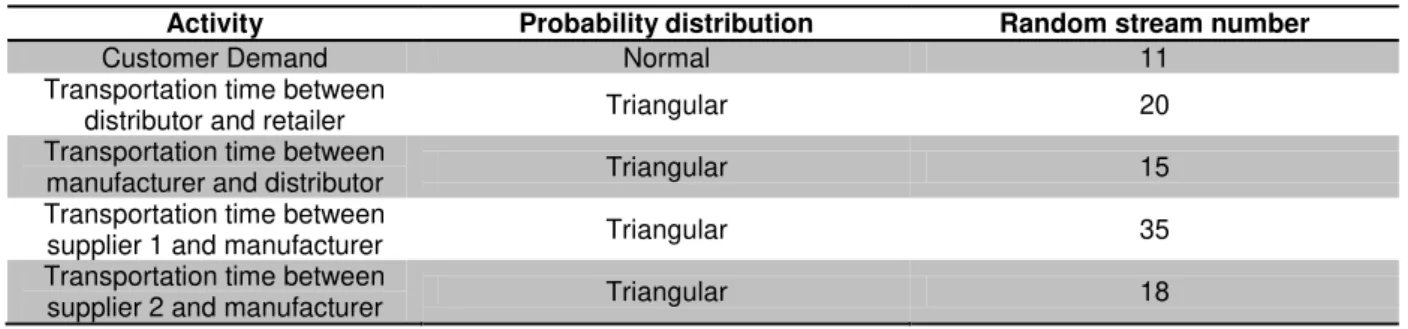
Table 4.1 – Random stream numbers assigned to the different probability distributions ... 36
Table 4.2 – Warm-up period required to reach the steady-state period for the service levels (days) .. 42
Table 4.3 – Determination of the number of replications for the service levels for W_sd40 ... 42
Table 4.4 – Determination of the number of replications for the SC costs for W_sd40 ... 43
Table 5.1 – Total SC costs comparison between the scenarios in the presence and absence of demand information sharing ... 45
Table 5.2 – Comparison of the total SC costs between scenarios with the same information sharing practice ... 46
Table 5.3 – Incurred types of costs in the presence of demand information sharing... 47
Table 5.4 – Incured types of costs in the absence of demand information sharing ... 48
Table 5.5 –Total costs comparison per entity between the W_sd10 and N_sd10 ... 50
Table 5.6 –Total costs comparison per entity between the W_sd40 and N_sd40 ... 50
Table 5.7 –Total costs comparison per entity between the W_sd90 and N_sd90 ... 50
Table 5.8 – Average number of orders and ordering costs incured by each entity for W_sd10 and N_sd10 ... 51
Table 5.9 – Average number of orders and ordering costs incured by each entity for W_sd40 and N_sd40 ... 52
Table 5.10 – Average number of orders and ordering costs incured by each entity for W_sd90 and N_sd90 ... 52
Table 5.11 – Average inventory levels of the SC entities ... 52
Table 5.12 – Holding costs incured by the SC entities ... 53
Table 5.13 – Average satisfied order quantities and the lost sales cost for W_sd10 and N_sd10 ... 54
Table 5.14 – Average satisfied order quantities and the lost sales cost for W_sd40 and N_sd40 ... 54
List of Abbreviations
BOM Bill of materials
ERP Enterprise resource planning
FDDM Forecasted demand distributing method
MIP Mixed integer programming
MU Monetary units
PDTM Planned demand transferring method
s Reorder level
S Maximum inventory level
SC Supply chain
SCM Supply chain management
SMDP Simulation model development process
SKU Stock keeping unit
Chapter 1
Introduction
1.1 Context of the dissertation
The current competitive business environment has forced organizations to minimize their costs, while
still providing high quality products and services in great diversity to the customers. This challenge has
compelled enterprises not only to optimize the existing operations, but also consider alternative
solutions that may improve the general performance. The appearance of simulation to manage the
supply chain (SC) of enterprises turns out to be an essential tool to satisfy the emergence of this need.
The development witnessed in the information technology over the last decades accompanied by a
growing number of people mastering high level programming languages are significantly contributing
to a global acceptance of this tool, which allows managers to evaluate and compare virtual scenarios
that might be adopted, at a high speed and a relatively low cost.
Another consequence of the current state of the market and the economic situation is an increase in
the stimulation of inter-organizational collaboration within networks and the smoothening of the SC
flows (Zhang and Zhang, 2007). This appearance is characterized as the information sharing
techniques, which are becoming increasingly popular within the organization and between
organizations. It is widely recognized from studies that the introduction of information sharing amongst
the SC members appeared as an efficient practice against the present issues, while instantly
improving the general SC performance. However, many enterprises still fear that the information
sharing policy can damage their own benefits. Thus, in order to encourage enterprises to share
information, the generated benefits need to be comprehensively recognized and evaluated through
further studies (Chen et al., 2007). It should be noted that the benefits of the information sharing
depend on the type of information as well as the demand patterns and capacity constraints that are
imposed (Chan and Chan, 2009).
The use of information sharing is also one of the most common strategies to minimize the effects of
uncertainties in SCs, which can have significant negative effects on the SC performance (Datta and
Christopher, 2011). Although uncertainty is an inevitable factor within a SC that cannot be completely
eliminated, many authors agree that demand uncertainty is the major source of SC uncertainty,
making it therefore the most important element to manage within this field (Geunes and Pardalos,
2005; Acar et al., 2010; Hugos, 2011).
It is thus necessary to continue studying the effect and value of information sharing practices in SCs
from a theoretical as well as practical point of view, by developing new strategies and evaluating new
scenarios, in order to aid decision-making and maintain SCs globally competitive, even when facing
an increase in SC uncertainties. This dissertation attempts to satisfy this need and be a motivation for
Chapter 1 - Introduction
Step 1
Literature review
Step 2
Case study design
Step 3
Case study modelation and conception of the scenarios for analysis
Step 4
Result analysis
Step 5
Conclusions 1.2 Objectives
The objective of this dissertation lies on the verification if demand information sharing can increase the
SC performance under an uncertain customer demand, in terms of the service level and the SC costs,
within a four level SC that is consisted of one retailer, one distributor, one manufacturer and two
suppliers, which produce and deliver a product to one final customer. Additionally, one verifies
whether demand information sharing can reduce the impact of an uncertain customer demand on the studied SC’s performance measures.
In the presence of demand information sharing, the customer demand that arrives at the retailer is
instantly known by the manufacturer and the two suppliers. When there is no demand information
sharing between the SC entities, the demand is exclusively acknowledged by the amount of units that
are ordered by a downstream entity. The customer demand uncertainty is modeled by a variable that
follows a Normal distribution with mean zero and an unknown standard deviation. Given the objectives
of this dissertation, three distinct customer demand standard deviations are considered in the
presence and absence of demand information sharing, generating six scenarios. Note that each
considered customer demand standard deviation is used in the presence and absence of demand
information sharing. A comparative study between the six possible scenarios intends to dictate the
best scenario, regarding the SC performance.
In order to simulate and compare these scenarios, Rockwell Arena 9.0 software is used.
1.3 Research methodology
The research methodology employed to guide this research is summarized in Figure 1.1. In the first
step of this methodology a literature review intends to provide an overview in this research field in
order to develop a case study.
Chapter 1 - Introduction
The literature review is conducted using the B-on scientific database provided by Faculdade de Ciências e Tecnologias of the Universidade Nova de Lisboa. In fact, the used database is consisted of several scientific databases including, BioMed Central, Directory of Open Access Journals (DOAJ),
Informa Taylor & Francis (CrossRef), OneFile (GALE), SciVerse ScienceDirect (Elsevier), Science
Citation Index Expanded (Web of Science) and Social Sciences Citation Index (Web of Science). The
key-words that are inserted in the topics of the database to obtain literature information are
simultaneously “supply chain” and “simulation”, providing a total of 707 results. It should be noted that the key-words have to be introduced in the two available topics of the database, by choosing the
subject option. Following this research, this dissertation is approximately based on 40 journal articles
and 20 books. The main criteria considered for this selection, consists in reading the most appealing
journal titles along with their abstract that have been written in the last five years. In case the abstract
reveals to possess potential valuable information, the rest of the article is read, analyzed and the
conclusions are drawn. The books are consulted to obtain complementary theoretical research
information.
In the second step, the conceptual model for a case study is developed based on ideas and
suggestions encountered in the conducted literature review, in which the objective is defined for a
given SC.
The third step of the study consists in developing the simulation model of the case study, defined in
the previous section, including the scenarios for analysis. This activity is accomplished with the help of
a simulation software, namely Rockwell Arena 9.0 that uses a SIMAN programming language.
After the desired scenarios are completely formulated, one can advance to the next step, which
consists in analyzing the results of different simulation scenarios. According to the objectives, the
performance measures of the scenarios are carefully studied and compared in order to extract valid
conclusions.
In the final step the conclusions are drawn regarding the purpose of the dissertation.
1.4 Dissertation structure
The dissertation is organized into six chapters. The first chapter provides a general introduction,
regarding the scope of the study, the outlined objectives, the research methodology used and the
encountered research contributions.
Since the study involves a specific knowledge in SC simulation, supply chain management (SCM) and
demand information sharing, it is justifiable that each of these fields should firstly be presented in
some detail before moving to the presentation of this dissertation. Chapter two is therefore dedicated
to an overview of the relevant issues concerning these subjects.
In chapter three, the case study is presented along with the conceptual SC modeling and simulation
Chapter 1 - Introduction
In the fourth chapter a simulation study is applied to the specifications of the conceptual model. The
required simulation conditions have to be carefully identified and programmed in order to obey the
theoretical assumptions of the previous chapter. The last part of this chapter is dedicated to the
verification and validation procedures as well as the definition of the simulation environment under
which the simulation model operates.
Chapter five provides the case study results followed by a critical analysis of the obtained results. The
relevant comments and discussions are dispersed throughout this chapter.
In the final chapter, the main conclusions regarding this research are drawn from the results analysis
and the proposed further research is presented based on the work developed so far.
Chapter 2
Literature Review
This chapter intends to provide the necessary background that is required to comprehend the
development of the dissertation, according to the established objectives. The three main issues that
have to be studied to meet this goal are supply chain management (SCM), supply chain (SC)
simulation and demand information sharing.
This chapter is therefore divided into three sections, namely SCM, SC simulation and demand
information sharing. The SCM section addresses the background and the main characteristics of this
scientific area. Ultimately, the definition of this concept is encountered with the help of the author’s work developed so far, as well as the objectives are defined. The SC simulation section provides an
overview of the characteristics that are present in the case study that can be seen later on in this
dissertation. These sections include SC uncertainties, which can be divided into demand and supply
uncertainties, demand forecasting and the verification and validation procedures The demand
information sharing section describes when, how and where this practice is used.
2.1 Supply chain management
2.1.1 Introduction
A SC includes the companies and the business activities needed to design, produce, deliver and use a
product or a service. Every business fits into one or more SCs and has a role to play in each of them
(Hugos, 2011). The main objective of a SC is to provide the right products and services on time, with
the required specifications, at the right place to the final customer (Carvalho et al., 2012).
A SC is characterized by possessing three types of flows, namely material, information and financial
flows. It should be noted that all three flows are bidirectional, which means that they can flow both in a
downstream way as in an upstream way. These network flows require therefore careful planning and
close coordination in order to thrive in an operational SC (Jung et al., 2007).
The appearance of dynamic and segmented markets, in which the customer’s requirements are constantly changing and highly unpredictable along with the presence of a fierce competition through
globalization, is forcing the SCs to become faster, better and economically more efficient (Jespersen
and Skjott-Larsen, 2005). Thus, organizations are becoming increasingly interested in improving their
SC performance and are starting to research several areas over the last decades, that for example
can improve the customer delivery performance, reduce inventory and increaseboth SC flexibility and
responsiveness(Suwanruji and Enns, 2006). The ability to create trust-based and long-term business
relationships with customers, suppliers and other strategic entities is becoming a crucial competitive
parameter (Jespersen and Skjott-Larsen, 2005). Klemenčič (2006) measures the competitiveness between SCs based on how efficiently and effectively the customer preferences in terms of service,
Chapter 2 – Literature Review
2.1.2 Definition
Before these facts, SCM appears as the ideal solution. The only question that remains is the actual
meaning of this concept. In literature however, one witnesses that there is still a lack of consistency
and clarity regarding the definition of SCM, making it particularly difficult to understand the essence of
this activity. Table 2.1 provides some definitions that may clarify its meaning.
Table 2.1 – SCM definitions
Authors SCM definition
Mentzer et al. (2001)
“Systemic, strategic coordination of the traditional business functions and the tactics
across these business functions within a particular company and across businesses within the SC, for the purposes of improving the long-term performance of the
individual companies and the SC as a whole.”
Li (2007)
“A set of synchronized decisions and activities utilized to efficiently integrate suppliers, manufacturers, warehouses, transporters, retailers and customers so that the right product or service is distributed at the right quantities, to the right locations, and at the right time, in order to minimize system-wide costs while satisfying customer service
level requirements.”
Lambert (2008)
“Integration of key business processes from end-user through original suppliers that provides products, services, information that add value for customers and other
stakeholders”
Supply Chain Council
(2012)
“…the inclusion of the management of supply and demand, sourcing raw materials and parts, manufacturing and assembly, warehousing and inventory tracking, order entry
and order management, distribution across all channels, and delivery to the customer.”
Looking at the previous definitions, one can identify several mutual characteristics, including strategic
collaboration and integration, production and inventory management and finally the added value that is
being generated for the final customer (Cabral, 2011). It should be noted that the management of a
SC along with the roles of the various entities involved, usually differ from industry to industry and
company to company and depend vastly on the business strategy considered (Shukla et al., 2011).
2.1.3 Objective
The main objective of SCM is to simultaneously minimize the total SC cost and enhance a competitive
advantage without compromising the desired customer service level (Mentzer et al., 2001). Hung et al.
(2006) indicates that SCM is the most effective strategy to deal with external strategic changes, as for
instance globalization, and operational uncertainties, such as demand fluctuations, in order to take
advantage of eventual opportunities that may arise.
This innovative management approach is actually increasing the integration and cooperation within the
SC and leading to a higher level of management complexity, which requires therefore an increasing
coordination of resources and activities (Jespersen and Skjott-Larsen, 2005). With the growing
Chapter 2 – Literature Review
increasingly seeking to minimize the risk of committing mistakes by quantitatively analyzing their SCs
through the introduction of simulation models (Hung et al., 2006).
2.2 Supply chain simulation
2.2.1 Introduction
Simulation is one of the most frequently used tool to study the behavior of SCs, in order to quantify
their efficiency and study the implementation of new management strategies in a relatively short
period of time (Iannone et al., 2007).
The introduction of simulation in SCM brought several benefits to enterprises. Harrison et al. (2007)
highlights the ability to provide accurate estimates of efficiency and effectiveness of systems and the
possibility to perform detailed sensitivity analysis in a virtual system environment. Kelton et al. (2004)
emphasizes the flexibility with which conceptual models can be solved, regardless of their complexity.
Besides this factor, the constant improvement, in recent years, of the performance/price ratio of
computer hardware has rendered simulation into one of the most important tools in the actual global
business environment.
The literature regarding the SC simulation covers numerous areas, such as, inventory management,
information sharing, uncertain scenarios and entity collaboration, among others, but usually possesses
a common purpose that consists in initially studying a real-based or virtual SC, in which the main
characteristics are identified. Afterwards, the author establishes an objective and introduces a unique
feature to study the impact that it has on the desired performance measures.
In the studied literature, approximately 40% of the authors consider the total SC costs and the service
level measured downstream, which is equal to the ratio between the quantity of filled customer
demand and the total customer demand, as the chosen performance measures. Regarding the
customer demand at the downstream level, almost 50% of the authors use a normal or a poisson
probability distribution to represent this characteristic. Generally, the authors study multi-echelon SCs,
allowing a more complex approach of a system. In fact, these virtual representations brings one closer
to reality and enable the extraction of more extensive conclusions regarding the SC.
2.2.2 Supply chain uncertainties
With the current market experiencing a globalization of the enterprises, customers are becoming more
demanding, urging improved customized products and expect their service level to be higher than
before. This high competitive pressure, forces enterprises to decrease product life cycles, increase
product variety and improve the ability to adapt to technological changes. These facts are
consequently leading to an increase in uncertainties throughout the entire SC (Merschmann and
Thonemann, 2011). Having identified this threat, one should characterize the meaning of uncertainty.
Chapter 2 – Literature Review
system that represents the incompleteness of our knowledge about the system and the conditions of
its development.
The systematic consideration of SC uncertainties can facilitate the determination of the expected
return and the estimation of the associated risks based on the current status and future predictions
(Papageorgiou, 2009).
Wangphanich et al. (2010) emphasize that one of the main aims in the SCM of an organization is to
coordinate the upstream flow of incoming materials with the downstream services, in order to cope
with uncertainties that may appear without generating excess inventories. The consequent danger
regarding uncertainty, lies on the perturbation influences that may occur in the operational SC, leading
to a change in the planned course of events (Ivanov and Sokolov, 2009). The main factors that
contribute to SC uncertainty include, inaccurate forecasting, long order lead times, delivery delays,
incomplete shipment, batch ordering and fluctuations in prices, among other factors (Wangphanich et
al., 2010).
Within the SC uncertainties, one can identify two major groups that contribute for this undesired
phenomenon: demand uncertainties and supply uncertainties (Chiang and Feng, 2007; Bidgoli, 2010).
2.2.3 Demand uncertainties
The fact that demand uncertainty reflects the uncertainty of a downstream demand for a product or
service and being a constant factor present in the majority of the SCs, made many authors agree, that
this source of uncertainty is the major source of SC uncertainty (Geunes and Pardalos, 2005; Acar et
al., 2010; Hugos, 2011). This indicates that the demand uncertainties are the most important element
to manage within the SC uncertainties.
Demand uncertainty tends to vary according to the type of manufacturing product. The functional
products represent stable goods, such as food items and gas, tend to have a low demand uncertainty,
while the innovative products, such as technological and fashion items are rapidly changing and are
perceived as risky by the end customers, possessing a high demand uncertainty (Mohr et al., 2009).
Whenever a product or a service faces uncertain demand, there are generally three types of
coordinated strategies that can suppress this threat. In first instance, one can reduce uncertainty by
developing improved forecasting systems. Secondly, managers can reduce the lead times and provide an increase in the SCs’ flexibility in order to produce only when needed. Finally, it can be dealt with the creation of buffers of inventory or the generation of excess in capacity (Mentzer, 2001). The
centralization of demand information throughout the entire SC is also frequently used to reduce
uncertainty, in which each level in the SC is updated with complete information regarding the actual
customer demand (Simchi-Levi et al., 2004).
Throughout literature, demand uncertainty has been extensively studied by authors and can be
Chapter 2 – Literature Review
model to determine the impact of demand, supply and lead-time uncertainties on customer service
performance and costs. With the help of the ANOVA concept, a comparison is made between the tree
types of uncertainties, resulting with the identification of demand uncertainty as possessing the
greatest negative impact on the SC performance (Acar et al., 2010). Generally, the authors used a
simple probability distribution to represent the demand uncertainty. However, Chan and Chan (2010);
Acar et al. (2010), represent demand uncertainty in the SC by varying the variance of the
corresponding probability distribution, allowing the creation of multiple scenarios with distinctive
characteristics with the possibility to perform sensitivity analysis. Reiner and Trcka (2004) use smooth
and volatile demand to represent the customer demand, in which the difference lies in the standard
deviation parameter, which was much higher for the volatile demand. Bottani and Montanari (2010)
study the introduction of a demand peak in a fast moving consumer SC with the objective to obtain
insights on how to optimize SC design. Whenever this feature occurs, the authors significantly
increase the mean and the standard deviation of the demand probability distribution and compare the
outputs with the initial original demand values without a demand peak. Wadhwa et al. (2009) use a
similar approach to study different inventory control policies under the presence of impulsive demand
disturbances. The imposed variability actually influences each SC node differently, depending on the
inventory policy that is used.
Sari (2010); Lau et al. (2008); Chiang and Feng (2007) use expression 1 during simulation to
represent the customer demand uncertainty,
(
)
, (1)
where Dtrepresents the demand during period t. The sine function is used to capture the seasonality
of customer demand, whereas snormal is a standard normal random variable. The Base and Season Cycle parameters are fixed parameters, while the Season and Noise parameters, characterize different magnitudes of demand uncertainties, generating different fluctuation levels and dynamic
noise levels of demand.
Yan (2010); Zhu et al. (2011) use a different approach to represent demand uncertainty within the
studied SCs. The authors adopt the following expression to define the customer’s demand, ̅ . ̅ represents a deterministic mean demand that usually is derived from historic data and is a random variable, which follows a normal distribution, with a mean of zero and variance of V. In fact, the V can
range from zero up to , creating a higher demand uncertainty but a lower forecasting accuracy
parameter. The customer demand follows a normal distribution. The case study developed in the
next chapter is going to adopt this characteristic to represent the presence of SC uncertainty.
2.2.4 Supply uncertainties
On the contrary of demand uncertainty, supply uncertainty has not received the same attention as it
Chapter 2 – Literature Review
than demand, lead to the thinking that supply uncertainty is thought to be managed by focusing
exclusively on the selection of the indicated suppliers and their development, rather than on the
management of the supply uncertainty (Shah, 2009).
Supply uncertainty can take a different number of forms, namely supply disruptions, yield uncertainty
and lead time uncertainty. As the term indicates, supply disruptions refers to an interruption of the
supply in goods at a certain stage in the SC, which generally occurs due to natural disasters, strikes or
the fact that a supplier can go out of business. Yield uncertainty refers to the fact that occasionally the
supplier delivers a quantity that falls short regarding the actual amount ordered. This phenomenon can
be a result of product defects or of batch processes, in which only a certain percentage of a given
batch, that represents the yield, can be used. Lead time uncertainty represents an uncertainty in the
supply lead time that usually results of stock-outs at the supplier or of manufacturing and transit
delays, among other factors (Snyder and Shen, 2011).
Chan and Chan (2010) represent supply uncertainty by comparing scenarios, in which the normal suppliers’ capacity was increased up to 40% of its original value. Acar et al. (2010) illustrate supply uncertainty by generating uncertain machine breakdowns that follow a uniform distribution and by comparing an increase of 10% of the suppliers’ capacity with their normal capacity.
Regarding the lead time uncertainties, Heydari et al. (2008) study the impact of lead time variation on
SC performance, giving special emphasis to the following parameters, the ordering variance, the
bullwhip effect and the inventory position. Initially, a structural model is developed to evaluate the
impact of lead time uncertainty on the SC parameters. Afterwards, several hypotheses are tested
using a covariance structure analysis based on the simulation results. The authors conclude that lead
time variance significantly affects the inventory management, for it is responsible for changing the
order variances and increasing both the holding quantity and the number of stock-outs. Acar et al.
(2010) study the effect of transportation lead time uncertainty by comparing a scenario that possesses
a fixed lead time with a 10% standard deviation of the expected lead time.
The constant threat of SC uncertainties, is forcing managers and researcher to develop effective
methods that can minimize this danger. Common methods that address this issue include demand
forecasting and sharing information regarding the demand.
2.2.5 Demand forecasting
The ability to accurately forecast short and long-term events remains one of the most crucial factors in
the operational planning of any organization, regardless of the adopted production system or the
dimension of a SC (Christou, 2011). Forecasting can be defined as an activity that uses the
information at hand, including hunches, formal models and data, to make statements about the
likelihood of future events (Elliott et al., 2006).
It should be noted that regardless of the forecasting method used to esteem demand, there are certain
Chapter 2 – Literature Review
always be wrong. The only question worth asking is the dimension of its error. An aggregate forecast
is considered to be more accurate than a forecast of an individual item within the aggregation. Finally,
a short-term forecast is generally more accurate than long-term forecasts, due to the presence of
more uncertainty regarding the course of future events (Christou, 2011).
Within this research area, demand forecasting can be determined using quantitative or qualitative
forecasting techniques. Quantitative forecasting can be defined as a statistical technique that applies
mathematical models to existing and previous scenarios in order to predict future events. There are
two primary groups within the quantitative methods. The time-series analysis uses historical data to
predict future events based on cyclical, trend and seasonal influences, while causal analysis attempts
to identify the linkage between two or more variables. Qualitative forecasting, on the other hand,
focusses on subjective factors to draw conclusions, such as, estimates and opinions (Boyer and
Verma, 2009).
In terms of the encountered literature review, Hussain et al. (2012) study the impact of two forecasting
methods, exponential smoothing and minimum mean squared error, on the bullwhip effect and
inventory variances in a SC under a periodic review policy. The bullwhip effect phenomenon describes
a situation in which harmless demand variances incurred at the retailer are amplified through the SC,
causing heavy demand fluctuations at the upstream entities. Inventory variances are greater for
exponential smoothing than for minimum mean squared error and the difference between the two
forecasting methods increases as the lead time increases. Simulation experiments show that
depending on the structure of a demand process, the appropriate selection of forecasting technique
can reduce or even eliminate the bullwhip effect. Crnkovic et al. (2008) use Monte Carlo simulation to
develop a decision-support framework in order to study the tradeoffs in manufacturing short shelf life
product quantities under different SC configurations and alternative forecasting options, given
uncertain demand environments. It should be noted that the authors consider the difference between
the actual forecast and the desired forecast, which represents the error in forecasting, to be
characterized as a monotonically decreasing function. The forecast quality is modeled by assigning a
specific half-width to the sampling interval. The half-width represents half of the range of a confidence
interval for the sample mean. In this case a significance level of 5% is considered. A high quality
forecast requires therefore a small half-width of the sampling interval but possesses a much higher
forecasting cost. Besides demand forecasting, information sharing regarding the demand also appears
as an efficient tool to address SC uncertainties . Mostard et al. (2011) study demand forecasting in a
mail order apparel organization that lacks historic demand data. In order to forecast the demand, the
authors compare an expert judgment method with a new approach namely forecasting based on
advance information sharing. The judgments are obtained from purchase managers and other experts
of the organization. The forecasting technique using advance information sharing starts by forecasting
the total season demand in the upcoming season for a group of stock-keeping-units (SKU’s), by scaling up to the registered advance (preview) demands for the respective SKU’s. The results of this study indicate that the advance information sharing forecasting produces more robust estimates of the
Chapter 2 – Literature Review
cases the forecasting using the expert judgment method outperforms the advance information sharing
forecasting method. Combining these two forecasting methods may bring further benefits when
forecasting demand.
2.2.6 Verification and validation
When constructing a SC simulation model, Tannock et al. (2007) emphasize the need to undertake
the control processes of validation and verification, in order to be assured that the proposed model
and its results, accurately represent the behavior of the studied system. Once this process is
completed, the model can be run in order to extract the results regarding the SC behavior and
performance of the desired study interests. In most situations, a simulation expert is required to be
closely involved with the simulating process as a precaution. In fact, a SC can suffer frequent
modifications over time, which can actually limit the practice of simulation by non-expert users.
The fact that there is no widely accepted standard to evaluate the rigor of discrete-event simulation
studies in the area of SCM, has led to the development of a process that can address and manage
these issues. A simulation model development process (SMDP) with an eight-step process is
proposed to be a guideline for the general use in the design and execution of rigorous simulation
actions, as can be seen in Figure 2.1. It is expected that such guidance may provide high quality
simulation modeling research and be an optimal framework towards designing and presenting studies.
The eight-step process of the SMDP encompasses the problem formulation, the specification of the
independent and dependent variables, the development and validation of the conceptual model, the
data collection, the development, verification and validation of the computer-based model, the
Chapter 2 – Literature Review
Figure 2.1 – Simulation model development process (SMDP) (Manuj et al., 2009)
In the first two stages of the SMDP, the problem should be entirely formulated, in which the objectives
and the evolved variables, both dependent and independent, are clearly defined regarding the
emphasis of the study. After the successful development of the conceptual model it requires an initial
validation to verify if the main assumptions, algorithms and model components are accurately
described. If desired, a structured walk-through can be performed to minimize any unforeseen errors.
The next step consists in the collection of data that is necessary to specify the model parameters and
the definition of the operating procedures required to perform the simulation study. Note that the SC
modeling parameters and the operating procedures are determined based on the encountered
literature within this research area. Once these operations are completed, the researcher can proceed
with the verification of the computational model, followed by the model validation (Manuj et al., 2009).
Before entering the final two steps of the SMDP, it is necessary to reveal the main characteristics and
the definition of validation and verification procedures that are vital in any simulation study.
In the validation process, the simulation model is verified whether it is providing an accurate
representation of the system for the particular objectives of the study (Law and Kelton, 2000). The
problems encountered during the validation phase are generally attributed to the model
conceptualization or data collection, which can lead erroneous conclusion and decisions (De Sensi et
al., 2008).
Step 1: Formulate Problem
Step 2: Specify independent and dependent variables
Step 3: Develop and validate conceptual
model
Step 4: Collect data
Step 5: Develop and verify computer-based
model
Step 6: Validate the model
Step 7: Perform simulations
Chapter 2 – Literature Review
The model validation is composed of two distinct procedures, namely the conceptual and the results
validation (Manuj et al., 2009). The conceptual model validation aims at determining whether the
model specifies its features with sufficient clarity, precision and adequate detail, in order to meet the
requirements of the study (Tannock et al., 2007). The undertaken techniques that are used in this
simulation model for the conceptual validation consist in researching the existing theory and literature
performed in similar simulation studies. Regarding the applied results validation techniques in this
simulation study, a sensitivity analysis is undertaken after the generation of the six scenarios, in order
to study and compare the results. Powers and Closs (1987) emphasize that sensitivity analyses
applied to simulation models can identify the model factors that have the greatest impact on the
performance measures as well as provide a good analysis model assumptions are modified.
During the verification of the SC model, one studies if the conceptual simulation model has been
correctly translated into a computer program model (Law and Kelton, 2000). In order to reflect this
translation correctly, the model verification is firstly applied to a SC consisted of a single entity. In case
this SC is positively verified, another entity can be added to the SC. This process is repeated until the
entire SC has been verified (Wan and Evers, 2011).
After this process is finished, one can answer the question related to the fact if the model is rightfully
built and acknowledge that only the assumed specifications are taken into account in the model and
nothing else. When the verification and validation procedures have taken place, the studied model can
finally perform simulations. In the final step, the simulation results are documented and analyzed
according to the pre-defined objectives (Manuj et al., 2009).
2.3 Demand information sharing
2.3.1 Introduction
An effective SC is not achievable by a single organization, but rather requires a virtual entity that can
integrate all the involved entities. This virtual entity should share real-time information among SC
entities regarding the SC characteristics, causing therefore a global collaborative management (Chen
et al., 2007).
Prior to the 1980’s, the majority of the information flows between operational areas within an organization and between organizations were paper based. These paper based transactions and
communications turned out to be slow, unreliable and susceptible to errors, generating a decrease in a SC’s effectiveness regarding the design, development, procurement, production and the distribution of their products or services. The advances in technology have driven many changes in the area of
information technology, enabling the connection of organizations of a SC into a unified and
coordinated system (Handfield and Nichols, 1999). The constant progress in SCM is actually making
the managers realize that in order to remain globally competitive, one must invest in improved
information sharing techniques (Byrne and Heavey, 2006). The lean manufacturers have particularly
Chapter 2 – Literature Review
collaboration and simplify the elimination of waste (Iida, 2012). Demand information sharing appears
in literature as one of the most used information sharing techniques to study SCs.
2.3.2 Characteristics
A SC is considered to be fully coordinated when all decisions are aligned to fulfill the global system
objectives. The absence of coordination occurs whenever the decision makers have incomplete
information or incentives that are not compatible with the global SC objectives. In fact this feature is
indicated as one of the most crucial factors that influences the SC performance (Yu et al., 2010). The
absence of information sharing can cause excessive inventory and shortage levels, increasing lead
times and demand variability, as well as, reducing service levels (Byrne and Heavey, 2006).
The main threat of information sharing within a SC, lies on the fact that SC entities often pursue their
own objectives, causing a misalignment in the internal operations and force entities to make decisions
that can deviate from the optimal SC solution (Iida, 2012). Chen et al. (2007) emphasize that the lack
of trust and suspicions that arise can harm a cooperative development between organizations.
Therefore, the benefits generated by demand information sharing need to be comprehensively studied
and evaluated in order to encourage organizations to share information.
2.3.3 Demand information sharing applied in supply chains
Regarding the literature review on demand information sharing, Byrne and Heavey (2006) study the
impact of information sharing and forecasting on the SC performance of an industrial SC of a small to
medium-sized organization that produces multiple products using an ERP system. Assuming that
customer demand was based on historic data, the outcome of this paper reveals that the involved
distributors and the production entities experience cost savings of 9,7% and 6,3%, respectively, when
compared with the scenario of no information sharing. Ryu et al. (2009) study the SC performance in
terms of throughput, inventory level and service level, with two types of information sharing methods,
namely planned demand transferring method (PDTM) and forecasted demand distributing method
(FDDM). Within the PDTM, the retailer obtains the forecast information based on the market demand.
After a procurement plan is created, it is transferred to the downstream entities. Consequently, the
downstream entity generates its own production plan based on the information received by the retailer.
The FDDM assumes that a third party organization is responsible for forecasting the demand. Given
the inventory level and the lead time of each entity, the forecasted demand is distributed to each
entity. The simulation results demonstrate that FDDM has a better performance than PDTM in terms
of throughput. Whenever a high forecasting error occurs or there is high demand variability, FDDM still
maintains lower inventory levels than PDTM. However, if the demand variability is low, PDTM
outperforms FDDM. Yu et al. (2010); Chen et al. (2007) use a cross efficiency data envelopment
analysis approach to study the impact of different information sharing scenarios on the SC
performance, which include total costs, fulfillment rate and the customer service level. The possible
information sharing scenarios include none, partial and full information sharing between the SC
entities of their capacity level, inventory level and the customer demand. After performing a sensitivity
Chapter 2 – Literature Review
the scenarios according to the best performance measures. Curiously, the most efficient scenario
turned out to be the partial demand information scenario, rather than full information sharing. It should
be noted that a scenario which shares the capacity and/or inventory level without sharing demand
information, actually interferes with production and causes internal misunderstandings. Zhao et al.
(2002) investigate the impact of various forecasting models on the value of information sharing by
using simulation. Information sharing is categorized into three different levels, namely non-information
sharing, demand information sharing and demand and order information sharing. During
non-information sharing, the suppliers can merely proceed with production according to the downstream
orders. When demand information sharing is considered the retailers share demand forecast to the
suppliers. In case of the order information sharing, the retailers share demand forecasts and order
planning information to the suppliers. The simulation results indicate that the selection of a forecasting
model significantly influences the SC performance and the value of information sharing (Zhao et al.,
2002). Iida (2012) studies the alignment of the entities’ incentives in order to stimulate cooperative cost reduction activities. Two cost reduction effort agreements are considered to improve the SC
coordination, namely effort sharing agreements and effort compensation agreements. The effort
sharing agreements benefit a cooperative cost reduction, while the effort compensation agreements
compensate the entities for the cost of their efforts. Numerical results show that collaborative cost
reduction efforts reduce the production costs and strengthen competitive advantages.
Ding et al. (2011) analyze the value created of information sharing when reducing the inventory levels
and introducing a collaborative mechanism that encourages upstream profit sharing in a three echelon
SC. The results indicate that the retailer cannot obtain extra profit from information sharing. However, the bullwhip effect of the market demand is lowered, reducing the downstream entities’ holding costs. Further it is shown that providing incentive together with a profit allocation mechanism can benefit the
entire SC. Datta and Christopher (2011) use agent based simulation to study the efficiency of different
methods of information sharing and coordination mechanisms in order to reduce the uncertainty in a
SC. After performing a sensitivity analysis, regarding the centralization of the decision making, the
frequency of the information flow for production planning and the presence of information sharing
between entities, the authors conclude that under uncertainty, a decentralized decision making and
centrally coordinated material flow along with daily local stock and global inventory information based
production planning, and increased shared-information based ordering decisions, improves the
performance of a make-to-stock SC in all aspects.
The literature review regarding information sharing indicates that the use of demand information
sharing and other collaborative techniques generally benefits all the SC entities. However, if the
information sharing techniques are not effectively introduced in the SC, it can actually cause
Finished product
Raw Material 1 (1) Raw Material 2 (2)
Chapter 3
Case Study: Supply Chain Model
In this chapter a case study is presented in order to achieve the proposed objectives. This chapter is
divided into eight sections. The proposed supply chain (SC) is initially described under the following
sections: physical model, customer demand, demand forecasting, inventory management, SC entities
and the operations scheduling. Afterwards, a section is dedicated to the performance measures, in
which they are carefully identified and characterized. The final section is devoted to the
implementation of the SC scenarios that are defined to study the SC performance under the
established conditions.
3.1. Physical model
The modeled SC consists of a single retailer, one distributor, one manufacturer and two suppliers that
are producing and delivering a product to the final customer. This indicates that the modeled SC
features four echelons, as can be seen in Figure 3.1.
Retailer Distributor Manufacturer
Supplier 1
Supplier 2
Figure 3.1 – Supply chain constitution
The product is going to be produced at the manufacturer, according to a Bill of Materials (BOM) as can
be seen in Figure 3.2. In fact, one unit of the final product requires two raw materials, raw material 1
and raw material 2, with distinct quantities, namely one unit of raw material 1 and two units of raw
material 2.
Figure 3.2 – Bill of Materials
During the production phase at the manufacturer, the two raw materials suffer a value added
transformation, in which the product is produced with the help of a single machine. The production
quantity is determined whenever the finished product inventory at the manufacturer places an order to
refill its inventory. Further, the production quantity has to comply with a production capacity constraint
that limits the production to 250 units per day. The raw materials are supplied by two distinct suppliers.
Chapter 3 – Case study: Supply chain model
production has taken place, the product is shipped to the distributor. Afterwards the distributor ships
the product to the retailer, who satisfies the stochastic customer’s demand.
The retailer and the distributor operate according to the received downstream orders and can hold
stocks. The manufacturer and the two suppliers operate on the same basis. Besides this factor, these
last three entities also perform demand forecasts based on historical data.
It is assumed that the SC entities are located in mainland Portugal, more specifically, the retailer in
Lisbon, the distributor in Carregado, manufacturer in Leiria, supplier 1 in Porto and supplier 2 in
Coimbra, as can be seen in Table 3.1.
Table 3.1 – Geographical locations of the SC entities
Entity Retailer Distributor Manufacturer Supplier 1 Supplier 2
Location Lisbon Carregado Leiria Porto Coimbra
The shipment of product and raw materials between the SC entities are performed by road mode. The
duration of the transportation is stochastic and depends on the distance that separates the involved
entities.
Further, it is assumed that the SC operates 5 days a week and 8 hours a day. An overview of the SC regarding the entity’s locations, the used transportation mode as well as the information and material flows between the entities can be seen in Figure 3.3.
Triangular (0,3 , 0,38 , 0,44) (days)
Manufacturer Supplier 1 Supplier 2 Distributor Retailer Daily Orders
Raw Material 1
Raw Material 2
Triangular (0,15 , 0,2 , 0,23) (days) Daily Orders Daily Orders
Finished Product
TRIANGULAR(0.07, 0.15, 0.3) (days)
Finished Product
Daily Orders Triangular (0,05 , 0,13 , 0,2) (days)
Legend:
Information flow Material flow SC entity transportationRoad
Lisbon
Carregado
Porto
Coimbra Leiria
Figure 3.3 – Supply chain model
3.2 Customer demand
The customer demand is assumed to be the sum of a constant value 100 with an uncertainty that is
modeled using a random variable following a Normal distribution with mean zero and an unknown