SALOME MARIE ALICE LEMA
Restrictive measures on capital inflow in Brazil in the OTC derivative market: Impact on non-financial firms
SÃO PAULO 2016
FUNDAÇÃO GETULIO VARGAS
ESCOLA DE ADMINISTRAÇÃO DE EMPRESAS DE SÃO PAULO
SALOME MARIE ALICE LEMA
Restrictive measures on capital inflow in Brazil in the OTC derivative market: Impact on non-financial firms
Thesis presented to Escola de Administração de Empresas de São Paulo of Fundação Getulio Vargas, as a requirement to obtain the title of Master in International Management (MPGI).
Knowledge Field: Financial analysis
Adviser: Prof. Dr. Rafael F. Schiozer
SÃO PAULO 2016
LEMA, SALOME MARIE ALICE
Restrictive measures on capital inflow in Brazil in the OTC derivative market: Impact on non-financial firms / SALOME MARIE ALICE LEMA – 2016.
48p
Orientador: Schiozer, Rafael.
Tese (mestrado) - Escola de Administração de Empresas de São Paulo.
1. Regulação de derivativos cambiais. 2. Controle de capitais. 3. Mercado de balcão. 4. Exposição cambial. 5. FX beta Derivativos (Finanças). I. Schiozer, Rafael Felipe II. Dissertação (MPGI) - Escola de Administração de Empresas de São Paulo. III.
Restrictive measures on capital inflow in Brazil in the OTC derivative market: Impact on non-financial firms
SALOME MARIE ALICE LEMA
Restrictive measures on capital inflow in Brazil in the OTC derivative market: Impact on non-financial firms
Thesis presented to Escola de Administração de Empresas de São Paulo of Fundação Getulio Vargas, as a requirement to obtain the title of Master in International Management (MPGI).
Knowledge Field: Financial analysis Approval Date
____/____/_____ Committee members:
_______________________________ Prof. Dr. Rafael F. Schiozer (advisor) FGV/EAESP
_______________________________ Prof. Dr. Hsia Hua Sheng
FGV/EAESP
_______________________________ Prof. Dr. Joelson Sampaio
ABSTRACT
In August 2011, the Brazilian government taxed short positions in the foreign exchange (FX) derivative market in order to weaken the surge of post-crisis capital inflow, discourage carry trade strategies on the Real and avoid further local currency appreciation. Nevertheless, non-financial firms are also end-users of derivatives and might have suffered in case non-financial institutions transfer the regulatory cost to their clients in the real economy. To the extent that this tax increases the cost of hedging, firms may decide to hedge less, causing an increase in their exposure to currency risk. This paper aims at analysing if this regulatory change had an impact on Brazilian non-financial firms FX exposure, measured by the sensitivity of stock prices to currency fluctuation (FX-Beta). Therefore, it seeks to compare the FX beta of Brazilian non-financial listed firms before and after the implementation of the measure, to assess their degree of exposure to currency risk. In accordance with an increasing cost of hedging for those companies, results show that the beta difference also reached a riskier level.
KEY WORDS: Currency derivative regulation, Capital control, OTC markets, FX exposure,
RESUMO
Em agosto de 2011, o governo brasileiro passou a tributar posições vendidas no mercado de derivativos cambiais para diminuir o influxo de capital estrangeiro no pós-crise, desencorajar operações de carry trade e evitar que o real continuasse a se valorizar frente ao dólar. No entanto, empresas não financeiras também são usuárias de derivativos, e podem ter tido seus custos de proteção cambial aumentados, caso as instituições financeiras tenham transferido esse custo adicional para seus clientes na economia real. Na medida em que o tributo aumenta o custo de fazer proteção cambial com derivativos, as empresas podem ter decidido proteger uma parcela menor de sua exposição, causando um aumento em sua exposição cambial. Essa dissertação analisa se essa mudança regulatória teve um impacto na exposição cambial das empresas não financeiras, medida pela sensibilidade do preço das ações às variações cambiais (FX-Beta). Assim, o estudo compara os FX-Betas das empresas brasileiras antes e depois da implementação do tributo, para medir o grau de mudança em suas exposições cambiais. Em linha com o aumento no custo do hedge para essas empresas, os resultados mostram alguma evidência de que algumas empresas se tornaram mais expostas ao câmbio.
PALAVRAS CHAVES: Regulação de derivativos cambiais, controle de capitais, mercado
SUMMARY
Introduction ... 8
2 – Theoretical Background ... 13
2.1 The context of the subprime crisis and role of over-the-counter derivatives ... 13
2.1.1 The implementation of regulatory measures in Brazil ... 16
2.1.2 Macroprudential measure and its impact on the real sector ... 17
2.2 - The context of the 2011 OTC Regulation in Brazil ... 19
2.2.1 The grounds of capital control preceding the subprime crisis in Brazil ... 19
2.2.2 Capital control and the evolution of the exchange rate ... 20
2.2.3 The IOF tax implementation ... 21
2.2.4 The consequences of the IOF tax ... 23
3 – Methodology ... 25
3.1 - How to measure the impact of FX fluctuation on the stocks of non-financial companies 26 3.1.1 The concept of the beta coefficient in the Capital Asset Pricing Model ... 26
3.1.2 The factor model ... 26
3.1.3 The factor choice ... 27
4- Description of the data, computation of Betas and statistical results ... 30
4.1- Description of the data ... 30
4.2- Results of linear regressions, computation of ∆FX and z-tests ... 30
4.3 Currency exposure before and after the IOF implementation ... 31
4.4 Additional check – excluding firms with little FX exposure ... 33
4.5 Additional check – proportion of firms with FX exposure ... 35
Conclusion ... 37
Work Plan ... 39
References ... 40
Introduction
The subprime crisis of 2007- 2008 shed light on the risks of the opacity of the over-the-counter (OTC) derivatives markets. Many studies (e.g., Acharya et al., 2009) point to the role of OTC derivatives on the buildup of the US subprime crisis and its transmission to many developed economies. Developing countries, such as Brazil, have not been spared from the expansion of the derivative market and its counterparty risks during the series of default triggered during the 2007-2008 period. Foreign exchange (FX) derivatives allowed investors to conduct carry trade strategies in the Brazilian markets, contributing to the steady appreciation of the Brazilian Real from early 2006 until Lehman Brothers collapse in September of 2008 (see Figure 1). However, the global turmoil caused by Lehman´s bankruptcy triggered a massive outflow of investments from Brazil, as foreign investors fled to safer markets. This movement caused a depreciation of more than 30% of the Brazilian Real in the three weeks that followed Lehman’s demise. Brazilian end-users of derivatives, which were betting on further depreciation of the Brazilian Real by mid-2008, suffered huge financial losses after speculating on the derivative market (Lopes, Schiozer and Sheng, 2013). The derivative market enabled exporting Brazilian firms, such as Sadia, to assume very large short positions in foreign currency derivatives that far exceeded the amount that would offset their operational exposure.
Figure 1
USD-BRL exchange rate from January 2006 to December 2013
Source: built by the author with data from Bloomberg
After the turmoil, the countercyclical measures taken by the Brazilian government along 2009
1,5 1,7 1,9 2,1 2,3 2,5 2,7
Jan-06 Jul-06 Jan-07 Jul-07 Jan-08 Jul-08 Jan-09 Jul-09 Jan-10 Jul-10 Jan-1 1
Jul-1 1
inspired confidence by international investors, which steadily returned to the Brazilian market. This upsurge in capital inflow, along with a new wave of carry trade operations, caused the Brazilian Real to appreciate again through most of 2009 and 2010 (Araújo and Leão, 2015). To deal with the surge of capital inflow in the country causing the local currency to appreciate against strong currencies such as the US dollar, the Brazilian government implemented a new tax on short positions in FX derivatives to reduce the traditional carry-trade strategy on the local currency. While this measure was successful in restraining further appreciation of the Real, Araújo and Leão (2015) show that it had the unintended consequence of increasing the costs of hedging for Brazilian non-financial firms.
This new tax implied an increase in risk-transfer pricing from financial institutions, wishing to cover back the regulatory cost to their clients, non-financial firms. Araújo and Leão (2015) highlight that the cost of hedging for non-financial companies on the OTC market more than doubled for firms exposed to currency devaluation. Regulatory cost transfer, measured by a larger spread between non-deliverable forwards (NDF) contracts and future FX products in Brazil, increased (comparing the pre-reform period and the post-reform period). Hence, this regulation might have increased the costs for those firms to hedge from future FX losses, and the consequences on the non-financial sector have to be further analyzed.
The main objective of this study is to investigate the impact of a regulatory change, aimed at capital control, on non-financial firms’ ability to hedge against currency fluctuations. More precisely, it investigates to which extent an increase in costs on the
derivative market decreases the firms’ ability to hedge and, because of that, increases the exposure of non-financial firms to currency fluctuations. For this purpose, it uses the Brazilian case, studying the impact of the implementation of the 2011 tax (IOF – Imposto sobre Operações Financeiras) on OTC derivatives with a new approach. The objective is to evaluate whether the regulatory cost increase of FX derivatives impacts the ability for non-financial firms to hedge against exchange rate volatility. To test this hypothesis, I check
whether the sensitivity of stock prices to currency fluctuations increases after the implementation of the IOF, compared to the previous period.
Instead of relying on predictive macroeconomic data and models, I evaluate the sensitivity of non-financial firms to this regulatory change at the micro level – comparing the sensitivity of stock prices of non-financial firms to exchange rate before and after the measure. My
with derivatives, thus increasing the sensitivity of the firms’ stock prices to currency fluctuations
My analysis relies on macro theory on foreign exchange regulation and capital control measures. Blanchard, Olivier, Dell'Ariccia, and Mauro (2013) study how the 2007-2008 financial crisis has been a milestone on the consensus on macroeconomic policy and to which extent the macroprudential tools that have been implemented in the past few years have demonstrated their effectiveness and reliability. They also discuss the effectiveness of the objectives and tools set by monetary policies after the crisis and argue that countries subject to high level of friction with high-segmented markets could target the inflation and exchange rate as feasible objectives. Moreover, they point the fact that this kind of intervention is desirable when this set of measures are implemented due to temporary capital flows in or out of the country, reflecting a change in fundamentals indicators.
As Brazil was a precursor to implement capital control regulations and restricting measures on capital inflows, there is already some literature on the impacts of such measures in the country. Jeanne (2012) studies the adoption of capital inflow taxes by Brazil and its rationale, and argues that this policy of prudential capital controls is in accordance with the theory on optimal prudential tax.1 Hence, what has been at stake was to study the impact the tax had on the Brazilian exchange rate, which have been described by Blanchard et al. (2013) as a mixed effect: while the tax prevented further appreciation of the exchange rate, it also slowed down portfolio inflows. This argument is followed by Chamon and Garcia (2013), who state that the impact of the tax on the exchange rate have nevertheless been limited. 2
Forbes (2007) studied the Chilean case, during the 1991- 1998 period during which the country implemented taxes on short-term inflows. Using an Euler-equation framework, he analyses to which extent those capital control measures increased financial constraints for publicly traded firms especially for publicly traded small and medium sized companies that found it more difficult to obtain capital, which represents a significant cost for emerging
1 This theory states that the tax should be applied to capital inflows, have a countercyclical effect, which means that the tax should be raised as soon as an increase of capital inflows is identified, and that there should be a segmentation in the type of tax depending on the riskiness of the flow.
2 Their paper discusses and analyses the effectiveness of capital control in Brazil, and they argue that the capital control measures adopted during the post-crisis period also had positive impact regarding the segmentation of the Brazilian market from the global one.
countries that rely on smaller firms. Closer to My study, Mello and Parsons (2012) analyze the implications of the regulatory actions after 2008 that encourage a better control on OTC derivative markets and study to which extent this new regulatory framework have a significant impact on the way corporations hedge using financial derivatives. They also focus on non-financial firms relying on hedging strategy to counter commercial risks.
Hence, the theory analyses the effects and externalities of restrictive capital control policies, in accordance with the global questioning raised right after the 2007 – 2008 crisis. Similarly to this objective, I will focus on the externalities caused by the measures adopted in 2011 mainly on FX OTC derivatives on non-financial firms; more precisely I will compare their degree of exposure and riskiness, measured in my study by their FX-beta (the sensitivity of stock returns to fluctuations in the exchange rate). Hence, I decided to estimate the effect of the tax on Brazilian publicly listed non-financial corporations by comparing the beta of those firms during the pre-measure period (2010-2011) with that of the post measure period (2013-2014). The test will be to measure to which extent the beta has increased during this time frame.
My results do not support the hypothesis that the introduction of the tax on OTC derivatives decreases the ability of nonfinancial firms to hedge. Actually, I do not find significant difference in the pre and post-tax sensitivity of stock prices to currency fluctuations on average. In addition, the proportion of stocks with significant exposure to FX risk actually decreases after the introduction of the tax, which is inconsistent with the hypothesis that the tax reduces the firms’ ability to hedge. Nevertheless, I find that, for a small subsample of firms, whose stocks present positive sensitivity to the exchange rate, the tax is associated with an increase of sensitivity to the exchange rate. Although this last result has to be taken cautiously because of small sample size, it is consistent with the previous findings of Araujo and Leão (2015). They find (and explain why) that the cost of taking short positions on the USD increased significantly more than taking long positions. Therefore my result is consistent with the rationale that the IOF decreased the hedging ability for a set of firms that faced increased costs of hedging.
The remainder of this thesis is as follows. Chapter 2 describes the theoretical background used to implement this analysis, and the context in which this measure has been implemented. Chapter 3 describes the methodology that was used to measure the level of exposure to the
exchange rate of Brazilian publicly listed non-financial firms; Chapter 4 presents the data, estimation results and their interpretation. Finally, Chapter 5 presents the conclusions.
2 – Theoretical Background
2.1 The context of the subprime crisis and role of over-the-counter derivatives
A series of regulatory measures on the over the counter (OTC) derivative market was put in place right after the financial crisis of 2007 – 2008 in many countries. The financial crisis exposed the failures of the OTC derivatives market and the contributive role of OTC derivative products in the spread out of default and counterparty risk that triggered the systemic crisis we know today. Large counterparty exposure had build-up prior to the crisis, and the global default spillover has highlighted the lack of risk management and control over many markets. Many weaknesses on the OTC derivative market, such as their opacity emphasized the need for a better regulation and standardization (Acharya et al., 2009). This market is characterized by a large variety of products, asset classes and regulations, and OTC derivatives were used in a variety of ways – such as for hedging purposes, investing and arbitraging - the pre-crisis period has been characterized by a rapid growth by far stronger than that of the underlying assets of those derivative products (FSB 2010). Post-crisis analyses have shed light on the effects of those products on the propagation of the 2007 – 2008 crisis. New regulations targeting more disclosure and transparency of operations, such as the Dodd-Frank Act of 2010, aimed at reducing the probability a financial crisis due to counterparty default and risk mismanagement, which pose particularly high negative externalities (Acharya and Bisin, 2014). Moreover, these series of measures have been implemented in order to help developing economies to deal with the wide exposure to capital inflow and currency fluctuation they have been confronted to, right after the crisis. What was at stake was to build a stronger market to offset counterparty exposures, contagion risk from interconnected participants on the OTC derivative market and the lack of transparency of trades and exposures.
Hence, in September 2009, it has been agreed in Pittsburgh summit by G20 leaders that “all
standardized OTC derivative contracts should be traded on exchanges or electronic trading platforms, where appropriate, and cleared through central counterparties by end- 2012 at the latest 3”. In June 2010, the same summit in Toronto agreed to work coordinately for the
acceleration of those regulations regarding the increase in transparency and standardization of
the OTC derivative market 4. Two years later, the idea of international standards on margining for non-centrally declared OTC derivatives has arisen (FSB, 2013). The main concern about OTC derivatives related to the difficulty of evaluating the counterparty risk – and more generally, the risk of default proliferation. Acharya & Bisin (2014) shed light on the opacity of OTC markets and how it has played a central role in the 2007 - 2008 financial crisis. This lack of transparency, where exposure is generally not publicly disclosed, represents a counterparty risk externality and such a structure can lead to excessive leverage in the form of “short positions”. Therefore, the underlying concept under the derivative reform anticipates a long-term benefit, as reducing counterparty risk would limit the potential losses and prevent from a major spread through the OTC derivatives network of firms exposed.
Even if pledges for regulation existed before the crisis, a closer look at OTC derivatives and the propagation of the crisis unmasked counterparty exposures related to those products. OTC derivatives are contracts traded between two parties, traded off-exchange with pre-determined and agreed terms and conditions by the buyer and the seller and bilaterally, which means no central institution would gather the contracts to treat them. This makes the follow-up of the market activity and the right use of some practices more complicated, and can impede an effective risk management. Besides, OTC derivatives are instruments mainly designed and adapted for specific needs of certain counterparties. In that sense, their profile can be unique and their implications in terms of general distribution of risk inside the financial market can be very difficult to determine. Furthermore, volumes negotiated on such markets have reached a steady growth rate: between June 2005 and June 2008, the market volume doubled, reaching c. USD684 billions –and the growth has been even stronger on some market segments such as CDS. (Russo, 2010). Such a structure of a market and its growth during the past years before 2007 actually triggered propagation and amplification of the crisis. At that time, those counterparty exposures were not collateralized – which would be public information and serve as a mitigant - and end-users of derivatives products could record losses when the probability and likeliness of counterparty default increased, or were effective. The level of this risk is really difficult to assess, because the exposure of each agent is usually not publicly disclosed. This opacity in the OTC derivative market and the lack of transparency on the exposure of each agent led to excess leverage, especially in the form of short position – where
4 The recommendations of the summit address practical topics regarding the points raised on each summit – the implementation of central clearing and standardization on the OTC derivative market. The propositions highlight actions such as the implementation of an electronic trading platform, and reporting to qualified authorities.
default comes after. Hence, the opacity of the OTC derivative market and the mechanism of counterparty risk and default spillover are considered are partly responsible for allowing the build-up of such large exposures leading to default spread (Acharya and Bisin, 2014).
Hence, this model and the previous crisis highlighted the need for regulatory changes in such a market. The past events shed lights on the need to remedy to the main weaknesses of OTC derivatives markets. Even if such weaknesses have been obvious during the subprime crisis related to the CDS, it took some more time to admit that OTC derivatives markets present structural deficiencies that must be dealt with, regarding every asset class. The main suggestions regarding regulation of OTC derivative markets highlighted the need for transparency on those markets. Given operations are bilateral, public authorities and market participants find it much more difficult to follow correctly the accumulation of exposures and assess potential risks – either central banks or surveillance authorities- or at least much more difficult than if they dealt with financial operations conducted on an organized market, or a centralized clearing house. Therefore, to remedy the opacity of this market and to respond to the risk, some recent regulatory reforms in 2009 and 2011 suggest the need of new requirements to clear the OTC derivative market (FSB, 2010)
· The first reforms shed light on the need for standardization, which would give more transparency to the market. The proportion of standardization in the OTC derivative market should be increased, with the objective to implement central clearing and organized platform that would be in charge of trading. Hence, standardization and a better use of safer channels should come with proper incentives for market members to use those standardized products. · Indeed, one requirement concern suggested the creation of central counterparties (CCPs) and central clearing, which would observe and register all trades, set prices and provide transparency on data and trades. This recommendation goes hand in hand with the first suggestion, as a derivative contract would first need to be standardized to be suitable for clearing. More specifically, CCPs would register those trades to implement transparency on the market, but also play the role of a buyer and a seller on the market, which would reduce direct bilateral interconnection between banking institutions and, in a certain extent, contribute to the limitation of contagion risk in the financial market. This would be a sufficient condition for counterparty risk internalization and better risk-sharing –such as loss sharing in case of default of one of the members- limit excessive leverage and the potential risk of default spreading through the OTC derivatives market. (Bank for international Settlements, 2013).
· Therefore, regulatory reforms suggest a system of electronic platform trading and a reporting of OTC derivative contracts to trade repositories. The market participants would provide information to central authorities, which would increase transparency and support authorities in their role of assessing market risk and stability, leading market surveillance, and supervision of each market member. Those suggestions are in line with the need for authorities to have a general overview of the OTC derivative market, which can be achieved through a full access to the data on trades.
· Finally, recommendations suggest higher margin requirements for trades that would not be centrally cleared, as well as capital requirements for banks for derivatives-related exposures (BIS, 2014).
2.1.1 The implementation of regulatory measures in Brazil
This mechanism also occurred in Brazil right after the subprime crisis and the OTC market had also triggered a series of financial losses for certain derivatives end-users. Indeed, the Brazilian market has not been set aside from the expansion of the derivative market and its risks. It appeared that during this past period, some non-financial firms speculated a lot on the derivative market – assuming short positions. The BIS (Bank for International Settlements) estimated that financial losses of Brazilian companies in the last quarter of 2008 attributable to FX derivatives reached USD 25 billion. 5 Thus, through structured derivatives, some Brazilian firms speculated assuming short positions in foreign currency. Exporting firms would hedge their future cash flows by entering a short position on the FX derivative market. Companies such as Sadia and Aracruz suffered huge financial losses in 2008. They realized financial operations correlated to the exchange rate of the Brazilian real with the US dollar for hedging purposes, ie the protection of their activities exposed to the exchange rate. They increased their exposure during the 2007- 2008 period6, right before the surge of default in the
derivative market, the propagation of the crisis and the surge of capital inflow in Brazil. With the devaluation of the real, those companies with high FX exposure for speculation and hedging strategies suffered huge financial losses (Novaes, 2011).
5 Bis Quaterly Review – International Banking and Financial Market Developments, June 2009. This
amount was almost four times as high as the estimated losses for Mexico (USD 4.0 bn).
6 In case of Sadia, the notional liquid value of short positions future contracts on the FX market went
2.1.2 Macroprudential measure and its impact on the real sector
Therefore, the risks associated to the FX derivative market are not only related to the opacity of transactions and counterparty risk. This financial market is also strongly linked to the real economy, as non-financial firms would enter the market for hedging purposes due to FX exposure during their current cycle of operation. Derivatives play an important role for the real economy and the financial system. They contribute to improve risk management in the real economy, mainly by distributing them between the players on the market that are best able to support them and by facilitating hedging regarding risk exposure. Derivative products are linked to the real sector in the sense that they can enlarge the investment opportunities, by allowing a quick access to financial markets for placements of small amount, with transaction costs well below those of a direct placement in the underlying asset. Therefore, they can reinforce the global efficiency of the market by making advantage of price gaps between derivative markets and real markets. However, increasing leverage inside the derivatives can also be a source of risk for the real economy itself. OTC derivatives have characteristics that makes them all the more vulnerable regarding systemic risk (Banque de France, 2010). Nevertheless, non-financial firms would rather trade on OTC markets –forward and futures. Bolton, Santos and Scheinkman (2012) illustrate the differences of those markets and give an explanation for this choice. In their model, forward markets enable both parties –called dealers and producers- to hedge against a spot-price, at less favorable prices. Indeed, on the OTC forward market, firms are usually subject to lower margins calls, which explain the attractiveness of this market. As long as the firm is not over-hedged, the producers themselves benefit from every variation away from the spot-price due to a reduced counterparty risk. The structure of OTC derivatives products make the OTC market attractive for non-financial firms, and their non-daily settlement make their customized maturity and underlying asset appropriate for those users. Indeed, non-financial firms looking for new projects and both dealers have an incentive to meet outside the exchange as the first one might find better offers, and the second one could use the information he is providing to retain best projects. Hence, the OTC derivative market usually represents the appropriate market for hedging and the theory of Bolton, Santos and Scheinkman suggest a new segmentation of this financial market. “Smart-money” investors would trade on opaque OTC markets in order to gain protection of their projects and information, and “uninformed investors” would rather trade on
organized markets. This theory help understand the growth in size of this market during the past years before the 2007 – 2008 crisis, and how non-financial firms might benefit from the opaqueness of this market. This explains why some firms would rather avoid disclosing their prices, volumes and fees in centralized and organized exchanges.
Therefore, as the OTC derivative markets has been really important for the hedging of non-financial companies, the reforms implemented during the past few years have had a direct effect on them. The planned reforms had anticipated costs such as an increase in risk transfer price, due to the intent of financial institutions to cover back the impact of the direct costs of reforms.
Those regulatory reforms newly introduced –after 2008- encouraged clearing and centralized exchanges on OTC derivative markets, and therefore increased required margins for those trades and for the dealers themselves. Those reforms have a certain implication for financial firms on their decision to hedge. These costs have a direct impact on how non-financial firms will hedge regarding non-financial derivative product, seeking to hedge commercial risk. This debate has been opened after the approval of the Dodd-Frank Act in United States, in June 2010, as a large number of Companies would complain about how margin requirements affected their capacity for hedging.
Therefore, the cost of hedging may influence the decision of non-financial firms regarding their ability to hedge on financial markets and deter them of using derivatives. If firms are getting more exposed to the risk, such a measure could increase the probability of a crisis in case of a downturn. Consequently, the trade-off is difficult to assess regarding the benefits and the costs of a new regulation applying in the OTC derivative market, as the regulation could diminish the counter party risk and limit default contagion, yet the real sector might find it harder to hedge and could be more exposed to external shocks.
Brazil has been considered as a precursor in implementing capital control in its capital and financial markets. Before the 2007 – 2008 the country was experiencing a positive momentum, culminated with its upgrade by S&P, Fitch and Moody’s to investment grade in early 2008, which prompted a massive capital inflow to the country. With those capital inflows may come benefits such as FDI directed towards investment opportunities, knowledge or technology transfer.
After Lehman’s bankruptcy in September, the country experienced a short period of very large capital outflows, which led to the depreciation of the local currency and caused losses to non-financial firms exposed to this risk, as described above. However, starting in mid 2009, foreign investors regained confidence in the country, and a new wave of capital inflows started. Given the September 2008 experience, Brazilian authorities were well aware of the risks those inflows can bring – the main concern being inflation, currency appreciation and the possible loss of competitiveness of the country. Eichengreen (2013). This opened a path for regulation and control, also at the international scale, leading to a change in conventional wisdom, with the IMF acknowledging that capital flows could rise important risks – booms and bursts in prices or credit, a volatility that could lead to instability, and the disconnection flows compared the size of a given country’s economy or market capacity. Those inflows could make countries more vulnerable to contagion from global instability. Hence, the IMF developed a balanced view on capital controls for countries that had to deal with the risks associated with inflow surges, and that might used macroeconomic policies and financial regulation to tackle those risks (IMF 2012). In the case of Brazil, this recovery caused the currency to appreciate, leading to a loss of competitiveness of the real sector. Therefore, during the post-crisis period, from 2009 to 2011, Brazil implemented a series of measures targeting the financial market in order to regulate capital inflows and impede the Brazilian currency to appreciate.
2.2 - The context of the 2011 OTC Regulation in Brazil
2.2.1 The grounds of capital control preceding the subprime crisis in Brazil
The regulation of the financial and OTC derivative markets in Brazil highlights the efforts the country has made to manage capital inflows. Brazil has been really aware of loose monetary policy of developed economies that would generate capital inflow towards emerging countries. In October 2009, Brazil decided to adopt taxes on portfolio inflows to limit the post-crisis redirected capital. During the 2009-2011 period, the financial policy of Brazil and new regulations targeted capital control and the deterrence of inflows in the country. Each measure has been oriented towards more transparency on the market. For instance, the inflow tax was announced at market closing and has been implemented the business day following
the announcement – the only exception has been made for the tax on derivatives. Those norms follow the long history of capital control in Brazil, which represents a unique case study, starting from the first tax on exchange rate of entry transactions in the nineties and followed by implementations of different IOF (Tax on Financial Transactions) rates on foreign transactions. Historically, the IOF tax rate has changed a lot – 9% on fixed income during the nineties, reset to zero after the 1998 Russian crisis that caused massive capital outflows from developed countries, briefly established at 1,5% in 2008 right before being removed again after the crisis contagion. The post-crisis period has been a source of concern for Brazil regarding the massive entrance of capital and the appreciation of the Brazilian Real and triggered a period of tighter capital control. Whereas equity inflows are perceived as safer than any other type of flows, Brazil began to tax equity and fixed income from October 19th, 2009 to December 2011. The past two regulatory decades show clear capital control discrimination between fixed income and equity: the Brazilian laws mainly discriminated portfolio inflows and the other flows (such as foreign direct investment - FDI) remained untaxed on majority (Jinjarak and Zheng, 2013).
2.2.2 Capital control and the evolution of the exchange rate
At that time, Brazil was a great candidate for foreign investors. The Brazilian macroeconomic environment was characterized by a recent floating regime – from 1999- and was at that time known for having strong interest rate differentials in relation to other emerging countries. Foreign investors continued to bet on the appreciation on the Real7 by being short in the FX
future market – which means that they were selling dollars and buying Reals. Hence, the Brazilian Real continued to be pressured on the future market. This kind of derivative carry trade has been all the more attractive for foreign investors that the characteristics of NDF on the FX markets were specific, due to the possibility of fulfilling the Brazilian margin requirements thanks to borrowed securities or even guaranties from local banks. 8 Therefore, due to the high Brazilian interest rates, investors would pursue carry trade strategies. For instance, a strategy would consist in financing in a strong foreign currency – at that time, the USD - and converting those resources in Brazilian reals. Foreign investors exposed to the risk of the devaluation of the real would benefit from the differential of interest rates between the
7 The Brazilian Real had been appreciating for 7 years
two countries by taking a short position on the currency with the lowest interest rate – in this case the USD - in the FX derivative market.9 (Burnside, Eichenbaum and Rebelo, 2011) This strategy is comparable to a traditional carry trade in which foreign investors would borrow US dollars at the American interest rate in order to invest in Brazilian bonds - the final payoff would be identical. Moreover, speculative investors could buy on offshore markets NDF reals (Non- Deliverable Forwards), markets that were not affected by the Brazilian inflow tax and that had been fueled by the great performance of the real on future markets. Indeed, foreign banks big enough to have subsidies in Brazil could sell the Brazilian real offshore to those investors betting on the appreciation of the currency and hedge at the same time against their exposure using the onshore future market.(Kaltenbrunner 2010). Nevertheless, it has been demonstrated that offshore currency markets can represent a challenge in terms of money supply control. Offshore activities can have strong implications regarding the exchange rate in one currency, as the degree at which it fluctuates depends of the balance between the level of long and short positions in offshore markets (BIS, 2010). Therefore, capital control policies may be willing to implement some restrictions on the ability of offshore markets members to be long or short.
2.2.3 The IOF tax implementation
Thus, a series of measures implemented in 2011 has targeted a better control of capital inflow in the country, financial stability, and to contain the currency rally. The Central Bank of Brazil announced on January 6th, 2011 a reserve requirement on bank’s liabilities –
unremunerated - above a USD 3 billion threshold, to become effective four months later, to limit the possibility for financial agents to bypass current financial regulations. On July 26th, 2011, Brazil announced a tax on the notional amounts of derivative products, which ranged from 1% to 25% tax rate, becoming effective less than a month later10. This tax has a great
9 The concrete example of carry-trade strategy from a foreign investor would be then to sell BRL/USD
future (or forwards) contracts. This means the investor is long on the Brazilian interest rate, and short in the USD interest rate. This strategy relies on the principle there is an established relationship between the foreign interest rates, the domestic interest rate and the currency values (spot value and forward values). This is the covered interest rate parity.
10 “We’re reducing the advantages enjoyed by speculators, and we expect the real will weaken or stop
impact on derivatives speculation as it is computed on the notional amount of those FX derivatives. Furthermore, the Brazilian government resorted to other types of regulation to reduce the carry-trade realized on its currency, and the IOF also targeted to tax the companies’ short term foreign borrowing - the loan maturity has been revised a lot since then - bank reserve requirements that went short in FX spot market. Indeed, the effectiveness of this regulation also comes from the fact that the increase of the tax on financial operations (IOF) has been put in place with the Decree 6,306/2007 that establishes the IOF on financial credit operations realized by financial institutions,11 foreign exchange operations, insurance transactions and securities transactions. This tax range depends on the nature of the transactions, as shown in table 1 below. These measures, along with the IOF on fixed income flows, basically targeted to reduce the traditional carry trade.
Table 1
Transaction Tax rate
Foreign exchange transactions 0 – 25%
Security transactions 1 – 1.5% per day
Insurance transactions12 0 – 25%
Credit transactions 0 – 1.5% per day
Gold transactions 1% payable on the first sale
Source: International Tax Review (internationaltaxreview.com)
Between 2010 and 2011, each new regulation put in place targeted a decrease in the short position in the FX market to impede the local currency to appreciate. The tax on foreign exchange transactions and insurance transactions could be levied at a maximum of 25%. hurting exporters and domestic production.” said Finance Minister Guido Mantega in Brasilia on July 27th, 2011, reported by a Bloomberg article on the same day – see “Brazilian Real Slides as Government Taxes Currency Derivatives” by Gabrielle Coppola and Ye Xie
11 Or companies whose activities are related to credit supply – such as credit management activities,
risk management activities, factoring services as defined in (Lei 9.249, December 26th, 1995, art. 15, §
1o, III, alínea “d”, and Lei 9.532, December 10th 1997, art. 58) available on planalto.gov.br
Consequently, this measure managed to have a significant impact on the balance on net and short positions on the FX derivative market and the currency began to depreciate. It became more costly to trade the BRL is the derivative market.
According to Araújo and Leão (2015), between June 2010 and October, 2010, there has been a rise in the short positions of non-resident investors (except options), showing a carry trade strategy using FX forwards in order to avoid the implemented tax for fixed income inflows raised at 2%. October 2010 is a milestone as non-resident short positions peaked at USD 35 billion right before this tax was incrementally raised from 2% to 6%, which reduced temporarily the level of short positions. However, quickly short positions came back to their previous level. However, the trend was reversed in September 2011, demonstrated by a significant decrease in the value of short positions, which remained stabilized at a lower level between USD 15 billion and USD 20 billion during the following quarter of 2011, and in parallel an increase in long positions. The tax on short positions on the FX derivative market in September 2011 impacted short and long positions balance among other effects.
Figure 2
USD/BRL exchange rate 2010-2012
Source: built by the author with data from Bloomberg
2.2.4 The consequences of the IOF tax
Afterwards, to limit the real’s advance, the tax on fixed-income inflow from foreign investor tripled to 6% in October 2011 and additional regulations were implemented in early 2012 – whose main purpose were to extend the tax on foreign borrowings with larger maturities – up to a three year maturity, extended to a five-year maturity. Those restrictions, coupled with the
1,5 1,7 1,9 2,1 2,3
decision on a weaker interest rate policy by the Brazilian central bank helped diminished the capital inflow in the country. Indeed, the SELIC interest rate (Brazilian equivalent to the US Fed Funds rate) went down to 7.5% at the end of August 2012 and down to 7.25% on October 2012, after a peak of 12.5% in April 2011 (see Figure 3).
Figure 3
Brazilian annualized SELIC rate 2010-2014
Source: built by the author with data from bcb.gov.br
Nevertheless, inflation and weaker interest rates started to become a concern, and by the end of 2012, the depreciation of the real reached a limit, which made the Brazilian Central Bank remove some capital restrictions in place. The IOF tax revision targeted the simulation or inhibition of the foreign currency flows in or out of the country. Thus, the previous IOF tax implemented on 2012 on foreign borrowings has been restricted to smaller maturities – two year maturity in June 2012, to a one year maturity in December 2012 and revised to 180 days in June 2014. Moreover the measure has been followed in 2013 by the reset at zero of the tax on fixed income inflows and a loosen IOF on notional amounts of FX derivatives – until June 12, 201313 at a level of 1% on notional amount of derivatives, at the time of acquisition, of the
sale, or at maturity of the short position derivative.
Chamon and Garcia (2013) assessed the effectiveness of those regulations regarding their capacity to restrict capital inflow in the country and their impact on the exchange rate. They
13 See Decree No. 8.027, of June 12, 2013
4 6 8 10 12 14 Ja n-10 A pr -10 Jul -10 O ct -10 Ja n-1 1 A pr -1 1 Jul -1 1 O ct -1 1 Ja n-12 A pr -12 Jul -12 O ct -12 Ja n-13 A pr -13 Jul -13 O ct -13 Ja n-14 A pr -14 Jul -14 O ct -14 Ja n-15 S el ic ra te in %
show the exchange rate reacted strongly in relation to the last set of measures launched in 2011. They also highlight the fact that those results come from a combined effect, in complement with the control on other channels to avoid carry trade strategies. They also conclude highlighting that this control can also have an impact on associated costs. Araújo and Leão (2015) studied the impact of the new taxation in FX derivatives in the cost of hedging in OTC markets – mainly for non-financial firms. To assess the potential cost increase of hedging on those markets, they computed the spread between NDF prices of the period before and after the implementation of the regulation and the FX future prices. They assessed the impact on FX Derivatives in two cases: i) when those firms buy NDF and ii) when firms sell NDF. Results have been significant in the first case essentially, and the study report a strong impact for non-financial firms, with a cost increase between 50% and 183% in the sample. Therefore, the results show a higher spread after the implementation of the tax in September 2011 means that the cost of the tax has been transferred from banks to non-financial firms. More precisely, it is stated that the implied cost of hedging for companies already exposed to the devaluation of the real more than doubled, which is a concern as those companies might have find it too costly to hedge on the FX market and cold have make them vulnerable to currency risk.
3 – Methodology
As stated before, the objective of this study is to investigate whether the introduction of the IOF on OTC derivatives in 2011 in Brazil had the unintended consequence of increasing the exposure of non-financial firms to currency risk.
I used a simplified version of the Chen, Roll and Ross (1976) model, i.e., I use 2 macroeconomic factors (the return of the market portfolio and of the exchange rate) in the model, and measure the sensitivity of stock returns to each of these factors. 3 steps are needed to complete the analysis: i) identify the factor that influence most the asset return and set a time series regressions to estimate the factor needed ii) compute the market return, the asset return the risk premium for each and iii) measure the impact of this factor on the asset by computing the beta.
3.1 - How to measure the impact of FX fluctuation on the stocks of non-financial companies
3.1.1 The concept of the beta coefficient in the Capital Asset Pricing Model
The β coefficient has a central role in the classical theory of the financial model of the Capital Asset Pricing Model (CAPM). The β describes the sensitivity – and therefore the exposure- of a given asset to the systemic market risk – which represents the risk that can’t be suppressed by portfolio diversification. Therefore, an asset with a beta equal to 1 means that its price will follow the main variation than the market. A beta larger (resp. smaller) than 1 implies that the asset price will follow amplified (resp. diminished) variation compared to the market. A negative beta implies that the asset price varies in a contrary movement than market price. Hence, the beta has a central role in the pricing of an asset: there is a required premium compared to the risk free one has to expect for each investment, and the risk premium required is proportional to the market risk premium. The coefficient determining this proportional relationship is the beta, ie the measure of the risk lying in the asset.
3.1.2 The factor model
The CAPM model is a single factor model: the systematic market risk is the only factor that has an impact on the expected return. The Factor Model suggests there is not only a unique factor that would determine and affect the return of a given financial asset. However, Ross developed a new alternative model at the end of the 1970 that enables the inclusion of multiple risk sources, and therefore multiple risk factors. Those factors can be exogenous and usually represent economic variables considered as relevant, or endogenous. Most chosen factors are exogenous and stand for macro-economic elements related to monetary policies, economic growth, interest rates, exchange rates, sector indicators, or dividend distribution rates among other examples. Therefore, an estimated beta is computed for every risk factor used in the model using linear regression. Moreover, Ross developed the Arbitrage Pricing Theory (APT) as a model to value financial assets. The APT models the expected return of an asset by a linear function of different factors, weighted by their specific coefficients beta. The multi factor model states that:
Where:
𝛽!!, 𝛽!!, …, 𝛽!" are the factor loadings,
𝐸(𝐹!), 𝐸 𝐹! , … , 𝐸(𝐹!) are the factor risk premia,
𝜀! is the error term with a mean of zero and assumed not to be correlated to the factors.
Indeed, this formula states that the expected excess return of a given asset is due to factor loadings (the beta) and factor risk premia. All the common factor variables are considered as latent and that their structure can be deduced from the observed returns. The Chen, Roll and Ross (1976) model gives an approach to compute those factors –macroeconmic variables, using linear regression. The understanding of those factors is critical as they reflect the common movement in security returns. They explain the expected returns computed for a given asset, security or portfolio.
Hence, this paper relies on the underlying theory of the multifactor model to specify the factor chosen as an appropriate risk indicator for the currency risk exposure of Brazilian publicly listed non-financial firms.
3.1.3 The factor choice
As the objective of this study is to measure to what extent non-financial firms are more exposed to currency risk after the implementation of the Brazilian tax on FX derivatives, the macroeconomic factor that will be used in the model will be directly related to the USD/BRL exchange rate return. Indeed, the use of currency derivatives is useful for non-financial firms and positively correlated to growth opportunities, which is described by Geczy, Minton and Schrand (1997). They argue that firms extensively exposed to foreign exchange rates are more likely to use those currency derivatives, and that the exposure to the exchange rate is a significant factor in their choice of derivative instrument. Therefore, the second factor used in my model will be the subtraction of the change in the USD/BRL exchange rate and the risk free on that same period. Therefore, to analyze to what extent firms have been exposed to currency risk, I will use the multi factor theory to compute for each Brazilian publicly listed non-financial firm the beta associated to the exchange rate for a given period. The resulting formula used to compute the FX beta for each company is as follows for a given period t:
(Ri,t - Rf,t) = αi +βM,i (Rm,t - Rf,t) +βFX,i (RFX,t - Rf,t) +εi,t (2)
With
Rm,t the market return, ie the IBovespa return in time t;
Rf,t the return of the risk free rate, i.e. the SELIC rate14 in time t;;
RFX,t the USD/BRL exchange rate return in time t;;
ΒM,i is the beta of firm i associated to the market return (to be estimated in the regression);
ΒFX the beta of firm i associated to the exchange rate return (to be estimated in the regression);
εi,t the specific error term with a mean of zero.
To compute historical returns of each company in the sample, the market returns – i.e. the return of the Ibovespa - and the exchange rate returns, I use weekly return on each of the stocks, as well as the market portfolio and exchange rate returns during the pre-tax (2010-2011) and post-tax (2013-2014) periods, I use weekly to have smoother indexes and consistent data while computing the returns, following the recommendation of Campbell, Lo, and McKinley (1997). The weekly returns have been computed using the logarithmic formula also known as continuously compounded return formula, following most of the literature (e.g., Campbell et al., 1996):
𝑅!,! = ln (!!!,!
!,!!!) (3)
Where,
Ri,t is defined as above (and, more generally, it also applies for i=M and i=FX) and;
Vi,t and Vi,t-1 are the values of stock i in t and t-1 respectively (again, more generally, it applies
to the market portfolio and the exchange rate);
The main point of the study will be to compare the FX betas of firms prior and following the implementation of the tax. I define the 2010-2011 years to analyze the period prior to the regulatory measure and the 2013-2014 is the post-measure period considered.
I run the regression of equation (2) for each company in each of the periods (pre and post-tax). Therefore, for each company i, I estimate one foreign exchange Beta for the pre-tax period (βFX;i;pre-tax), and another FX Beta for the post-tax period (βFX;i;post-tax). The measure of
change in the sensitivity of the stock returns of firm i to the exchange rate is given by:
∆!",!= 𝛽!",!,!"#$!!"#;! − 𝛽!",!,!"#!!"#;! (4)
14 The selic rate stands for « sistema especial de liquidacao e custodia » is the target interest rate set
by the Central Bank of Brazil in order to influence short-term interest rates in the brazilian economy. This rate is computed as the average of 1 day maturity interbank interest rates for traded government securities.
Therefore, ∆FX;i is a measure of a change of exposure of the price of the stock of firm i to the
USD/BRL exchange rate. I compare pre-IOF FX betas to post-IOF FX betas in absolute values.
The main hypothesis is that the IOF increases the sensitivity of the firms’ stock prices to currency fluctuations, because it increases the costs of operating with FX OTC derivatives
and thus reduces the firms’ ability to use such derivatives to hedge. More precisely, my hypothesis is consistent with ∆FX >0. To test this hypothesis, I perform a simple one-tailed
z-test on ∆FX,i. to test whether ∆FX is significantly larger than zero for the sample firms on
average.
The introduction of the IOF tax is considered a quasi-exogenous event, which allows me to omit other potential factors that might affect stock returns. Underlying this idea is the assumption that the sensitivity of stock returns to other macroeconomic factors remains constant over the studied period (so that the omission of other important macroeconomic factors in the model would not bias the estimates of betas).
Another important assumption is that investors have access to information on firms’ hedging policies, so that stock prices reflect this information. This assumption is quite plausible, particularly for large firms, listed in stock exchanges. These firms are required to disclose their derivatives positions in their financial reports, and are extensively covered by analysts. Therefore, one can expect that analysts are aware of these positions, and more (less) currency hedging will translate into a smaller (larger) sensitivity of the stock price to currency fluctuations.
Finally, another assumption is that the firms in the sample have not changed their business in a significant manner, such that their economic and operational exposure to currency does not change materially before and after the implementation of the tax. In any case, if firms react to the increased cost of hedging by reducing their economic exposure to currency risk, this reaction would attenuate my results (i.e., this would bias ∆FX towards zero). I address this
4- Description of the data, computation of Betas and statistical results
4.1- Description of the data
The sample comprises the stocks that belong to the Ibovespa for the sample period. The Ibovespa includes the most actively traded companies and better representative stocks of the year in the Brazilian Stock Market.15 I exclude firms belonging to the financial sector
(banking and insurance sector), namely Banco do Brasil, BB seguridade (that was also listed in 2013), Bradesco, Bradespar, Cetip, Itau Unibanco, Itausa, and Santander Brazil. After all exclusions, the sample is composed of 56 Brazilian companies, for which stock price information is available from 2010 to 2013 and from which it is possible to compute market returns and their betas regarding the market risk premium and the exchange rate. Data on stock prices, BRL/USD exchange rates (Ptax rate), Ibovespa and the Selic rate are extracted from Bloomberg.
4.2- Results of linear regressions, computation of ∆FX and z-tests
The aim of the linear regression that is done on each of the 56 Brazilian listed non-financial companies is to understand the sensitivity of the stock price to the exchange rate. I run two regressions for each company: one for the pre-measure period and one for the post-measure period, as mentioned above. I compare the change between the FX betas obtained before and after the tax period. The use of the difference between the two betas for each company will help me to measure to what extent firms are further exposed or not to currency shocks. Also, to some extent, the change in βFX is related to the FX hedging decision of the firm.
As it has been highlighted by the theory previously exposed, I expect ∆FX to be positive on
average, i.e., I expect that FX beta computed will be higher than those computed during the pre-IOF implementation. The main rationale is that firms decreased their hedging activity due to a higher cost of hedging in OTC markets - and a higher exposure for companies already exposed to the devaluation of the real, and that at the same time, the exchange rate reacted quite strongly to the implementation of the tax on FX derivatives.
15 The Ibovespa is the main indicator of the average performance of the BM&FBovespa exchange,
covering more than 80 per cent of the trades and 70 per cent of the market capitalization of the exchange.
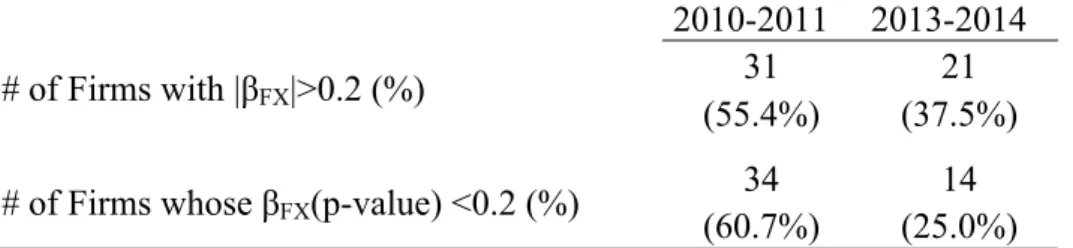
4.3 Currency exposure before and after the IOF implementation
In columns (1) and (2) of Table 2, I present the estimated market and FX betas during the period prior to the IOF implementation (2010-2011), respectively. In column (3) and (4), I present the results obtained for the market and FX betas during the period following the IOF implementation (2013-2014). Correspondent p-values for the FX beta estimates pre- and post-tax are displayed in columns (5) and (6) respectively. Finally, columns (7) and (8) show the changes in the absolute values of market and FX Betas respectively. Firms are ordered in increasing order, according to their pre-tax βFX. I focus my analysis on the estimations of
FX-Betas pre and post-tax, as well as the ∆FX.
Table 2– Estimation of βFX and ∆FX for the firms in the sample
This table shows the estimates of the market and FX Betas for the pre and post-tax periods for the firms in my sample (results shown in columns 1 to 4 as indicated). It also presents the p-values for the estimates of FX Beta for the pre and post-tax periods (in columns 5 and 6), as well as the change in Market and FX Betas from the pre to the post-tax period (in columns 7 and 8). The last two rows show the average sample ∆FX and the P-value of the one-tailed
The results in column 2 of Table 2 show that 49 of the 56 firms in the sample presented negative sensitivity to the exchange rate (i.e., negative βFX) in the pre-tax period, although
only 28 of the estimates are statistically significant at the 10% level. None of the firms in the
Betas 2010-2011 Betas 2013-2014 FX Beta P-value Delta
Market FX Market FX 2010-2011 2013-2014 Market FX
(1) (2) (3) (4) (5) (6) (7) (8) Rossi Residencial 0.435 (0.656) 0.655 (0.475) 0,000 0,181 0.220 (0.181) PDG Realty 0.502 (0.541) 0.537 (0.379) 0,001 0,230 0.035 (0.162) Gafisa 0.419 (0.503) 0.360 (0.443) 0,004 0,111 (0.059) (0.060) MRV 0.542 (0.489) 0.484 (0.442) 0,007 0,092 (0.058) (0.047) Usiminas 0.285 (0.454) 0.334 0.268 0,009 0,455 0.049 (0.186) Gol 0.697 (0.405) 0.189 (0.395) 0,057 0,188 (0.508) (0.010) Hypermarcas 0.371 (0.376) 0.251 (0.036) 0,034 0,818 (0.120) (0.340) Gerdau 0.495 (0.374) 0.295 0.269 0,005 0,161 (0.200) (0.105)
Cyrela Brazil Realty 0.523 (0.362) 0.327 (0.209) 0,013 0,196 (0.196) (0.153)
Even 0.494 (0.361) 0.329 (0.438) 0,021 0,015 (0.165) 0.077 JBS 0.452 (0.348) 0.280 (0.140) 0,060 0,503 (0.172) (0.208) CSN 0.514 (0.347) 0.440 0.429 0,012 0,145 (0.074) 0.082 Duratex 0.443 (0.328) 0.383 0.057 0,024 0,737 (0.060) (0.271) Cia. Hering 0.169 (0.322) 0.253 0.258 0,031 0,209 0.084 (0.064) Vale 0.596 (0.309) 0.209 0.207 0,010 0,268 (0.387) (0.102) Lojas Renner 0.244 (0.304) 0.265 (0.005) 0,024 0,976 0.021 (0.299) Fibria 0.602 (0.300) 0.023 0.152 0,079 0,418 (0.579) (0.148) GPA 0.335 (0.298) 0.209 (0.020) 0,020 0,868 (0.126) (0.278) ALL 0.359 (0.296) 0.242 0.268 0,026 0,242 (0.117) (0.028) Braskem 0.359 (0.296) 0.242 0.268 0,001 0,197 (0.117) (0.028) Bradespar 0.381 (0.292) 0.295 0.188 0,038 0,358 (0.086) (0.104) CESP 0.127 (0.281) 0.286 0.090 0.000 0,618 0.160 (0.191) AES Eletropaulo 0.035 (0.279) 0.395 0.103 0,068 0,677 0.360 (0.176) Klabin 0.274 (0.277) 0.271 0.085 0,051 0,586 (0.003) (0.192) Petrobras 0.505 (0.264) 0.495 (0.104) 0,017 0,693 (0.010) (0.160) Suzano Papel e Celulose 0.506 (0.259) 0.000 0.295 0,157 0,088 (0.506) 0.036 Lojas Americanas 0.302 (0.239) 0.360 (0.164) 0,031 0,272 0.058 (0.075) Localiza 0.194 (0.226) 0.391 (0.054) 0,081 0,705 0.196 (0.172) Cosan 0.203 (0.217) 0.438 (0.322) 0,094 0,048 0.235 0.105 Marfrig 0.338 (0.215) 0.368 (0.167) 0,360 0,531 0.030 (0.048) TIM Participações 0.247 (0.201) 0.117 0.009 0,141 0,966 (0.130) (0.192) Natura 0.128 (0.183) 0.387 0.203 0,128 0,232 0.259 0.020 Cielo 0.118 (0.176) 0.216 (0.122) 0,142 0,405 0.099 (0.054) Oi 0.390 (0.155) 0.147 (0.143) 0,375 0,720 (0.243) (0.012) Marcopolo 0.285 (0.139) 0.274 (0.157) 0,299 0,373 (0.011) 0.018 Light 0.243 (0.126) 0.366 (0.002) 0,273 0,991 0.123 (0.124) Souza Cruz 0.107 (0.106) 0.247 (0.026) 0,339 0,884 0.140 (0.080) EcoRodovias (0.097) (0.100) 0.048 0.094 0,359 0,605 (0.049) (0.006) Estácio 0.223 (0.092) 0.272 (0.183) 0,518 0,303 0.049 0.091 Sabesp 0.150 (0.087) 0.272 (0.104) 0,439 0,592 0.122 0.017 Tractebel Energia 0.063 (0.079) 0.265 0.120 0,394 0,372 0.202 0.041 Copel (0.047) (0.055) 0.125 (0.201) 0,598 0,380 0.078 0.146 Telefônica Vivo 0.095 (0.055) 0.254 (0.111) 0,593 0,467 0.159 0.056 Qualicorp 0.092 (0.044) 0.215 (0.158) 0,827 0,365 0.123 0.114 BR Malls 0.263 (0.041) 0.514 (0.257) 0,759 0,194 0.251 0.216 CEMIG 0.061 (0.038) 0.306 (0.195) 0,713 0,329 0.245 0.157 Eletrobras 0.387 (0.035) 0.634 (0.159) 0,795 0,574 0.247 0.124 BR Properties 0.088 (0.031) 0.083 0.170 0,807 0,340 (0.005) 0.139 CCR 0.083 (0.010) (0.110) 0.311 0.919 0,083 0.027 0.301 Kroton 0.326 0.013 0.359 (0.062) 0,926 0,740 0.033 0.049 CPFL Energia 0.004 0.023 0.310 (0.262) 0,807 0,078 0.306 0.239 Ultrapar 0.194 0.035 0.255 (0.089) 0,707 0,507 0.061 0.054
EDP Energias do Brasil 0.039 0.044 0.118 0.190 0,626 0,333 0.079 0.146
DASA 0.110 0.058 0.003 (0.115) 0,617 0,542 (0.107) 0.057 AmBev 0.073 0.083 0.133 0.128 0,405 0,372 0.060 0.045 Embraer 0.274 0.102 (0.088) (0.089) 0,406 0,553 (0.186) (0.013) BRF Brasil Foods 0.209 0.164 0.233 0.098 0,179 0,505 0.024 (0.066) Average ∆FX (0.035) P-value (z-test) 0.971