Alcohol Consumption
and
Obesity
Sandra Cristina de Loureiro Lourenço
Mestrado em Nutrição Clínica
CONSUMO DE ÁLCOOL E OBESIDADE Alcohol consumption and Obesity
Tese de mestrado apresentada por: Sandra Cristina de Loureiro Lourenço para obtenção do grau de Mestre
Orientadora: Prof. Doutora Carla Maria de Moura Lopes, Faculdade de Medicina da Universidade do Porto
Dissertação de candidatura ao grau de Mestre em Nutrição Clínica
apresentada à Faculdade de Ciências da Nutrição e Alimentação da Universidade do Porto
Agradecimentos
À minha orientadora, Prof. Doutora Carla Lopes, pelos ensinamentos, disponibilidade, estímulo, críticas e…pela AMIZADE.
À Dr.ª Andreia Oliveira pela preciosa ajuda no tratamento estatístico e revisões. Pela disponibilidade e boa vontade com que colaborou neste trabalho.
À direcção do Centro de Saúde de Braga, na pessoa da sua Directora Sr.ª Dr.ª Helena Albuquerque, por me ter apoiado para a realização desta dissertação.
Resumo
Enquadramento: O facto de o álcool ser o segundo componente alimentar com
maior densidade energética sustenta a ideia de que consumos elevados ou mesmo moderados, a longo prazo, possam contribuir para o aumento da ingestão energética, e consequentemente conduzir a um aumento do índice de massa corporal dos indivíduos. A variabilidade da ingestão de álcool existente na população Portuguesa permite observar amplitudes de exposição suficientes para melhor estudar esta relação.
Objectivo: Quantificação da associação entre a prevalência de obesidade e a
ingestão de etanol, numa amostra urbana de adultos portugueses.
Métodos: A amostra seleccionada aleatoriamente, era constituída por 2372
indivíduos adultos (mulheres e homens), na avaliação de obesidade total e por 2383 (mulheres e homens), na avaliação de obesidade central. Estes indivíduos faziam parte da coorte do estudo EPIPorto.
Inquiridores treinados procederam à aplicação de um questionário estruturado e avaliação de parâmetros sócio-demográficos e antropométricos.
Foi definida obesidade total como o índice de massa corporal (IMC) (peso (kg) /altura (m)²) igual ou superior a 30 kg.m² e central valores de perímetro da cintura (PC) superior a 88 cm ou 102 cm, para mulheres e homens, respectivamente. A ingestão de etanol foi estimada através de um questionário semi-quantitativo de frequência de alimentos, previamente validado, referente ao ano anterior à entrevista, e ao longo da vida. Os indivíduos foram classificados em 4 classes de ingestão de etanol (g/dia): 0; 15,0; 15,1-30,0;> 30,0 nas mulheres e 0; 0,1-30,0; 30,1-60,0;> 60,0 nos homens.
Para avaliar a associação entre obesidade e a ingestão de etanol foram calculados odds ratio (OR) com os respectivos intervalos de confiança a 95% (IC 95%), através de regressão logística não condicional. Foram construídos dois modelos diferentes, para homens e mulheres.
Resultados: A prevalência de ingestão de álcool >30g/dia, nas mulheres e
>60g/dia nos homens foi de 5,3% nas mulheres obesas comparativamente a 3.3% nas não obesas e de 28,4% nos homens obesos em comparação com 15,8% não obesos. Após ajuste para a idade, escolaridade, hábitos tabágicos, ingestão energética e prática de exercício físico, os indivíduos do sexo masculino com ingestões de álcool >60g/dia apresentaram estimativas de risco significativamente superiores às dos não bebedores (OR=1,64, IC 95%: 1,33-5,22). Quando se considerou o consumo ao longo da vida, em ambos os sexos, as estimativas de risco foram ainda maiores: nas mulheres (OR=2.51, 95% IC: 1,32-4,76) e nos homens (OR=4.77, 95% IC: 2.,14 -10,2).
As mulheres e os homens com ingestões de álcool >30 g/dia e >60g/dia, respectivamente, ao longo da vida, apresentam estimativas de risco de obesidade central bastante mais acentuadas do que os não bebedores, tanto nos homens (OR=4,32, 95% IC:1,90-9,77) como nas mulheres (OR=3,30,95% IC:1,65-6,58).
Conclusões: O consumo elevado de álcool no último ano e ao longo da vida está
positivamente associado à obesidade total e central, em ambos os sexos. Esta associação é independente de características sociais ou comportamentais.
Palavras-Chave: Álcool, consumo de álcool, aumento de peso, obesidade,
Abstract
Background: The high alcohol consumption in Portugal, and the high energy
content of alcoholic beverages, makes alcohol a potential contributor to the obesity.
Objective: To evaluate the association between ethanol consumption and overall
and central obesity in adults of an urban Portuguese population.
Methods: This cross-sectional analysis included 2372 for evaluate overall obesity
and 2383 for central obesity. The participants were randomly selected from Porto in-habitants (age ≥18 years) enrolled in EPIPorto Study (1999-2003). Trained interviewers applied a questionnaire comprising information on social, demographic, behavioural characteristics, and anthropometrical measures were recorded. Data on ethanol intake were obtained by using a validated semi-quantitative food frequency questionnaire. Subjects were classified in to 4 classes of ethanol intake (g/day):0; 0.1-15.0; 15.1-30.0 ; >30.0 in women and 0; 0.1-30.0; 30.1-60.0 ; >60.0 in men. Overall obesity was considered when the body mass index (BMI) was ≥30.0 kg/m2, central obesity, if Waist Circumference (WC) was higher than 88 cm or 102 cm, for women and men respectively.
Odds ratios (OR) and 95% confidence intervals (CI) were calculated using unconditional logistic regression with separate models fitted for sex.
Results: Prevalence of ethanol intake higher than 30g/day for women and
60g/day for men, was 5.3% in obese women vs. 3.3% in non obese, and 28.4% in obese men vs. 15.8% in non obese. After adjustment for age, education, BMI, smoking, energy intake and sports practice, men who consumed more than 60g/day were more frequently obese (overall) comparing with non drinkers (OR=1.64, 95% CI: 1.33-5.22). When considering lifetime alcohol consumption,
the magnitude of associations were even stronger for women (OR=2.51, 95% CI: 1.32-4.76) and for men (OR=4.77, 95% CI: 2.14-10.62). In women, “heavy” life-time alcohol consumption was significantly positively associated with central obesity (OR: 3.30, 95% CI: 1.65-6.58). In men, the same positive association was observed, but even with stronger magnitude, (OR=4.32, 95% CI: 1.90-9.77).
Conclusions: Independently of social and behavioural features, alcohol
consumption, past-year or lifetime, was associated with obesity, overall and central, in women and men.
Keywords: Alcohol, alcohol consumption, weight gain, obesity, central obesity,
ÍNDICE 1. Introdução 1 2. Objectivos 15 3. Participantes e Métodos 16 4. Resultados 23 5. Discussão 29 6. Conclusões 35 7. Referências Bibliográficas 36
LISTA DE ABREVIATURAS
EU European Union
USA United States of America
OECD Organisation for Economic Co-operation and Development NESARC National Epidemiological Survey on Alcohol Related Conditions BMI Body Mass Index
WC Waist Circumference ADH Alcohol Dehydrogenase
MEOS Microssomal Ethanol Oxidizing System ATP Adenosine Triphosfate
CHD Coronary Heart Disease HDL High Density Lipoprotein CRP C - Reactive Protein
MCP-1 Monocyte Chemoattractant Protein -1 VCAM-1 Vascular Cell Adhesion Molecule - 1 ICAM-1 Intercellular Adhesion molecule - 1
LISTA DE FIGURAS
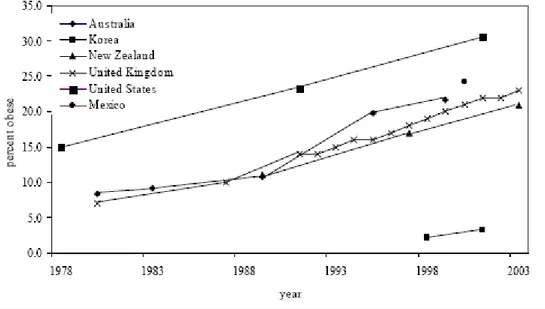
Figure 1. Level and trend of obesity in selected countries 1
Figure 2. Average annual change in the percent obese 2
Figure 3. Alcohol consumption in World 6
LISTA DE TABELAS
Table1: Baseline characteristics of study participants (EPIPorto Study) according
to sex 17
Table 2: Characteristics of participants according to obesity status (overall and
central), by sex 24
Table 3: Alcohol consumption (last year) distribution and association with overall
obesity, by sex 25
Table 4: Alcohol consumption (life-time) distribution and association with overall
obesity, by sex 26
Table 5: Alcohol consumption (last year) distribution and association with central
obesity, by sex 27
Table 6: Alcohol consumption (life-time) distribution and association with central
1. INTRODUCTION
OBESITY
Obesity affects more than 300 million adults all over the world; the majority of whom live in developed countries (1). United States of America (USA) and several Latin American countries, present the higher prevalence of obesity among developed countries (2).
Although the United States has the highest level of obesity, the trend of increased prevalence is quite similar across countries. Similarities in the speed with which obesity prevalence has increased, suggests a worldwide time-related phenomenon, rather than a country-specific trend (Figure 1) (3).
In Europe, the prevalence of obesity is higher in the Mediterranean and East European countries, particularly in Portugal and Spain. Over the last 15 years, there has been an increase of 2.2% in obesity the prevalence (4). Historically, those countries had the lower rates of overweight/obesity. Personal characteristics such as psychological and psychological factors, level of education, particular lifestyles and, recent raised socioeconomic status, probably had determined a higher risk observed in this region (5). Also, data from OECD (Organisation for Economic Co-operation and Development), reported Portugal as one of the countries with highest change in the obesity prevalence, in the last decades. Portugal presents similar prevalence to countries traditionally described as having the higher levels of the disease (3).
In Portugal, according to national data published in 2008, the prevalence of overweight was 53.6%, higher in men (60.2%) than in women (47.8%). The prevalence of obesity, in the same study, was 15.0%, higher in women (15%) than men (13.4%) (6).
The distribution of overweight and obesity, within OECD countries, consistently shows pronounced disparities, by education and socio-economic condition, in women. In fact, Women more educated and with higher socio-economic status, display substantially lower rates of overweight or obesity, while mixed patterns are observed in men (7).
Health risks associated with overweight and obesity are well-documented: Diabetes, cardiovascular diseases, respiratory diseases and certain cancers, are more prevalent among overweight and obese individuals, than among those with normal weight. The risks associated with these disorders, increases with body mass (8, 9, 10, 11, 12). The lifetime medical costs related to diabetes, heart disease, high cholesterol, hypertension and stroke, among the obese, are $10,000 higher, than among the non-obese individuals. (13). Obesity is responsible for approximately six to ten percent of national health expenditures in the U.S. and two to four percent in other developed countries (14, 15). Recent evidence suggests increased prevalence of mood and anxiety disorders among individuals who are overweight or obese, compared to those with weight in the normal range (16). Addicting the costs associated with psychiatric/psychological illness, to total burden of obesity, certainly the costs will growth.
Excess body weight is the fifth most important risk factor that contributes to the burden of disease in developed countries.
The additional presence of abdominal obesity (central location of body fat) confers an even greater risk for coronary heart disease and type 2 diabetes (17). Abdominal obesity, per se, is associated with higher cardiovascular risk, higher blood pressure, hiperlipidemia, insulino-resistence, and higher overall mobility and mortality (18). Obesity with abdominal obesity has been identified as the most important modifiers of morbidity and mortality risk for chronic diseases (19, 20, 21).
ALCOHOL CONSUMPTION
Alcohol metabolism
Alcohol, ethyl alcohol, also known as ethanol, is the type of alcohol found in drinks, intended for human consumption.
Alcohol has three major characteristics: 1) it is a source of energy; 2) It is a psychoactive drug; 3) depending of dose, behave as a toxin.
According to the amount and frequency of consumption, one or other of these characteristic prevails (22).
The caloric value of alcohol (7.11 Kcal /29 kJ/ g), lies between that of carbohydrates (4 kcal/ g), and fat (9 Kcal/g). Alcohol calories may thus represent an important energy resource, which has to be taken into consideration in the energy balance. In the context of the overweight and obesity pandemic, the evaluation the weight of alcohol in obesity, is quite pertinent.
On a purely dietary level, alcohol use would seem to be a contributing factor to individual weight gain, regarding to high caloric content of the alcoholic beverages:
340 grams can of regular beer contains approximately 145 calories, 142 grams glass of wine approximately 135, and a 42.5 grams serving of spirits, approximately 130 ( 23).
Alcohol can be metabolized (oxidized) by tree different pathways: 1) by alcohol dehydrogenase (ADH); 2) by the hepatic microssomal ethanol oxidizing system (MEOS); 3) by catalase (24).
Two-to-ten of alcohol intakes are excreted thought the lungs, urine, and sweat, the remainder is metabolised to acetaldehyde, by alcohol dehydrogenase (ADH). Chronic alcohol consumption, regarding frequency and quantity, does not affect the activity of ADH (the metabolism of alcohol by this pathway leads to the production of 16 mole of ATP per mole of alcohol; it is mainly oxidized by the MEOS (the metabolism of alcohol by this pathway leads to production of less than 10 moles of ATP per mole) 25. The threshold level of alcohol intake for MEOS is not known, however 30-40g/day may suffice for MEOS induction (26). Probably varies widely from one individual to another (genetic factors). In addition, alcohol inhibits the body’s ability to “burn” fat. The liver converts alcohol into acetate, which is released into the bloodstream and then is used as an energy source. As acetate levels rise, the body begins to “burn” more acetate and less fat (8). The underline metabolic of this mechanism is due to the alcohol effect in suppression lipid oxidation. This nonoxidized fat is preferentially deposited in the abdominal area (27).
Several aspects of alcohol metabolism vary from one individual to another and also from a population to another, as a function of the amount and pattern of consumption (28).
Alcohol consumption distribution and trends
The EU (European Union) is the highest-drinking region in the world (figure 4); it was estimated that each year an adult drinks 11 liters of alcohol. However, is a substantial fall from a recent peak of 15 liters in the mid- 1970s.
In the last 40 years there was a harmonization in consumption levels in the EU15, with risen in central and northern Europe between 1960 and 1980, met by a consistent fall in southern Europe. Average consumption in the EU10 is also closer to the EU15 than ever before, although substantial variation remains within the EU10 (Figure 3). Despite this drinking behaviour, 55 million adults (15%) are abstainers; considering that, and also unrecorded consumption, the consumption per drinker reaches 15 liters per year (29).
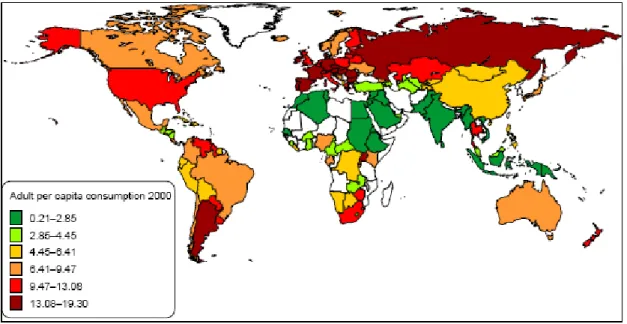
Adult per capita alcohol consumption in the world measured in pure alcohol per person per year (estimates include unrecorded consumption). Source: World Health Organization (2005).
Figure 3. Alcohol consumption in World
Europe plays a central role in the global alcohol market, acting as the source of a quarter of the world’s alcohol, and over half of the world’s wine production. Trade
is even more centered on Europe, with 70% of alcohol exports and half of the world’s imports. This trade is frequently between EU countries and contributes to around 9 billion Euros to the goods account balance, considering EU as a whole (30).
Although parts of Europe are described as having drinking patterns that are less risky to health, alcohol remains one of the most important risk factors for ill-health and premature death (31).
The heaviest drinkers account for a substantial amount of the alcohol drunk in a country, with 10% of the population consuming one-third to one-half of all the alcohol drunk. While 266 million adults drink alcohol up to 20g (women) or 40g (men) per day, over 58 million adults (15%), consume above this level. Twenty million of drinkers (6%) drink at over 40g per day (women), and 60g per day (men). Assuming alcohol addiction rather than drinking levels, we can also estimate that 23 million Europeans (5% of men, 1% of women) are dependent on alcohol in any one year. In every culture ever studied, men are more likely than women to drink more. It is still controversial to find evidence for this gender gap (32)
In Portugal the mean of alcohol consumption in 1998/99 was, 47.3 g/day for men and 17 g/day for women (33).
Alcohol consumption and chronic diseases
A relationship between overall per capita alcohol consumption, and the number of individuals in a population with harmful alcohol use, and alcohol use disorders, has been described for several years (34, 35).
Apart from being a drug of dependence, alcohol is a cause of around 60 different types of diseases and conditions, including social disabilities, mental and behavioural disorders, cardiovascular diseases, neuropsychiatric conditions, gastrointestinal, metabolic and endocrine conditions, cancers (particularly female breast cancer in a dose dependent manner at all ages), immunological disorders, lung diseases, skeletal and muscular diseases, reproductive disorders and pre-natal harm, including an increased risk of prematurity and low birth weight . For most conditions, alcohol increases the risk in a dose dependent manner, the higher the alcohol consumption, the greater the risk (29).
An inverse association between moderate alcohol consumption and coronary heart disease (CHD) has been consistently shown in epidemiologic studies for more than 30 years. For example, in a large cohort from France (where wine is the most frequent alcohol beverage of consumption), Renaud et al. (36) evaluated the health risk of both, wine and beer, and found that both beverage choices reduced the risk of cardiovascular death, albeit wine was more beneficial (37). In Germany, where much of the alcohol consumed is beer, the risk of CHD events, in drinkers was one half that of non-drinkers (38). In Japan, where spirits are the common beverage of choice, Kitamura et al. (39) found that alcohol intake reduced premature incidence of CHD among urban Japanese middle-aged men; within that study, less than 1% of alcohol consumed was from grape wine. When summarized the available evidence, the inverse association between moderate alcohol intake and CHD was consistent, regardless of beverage choice (40). This suggests that the direct metabolic effects of ethanol are largely responsible for the cardiovascular benefits, and those other constituents of the beverages might contribute little, if anything, to the benefit.
It has been suggested that the possible link between moderate alcohol consumption and the reduced risk of developing metabolic diseases could be mediated through, beneficial changes in high-density lipoprotein Cholesterol (HDL, clotting factors, increase insulin sensitivity and, alcohol-induced anti-inflammatory effects via changes in classical (i.e. hs-CRP and fibrinogen) (41, 42) as well as newer risk markers (i.e. adiponectin, MCP-1, VCAM-1, and ICAM-1) (41, 43, 44). Supporting this hypothesis, several in vitro studies are demonstrating anti-inflammatory effects of ethanol in various cell-types such as spleen cell-cultures and macrophages (45, 46, and 47), blood monocytes (46), and endothelial cells (47). The metabolic protection of moderate alcohol consumption may be beneficial in attenuating whole-body low grade inflammation, characteristic of obesity process and promoting increase of circulating of anti inflammatory cell-types, such adiponectin (48).
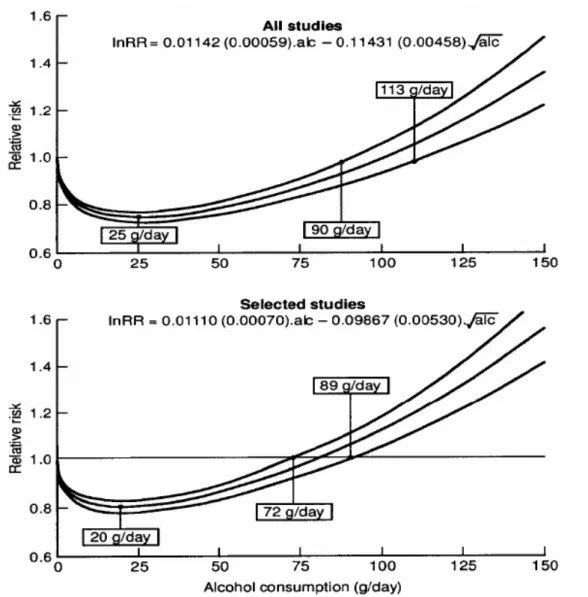
In a review paper, Corrao et al. showed that the risk of CHD decrease 80% at 20g (two drinks) of alcohol per day, comparing with non-drinkers. Beyond two drinks a day (considered as the level of alcohol consumption with the lowest risk, the risk of heart disease increase (49) (Figure 4).
Regular heavy drinkers had a 74% higher risk of a major coronary event, a 133% higher risk of stroke, and a 127% higher risk of all-cause mortality than did occasional drinkers (these estimates were 8%, 54%, and 44% before adjustment for intake variation). It is also important to note that the reduction in risk with alcohol consumption may become less and disappear, the longer the time the subjects are followed-up (50).
Although the apparent J-shaped effect has been described in several studies, this issue is under discussion. A meta-analysis of 54 published studies tested the
extent to which a systematic misclassification error was committed, by including as ‘abstainers’, many people who had reduced or stopped drinking, a phenomenon associated with ageing and ill health. The studies judged to be error free, found no significant all-cause or cardiac protection, suggesting that the cardiac protection afforded by alcohol may have been over-estimated (51).
Functions (and corresponding 95% confidence intervals) describing the dose response relationship between reported alcohol consumption and the relative risk of coronary heart disease obtained by pooling all the 51 included studies and the 28 selected cohort studies for which a high quality score was assigned. The fitted models (with standard errors in parentheses) and three critical exposure levels (nadir point, maximum dose showing statistical evidence of protective effect, and minimum dose showing statistical evidence of harmful effect) are reported. Reproduced
from: Corrao et al. (2000).
ALCOHOL AND OBESITY
Alcohol influences the basic requirements for body weight stability (energy balance) and substrate balance. For weight stability, two requirements have to be met: the energy balance and the assurance of energy substrate (52, 53, 54). The constant flue of substrate balance implies that the oxidation rate of different energy substrates (fat, carbohydrates and protein) has to be equal the amount of ingested food. The energy balance becomes positive when the oxidation rate of one, or several, energy substrate is lower than the amount ingested. Carbohydrates reduce the oxidation of fat, and alcohol shows similar effects (55). In the view of evidence, moderate alcohol consumption has to be regarded as a risk factor for weight gain (28)
The consumption of alcohol, some illicit drugs, and nicotine are known to affect appetite. Alcohol enhances appetite (56, 57, 58). This effect may involve different mechanisms, such as decrease glucose levels, as a result of decrease gluconeogenisis (59), enhancement of socialization, psycho-emotional desinhibition, or even the increased duration of meal (60, 61).
Overweight and obesity seem primarily caused by disorders on appetite regulation. Any factor interfering with the regulation of the perception of hunger, appetite and, intra- meal and inter-meal satiety may affect food intake and thus the body weight, both in short, and long term (28). However, relationships between substance use and body weight appear to vary based on the specific substance used and “users” demographic characteristics (62).
Associations of alcohol consumption and body weight may also differ from moderate users versus those considered “heavy” consumers. In addition to its high
caloric content, alcohol is a complement for sedentary activities, which further may promote weight gain. Moreover, the calories provided by alcohol count more in a overweight person, with a high-fat diet, low levels of physical activity, and a positive family of obesity, as well as a low rate of ethanol degradation (28)
Epidemiologic research, examining the effect of alcohol on the risk of obesity, remains with ambiguous results.
The association between body weight and drinking patterns revealed that individuals, who frequently drink, but consume small quantities of alcohol each occasion (i.e., one drink per day), had the lowest body mass indexes (BMI) (63). Alternatively, “heavier drinkers” that consume high levels of alcohol, but too few calories from other sources, or even reduce their total caloric intake, could present malnutrition. The weight-enhancing effects of high-intensity drinking are likely to dominate the weight-dampening effects of alcohol disorders for most individuals. These differences suggest that the effect of alcohol use on body weight could be non-linear (64). Otherwise, high-intensity drinkers (regardless of frequency) may be less likely, than other drinkers, to reduce their intake of other foods, potentially leading to weight gain (63).
Another factor confounding the epidemiologic relationship between alcohol and body weight is the rather high prevalence of meal-skipping with increasing alcohol intake (65, 66). In a recent prospective study, French et al. found that drinking frequency and intensity are positively and significantly related to weight gain over time. However it does not appear to be a risk factor for weight gain, among women. The authors referred not having a convincing explanation for the lack of significance found for women (64).
The presence of an alcohol use disorder at age of 24 years increased the risk of developing obesity for women at age of 27 years (67). Further research is needed to understand whether this association is directly related to the ingestion of excessive alcohol or if it is the result of others processes.
Since rates of alcohol consumption have remained fairly stable over the last few decades, alcohol use alone cannot explain the general rise in obesity (64). However, for certain individuals, alcohol use may be an important cause of weight gain – and that has been overlooked until now.
Men and women differ in the type and amount of alcohol they consume, in the biological effects they experience as a result of alcohol consumption, specifically women had a lower the amount of body's water per weight, and in the consequences they face as a result of obesity (68, 69).
Alcohol consumption and body weight in non-clinical populations are inconsistent for men, with most studies indicating a positive association (70, 71, 72, 73), but some studies showing no relationship (74)
Although prior research indicates that women who drink alcohol consume fewer calories from other sources and, report inverse association between quantity of alcohol and BMI, it is not clear why alcohol calories replace food calories only among women but not among men (62,70).
Because alcohol use is prevalent in our country, particularly in men but also in women, we could expect to have a sufficient variation in the alcohol consumption, which allows finding this relationship between quantity of alcohol consumption and body weight, in men and women.
Additionally, few studies have examined associations between life-time alcohol consumption and the risk for obesity, in both men and women, particularly central obesity.
2. OBJECTIVE
Evaluate the association of life-time and past-year alcohol consumption with overall and central obesity, in a Portuguese urban population of adults.
3. PARTICIPANTS AND METHODS
PARTICIPANTS
This cross-sectional study included participants of the EPIPorto study witch baseline evaluation was performed during the period of 1999-2003.
Participants were selected within the non-institutionalized adult population of Porto (large urban centre in the north of the country with almost 300,000 inhabitants), by random digit dialling, using households as a sampling unit. At the time of recruitment, 97% of all households had a telephone number. Simple random sampling was therefore used to select only one subject among all, aged ≥ 18 years, in each household. Refusals were not substituted within the same household, and participation proportion was 70% (75).
A rapid evaluation of the of the participants cognitive function was performed using the Mini-Mental Examination test (76) to the subjects older than 64 years. Subjects were excluded when scoring was <24 points. Also individuals with missing information for key variables such as, weight, height, waist circumference and previous year or life-time alcohol consumption, were not included. So, from a total sample of 2485 subjects (1539 women; 946 men), 2372 (1461 women; 911 men) were included to analyse the association between alcohol and total obesity, and 2383 (1469 women; 914 men) were included for the analysis of the relation between of alcohol and central obesity.
The socio-demographic, anthropometric and lifestyle characteristics of the total baseline sample, sorted by sex, are presented in Table 1.
Table1: Baseline characteristics of study participants (EPIPorto Study) according to sex Women n=1539 Men n=946 mean (sd) p Age (years) 52.6 (15.2) 53.4 (15.8) 0.223 Education (years) 8.2 (5.3) 9.4 (7.0) <0.001
Total energy intake (Kcal/day) 2054 (555.5) 2540 (657.6) <0.001 Body Mass Index (Kg/m²) 27.19 (5.2) 26.31 (3.9) 0.002
n (%) Alcohol consumption Current drinkers Non drinkers Former drinkers 977(65.4) 389 (26.0) 127 (8.6) 822 (88.5) 51 (5.4) 56 (6.0) <0.001 Smoking Current smokers Non smokers Former smokers 265 (17.7) 1073 (71.9) 155 (10.4) 325 (35.0) 264 (28.4) 340 (36.6) <0.001
Regular physical exercise No Yes 1028 (68.7) 468 (31.3) 548 (59.0) 381(41.0) <0.001
For some variables, results do not sum to total, due to missing information.
Women and men had similar ages (52.6 vs. 53.4 years, p=0.223), however women had significantly lower level of education, lower total energy intake and higher mean BMI, than men. Men were more frequently current cigarette smokers (35%
vs.17.8 %.), current alcohol drinkers (88.5% vs. 65.4%) and physically actives (40.8% vs. 31. 2%).
DATA COLLECTION
Face-to-face interviews and physical examination took place at the Department of Hygiene and Epidemiology of the Porto University Medical School.
Data on potential confounders, such as social and behavioural characteristics, were collected by trained interviewers, using a standard structured questionnaire.
Anthropometric data
Anthropometric data was obtained with subjects in light clothing and barefoot, after fasted overnight. Body weight was measured to the nearest 0.1 kg using a digital scale (SECA®) and height was measured to the nearest centimetre, using a wall stadiometer (SECA®).
Body mass index was computed as the value of weight (kilograms) divided by the height squared (meters). Subjects were classified into two categories, based on established guidelines from the USA National Institutes of Health (77) as non obese, if BMI was under 30 kg/m², and obese, if BMI were equal or higher than 30.0 kg/m².
Waist circumference (WC) was measured to the nearest centimetre with a flexible and non-distensible tape, avoiding exertion of pressure on the tissues and with the subject standing; the measure was preformed midway between the lower limit of the rib cage and the iliac crest. Participants were classified with central obesity, if
to Expert Panel on the Identification, Evaluation, and Treatment of Overweight in Adults (77).
Dietary data
Dietary assessment was performed using a semi-quantitative food-frequency questionnaire (FFQ), on 82-food items and beverages. The questionnaire was designed to ascertain in detail how much and what kind of foods were consumed in the previous year. Participants were asked to recall their food habits in the year before interview. Frequency (9 closed categories), and quantity of food intake were then analyzed in a modified database (Food Processor Plus software (ESHA Research, Salem-Oregon, 1997), This software has been adapted to incorporate traditional Portuguese food and dishes, presented in the Portuguese tables of food composition (23), typical recipes, and data from other studies, that analysed the composition of Portuguese foods (78,79). Data on alcohol consumption was estimated using the same instrument.
After estimating the mean frequency of consumption, subjects were asked if the average portion consumed was lower, equal or higher than a glass of 125 ml for wine, a bottle or can of 330 ml for beer, and a cup of 40 ml for spirits or liquors. A photographic album was used to help the decision for choice the average portion size consumed.
During the interview, each subject was also asked also about the mean frequency of consumption of the different types of alcoholic beverages, considering life-time consumption. For subjects who have changed their drinking habits during the previous year, the higher period of exposure (life-time), was considered.
The quantity of alcohol intake (grams (g) /day) was obtained multiplying the frequency of consumption by the mean portion size and, whenever applicable, by a factor of seasonal variation of consumption (0.25 as assumed for a 3 months intake, over one year). This conversion was carried out using the previously
described software Food Processor Plus®, adapted to Portuguese drinks. The software considers an algorithm that assumed the following alcohol concentrations in volume: 12% for wine, 4.7% for beer, 25% for liquors, and similar beverages, and 50% for vodka and the like.
The food frequency questionnaire has been validated by comparison with four 7-days food records (each one in a different season of the year), among 146 subjects of Porto (80). High correlation coefficients were found for alcohol intake (unadjusted Spearman-correlation r=0.88; sex, age, education and energy intake adjusted Spearman-correlation r=0.69).
Different classes of alcohol consumption were defined by the cut points 15.0 and 30.0 grams per day (g/day) for women, and 30.0 and 60.0 g/day for men, according to the American Heart Association recommendation (81). Participants with an alcohol intake at or below 15.0 for women, and 30.0 g/day for men were considered moderate alcoholic drinkers, and those with intake above 30.0 and 60.0 g/day, respectively for women and men, were considered as “heavy” alcoholic drinkers.
Social and behavioural data
Age was recorded as completed years of aging and education was recorded as completed years of schooling.
Smoking habits were self-reported. With respect to this lifestyle characteristic, participants were classified into three categories: current smokers (daily and occasional smokers), non-smokers (never smokers) and former smokers (at least six-month abstinence).
Physical exercise evaluated is referred to the regular practice (at least 30 minutes per week) during the previous year of any leisure-time physical activity. It was considerate energy expenditure higher than 2.5 metabolic equivalents; this includes, walking, running and any sports activities.
STATISTICAL ANALYSIS
Proportions were compared using the chi-square test. The t-student test or non-parametric equivalent test, when appropriate, was computed to compare continuous variables, between two independent samples. All p values were two sided, and the significance level was set at <0.05.
The associations between alcohol consumption and obesity were summarized with odds ratio and respective 95% confidence intervals (OR, 95% CI), obtained from unconditional logistic regression models. The associations were evaluated crudely and in multivariate analysis. Age, education, total energy intake, smoking habits, and practice of regular physical exercise were considered as potential confounders.
All descriptive analyses were performed separately for the two genders, models were stratified by sex. All analyses were conducted using the statistical software Stata®, version 9.
ETHICS
The local institutional ethics committee approved the study, and all participants gave written informed consent.
4. RESULTS
Table 2 shows the selected characteristics of participants, stratified by sex, according to obese (BMI≥ 30 kg/m2), and non-obese (BMI< 30 kg/m2) categories, and according to the presence of central obesity (WC> 88 cm for women, and WC> 102 for men).
Age, education, smoking status, and exercise practice differed significantly across obesity categories, in women. Obese women (overall and central obesity) were significantly older, less educated, less frequently smokers and less physically actives, when compared with non-obese women.
As described for women, obese men were older, less educated, frequently non smokers (former smokers included), and more frequently sedentary, than non-obese men. In men, these differences only achieved statistical significance for education level and physical activity, when considering overall obesity, and for age, education level, and smoking habit (men with abdominal obesity were less frequently smokers), when considering the central obesity.
No significant statistically differences were found in women and men, for total energy intake, taking into account both overall and central obesity.
Tables 3 and 4 describe last-year and life-time prevalence of alcohol consumption, respectively, and its association with overall obesity.
In both women and men, alcohol consumption was associated with greater likelihood of any last-year and lifetime obesity, a significantly higher percentage of obese subjects were founded within those who drank more alcohol per day.
Table 2: Characteristics of participants, according to obesity status (overall and central), by sex
Overall Obesity Women Men Non obese (BMI<30.0 kg/m2) n=1117 Obese (BMI≥30.0 kg/m2) n=390 Non obese (BMI<30.0 kg/m2) n=789 Obese (BMI≥30.0 kg/m2) n=143 Mean (sd) p Mean (sd) p Age (years) 50.66 (15.5) 58.10 (12.4) <0.001 53.06 (15.9) 55.11 (14.9) 0.166 Education (years) 9.21 (5.3) 5.51(4.3) <0.001 9.62 (7.3) 8.16(4.6) 0.008 Total energy intake
(kcal/day) 2067 (548.6) 2028 (578.6) 0.094 2542 (650.8) 2530 (704.7) 0.928 n (%) n (%) Smoking Current smokers Non smokers Former smokers 232 (21.3) 723 (66.5) 133 (12.22) 27 (7.2) 332 (88.1) 18 (4.77) <0.001 215 (27.7) 239 (36) 281 (36.3) 40 (28.4) 43 (30.5) 58 (41.1) 0.214 Regular physical exercise No Yes 716 (65.7) 373 (34.22) 288 (75.8) 90 (23.68) <0.001 444 (56.9) 331 (42.4) 97 (68.8) 44 (31.2) 0.024 Central Obesity Women Men Non obese (WC≤ 88 cm) n=901 Obese (WC> 88 cm) n=614 Non obese (WC ≤ 102 cm) n=777 Obese (WC >102) n=156 Mean (sd) p Mean (sd) p Age (years) 48.21 (15. 3) 58.95 (12.5) <0.001 52.15 (16.0) 58.80 (13.2) <0.00 1 Education (years) 9.90 (5.3) 584 (4.4) <0.001 9.6 (6.6) 7.83 (4.6) <0.00 1 Total energy intake
(kcal/day) 2070 (555.99) 2031 (558.6) 0.128 2550 (651) 2490 (88.7) 0.207 n (%) n (%) Smoking Current smokers Non smokers Former smokers 212 (24.0) 561 (63.6) 109 (12.4) 51( 8.6) 497 (84.1) 43 (7.3) <0.001 283 (37) 215 (28.1) 268 (35.0) 38 (24.8) 46 (30.1) 69 (45.10) 0.011 Regular physical exercise No Yes 571 (64.6) 312 (35.3) 444 (74.8) 148 ( 24.9) <0.01 441 (57.4) 325 (42.2) 102 (66.2) 51 (33.1) 0.102
Mean (sd): mean (standard deviation)
Considering the consumption of alcohol in the past year, in both genders, a non-significant inverse association was founded between moderate alcohol consumption and obesity (table 3). However, levels of alcohol intake upper than 15 g/day in women, and 30 g/day in men, were associated with higher probability of
obesity, but only achieving statistical significance in men, and for “heavy” alcohol drinking consumes (> 60 g/day). After adjustment for age, education, total energy intake, smoking habits and regular practice of physical activity, men who consumed more than 60 g/day of alcohol presented 64% higher probability (95% CI: 1.33-5.22) of having obesity, when compared with non-drinker individuals (table 3).
Table 3: Alcohol consumption (last year) distribution and association with overall obesity, by sex
Non Obese (BMI<30 kg/m2) n (%) Obese (BMI≥30 kg/m2) n (%) p Unadjusted OR (95% CI) Adjusted OR** (95% CI) Women
Alcohol comsumption (g/day) 0 0.1-15.0 15.1-30.0 >30.0 511 (47.1) 444 (40.9) 94 (8.7) 36 (3.3) 169 (45) 137 (36.4) 50 (13.3) 20 (5.3) 0.014 1* 0.93 (0.72-1.20) 1.60 (1.09-2.36) 1.67 (0.94-2.98) 1* 0.98 (0.75-1.30) 1.32 (0.87-1.99) 1.48 (0.79-2.75) Men
Alcohol comsumption (g/day) 0 0.1-30.0 30.1-60.0 >60.0 113 (14.7) 348 (45.2) 187 (24.3) 122 (15.8) 16 (11.4) 43 (30.5) 42 (29.8) 40 (28.4) <0.001 1* 0.87 (0.47-1.60) 1.58 (0.85-2.95) 2.31 (1.22-4.36) 1* 0,90 (0.48-1.67) 1.67 (0.88-3.17) 1.64 (1.33-5.22)
* Reference class of alcohol consumption
** Odds Ratio adjusted for age, years of education, smoking habits, total energy intake, body mass index and physical exercise
OR (95% CI): odds ratio (95% confidence intervals)
Considering the association of life-time alcohol consumption with overall obesity, similar results to last-year were founded. However, the magnitude of the positive associations was even stronger than was observed for last year evaluation. Individuals with higher alcohol consumption (>60 g/day in men, and >30g/day in
women), presented significantly higher probability of obesity (OR=2.51, 95% CI: 1.32 - 4.76 in women; OR=4.77, 95% CI: 2.14-10.62 in men).
Table 4: Alcohol consumption (life-time) distribution and association with overall obesity, by sex
Non obese (BMI<30 kg/m2) n (%) Obese (BMI≥30 kg/m2) n (%) p Unadjusted OR (95% CI) Adjusted OR** (95%CI) Women
Alcohol consumption (g/day) 0 0.1-15.0 15.1-30.0 >30.0 460 (45,0) 393 (38.5) 144 (14.1) 25 (2.5) 127 (35.4) 1.25 (34.8) 81 (22.6) 26 (7.2) <0.001 1* 1.15 (0.86-1.52) 2.23 (1.45-2.85) 3.76 (2.10-6.74) 1* 0.93 (0.68-1.25) 1.26 (0.88-1.82) 2.51 (1.32-4.76) Men
Alcohol consumption (g/day) 0 0.1-30.0 30.1-60.0 >60.0 113 (16.0) 323 (45.8) 198 (28.1) 71 (10.2) 12 (9.1) 46 (34.9) 40 (30.3) 34 (25.8) <0.001 1* 1.34 (0.95-3.77) 1.90 (0.95-3.77) 4.50 (2.19-9.28) 1* 1.36 (0.68-2.72) 2.00 (0.95-4.17) 4.77 (2.14-10.62)
* Reference class of alcohol consumption
** Odds Ratio adjusted for age, years of education, smoking habits, total energy intake, body mass index and physical exercise
OR (95% CI): odds ratio (95% confidence intervals)
Table 5 and 6, display last-year and lifetime prevalence of alcohol consumption in women and men, and its association with central obesity.
Waist circumference was significantly associated with last-year alcohol consumption, for both genders.
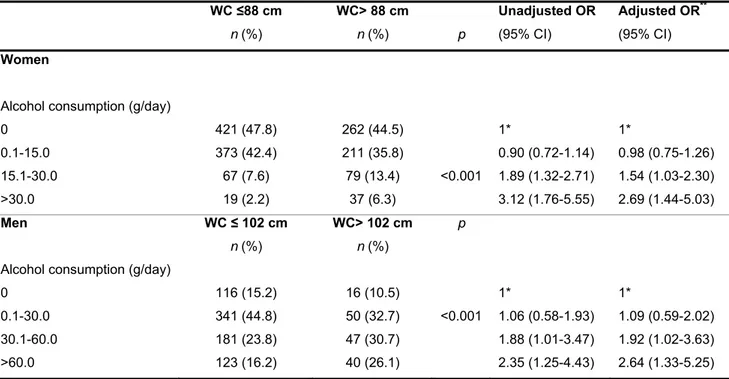
Alcohol consumption in the past year, was strongly and positively associated with abdominal obesity, even for amounts of 15-30 g/day of alcohol in women (OR: 1.54 95% CI: 1.03-2.30) and 30-60 g/day of alcohol in men (OR: 1.92, 95% CI: 1.02-3.63) (table 5).
Considering “heavy” alcohol consumption, more than 30 g/day for women, and more than 60 g/day for men, the probability of having obesity was almost three fold higher in women (OR: 2.69; 95% CI: 1.44-5.03) and men (OR: 2.64; 95% CI: 1.33-5.25), compared with non-drinkers (table 5).
Table 5: Alcohol consumption (last year) distribution and association with central obesity, by sex
WC ≤88 cm n (%) WC> 88 cm n (%) p Unadjusted OR (95% CI) Adjusted OR** (95% CI) Women
Alcohol consumption (g/day) 0 0.1-15.0 15.1-30.0 >30.0 421 (47.8) 373 (42.4) 67 (7.6) 19 (2.2) 262 (44.5) 211 (35.8) 79 (13.4) 37 (6.3) <0.001 1* 0.90 (0.72-1.14) 1.89 (1.32-2.71) 3.12 (1.76-5.55) 1* 0.98 (0.75-1.26) 1.54 (1.03-2.30) 2.69 (1.44-5.03) Men WC ≤ 102 cm n (%) WC> 102 cm n (%) p
Alcohol consumption (g/day) 0 0.1-30.0 30.1-60.0 >60.0 116 (15.2) 341 (44.8) 181 (23.8) 123 (16.2) 16 (10.5) 50 (32.7) 47 (30.7) 40 (26.1) <0.001 1* 1.06 (0.58-1.93) 1.88 (1.01-3.47) 2.35 (1.25-4.43) 1* 1.09 (0.59-2.02) 1.92 (1.02-3.63) 2.64 (1.33-5.25)
* Reference class of alcohol consumption;
** Odds Ratio adjusted for age, years of education, smoking habits, total energy intake, body mass index and physical exercise;
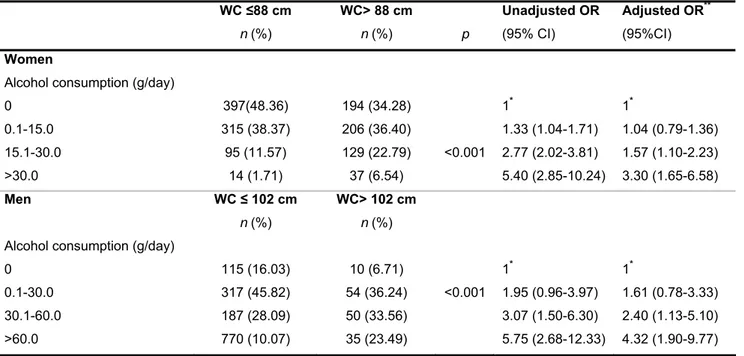
Table 6: Alcohol consumption (life-time) distribution and association with central obesity, by sex
WC ≤88 cm n (%) WC> 88 cm n (%) p Unadjusted OR (95% CI) Adjusted OR** (95%CI) Women
Alcohol consumption (g/day) 0 0.1-15.0 15.1-30.0 >30.0 397(48.36) 315 (38.37) 95 (11.57) 14 (1.71) 194 (34.28) 206 (36.40) 129 (22.79) 37 (6.54) <0.001 1* 1.33 (1.04-1.71) 2.77 (2.02-3.81) 5.40 (2.85-10.24) 1* 1.04 (0.79-1.36) 1.57 (1.10-2.23) 3.30 (1.65-6.58) Men WC ≤ 102 cm n (%) WC> 102 cm n (%)
Alcohol consumption (g/day) 0 0.1-30.0 30.1-60.0 >60.0 115 (16.03) 317 (45.82) 187 (28.09) 770 (10.07) 10 (6.71) 54 (36.24) 50 (33.56) 35 (23.49) <0.001 1* 1.95 (0.96-3.97) 3.07 (1.50-6.30) 5.75 (2.68-12.33) 1* 1.61 (0.78-3.33) 2.40 (1.13-5.10) 4.32 (1.90-9.77)
* Reference class of alcohol consumption
** Odds Ratio adjusted for age, years of education, smoking habits, total energy intake, body mass index and physical exercise
OR (95% CI): odds ratio (95% confidence intervals)
When life-time alcohol consumption was evaluated, the prevalence of central obesity was significantly higher among those, women and men, with higher intakes of alcohol (table 6), the same that was founded in the last-year results.
In women, heavy life-time alcohol consumption was significantly were positively associated with central obesity (OR: 3.30, 95% CI: 1.65-6.58). In men, the same positive association was observed, but even with stronger magnitude, (OR: 4.32, 95% CI: 1.90-9.77).
5. DISCUSSION
The present study showed that alcohol consumption was positively associated with obesity prevalence. This relation is dose dependent, is stronger in men than in women, and significant for both overall and central obesity. The magnitude of these associations was even more evident when lifetime alcohol consumption was considered.
Our results are in agreement with previous studies, that showed positive associations between alcohol consumption and overall obesity, particularly in men (82, 83, 84, 85) and, between alcohol consumption and central obesity (72, 73, 86, 87, 88, 89, 90).
On the other hand, particularly for women, some cross sectional studies had also reported inverse relationships between quantity of alcohol consumed and body mass index (70, 91, 92). In a longitudinal study, NESARC (National Epidemiological Survey on Alcohol Related Conditions), representative of USA population, the authors found that increased frequency and intensity of alcohol use, was associated with a small weight gain in men but, not in women (64).
In the presented study, in women, with amounts higher than 15g alcohol per day there was an association between alcohol consumption and obesity, overall and central. The magnitude of this association was stronger when the lifetime alcohol consumption variable was considerate. The risk for central obesity was 2.5 fold for women and almost 5 fold for men, above consumptions of 30g alcohol a day in women and, 60g alcohol a day, respectively. In both genders, even “moderated” alcohol consumptions were associated with increased risk of central obesity,
independently of age, education, total energy intake, body mass index and physical exercise. As expect, the same association was found in men, even for consumptions lower then 30g of alcohol per day.
The accumulation of fat in abdominal area, increase the risk of several adverse health outcome, independently of the absolute body weight (93). Alcohol suppresses lipid oxidation and the monoxidized fat is preferentially deposited in the abdomen (86). This effect, together with the increases of glucocorticoids release, lead to central obesity, witch seems to be the major feature of the metabolic syndrome (19, 20, 21, 94).
In populations with lower alcohol consumption, for instance USA, no significant association were found between waist circumference and alcohol consumption, during 9 years of follow-up study (95). However, data from European epidemiological studies pointed out to a direct association between alcohol consumption and visceral fat accumulation (87, 89, 90, 96). In Mediterranean populations, drinking alcoholic beverages (especially wine), is quite high, is socially accepted and, part of daily habits. Schroder et al. (73) found similar results as ours in a north population of Spain, however only in men. But the amount of alcohol consumption in our population is very high and probably, in this context, it was possible to find this positive association for high levels of consumption,
inclusive for women.
Average volume may not fully explain those important relations between quantity and frequency of drinking and obesity or other disease outcomes. Strong evidence indicated that caloric energy of alcohol contributes to subsequent weight gain (28). Alcohol consumption stimulates appetite (97). Circulating triacylglycerols and hypothalamic peptides rise after the consumption of ethanol, as well as fat,
supporting a role for the positive feedback loops between diet and peptide, in promoting the over-consumption of ethanol as well as fat-rich diets (98).
Clinical studies show that fat intake is elevated in ethanol drinkers, with bingeing on fat-rich foods is associated with high rates of alcoholism (97).
Animal studies reinforce those findings; rats maintained on a high-fat diet or exhibiting a preference for fat, consume more ethanol (100,101). Also, drinkers maintained on a fat-rich diet compared to a carbohydrate-rich diet exhibit shorter periods of abstinence from ethanol (102). Moreover, calories in liquids may fail to trigger the physiologic mechanism that produces the feeling of fullness (28). These facts associated with poor eating habits, namely fibber, common in heavy drinkers (103) could accentuate the alcohol metabolic effect. In the present study we evaluate the effect of alcohol on obesity independently of other factors, namely total energy intake. With this adjustment we were indirectly considering the adjustment for other macronutrients although we con not exclude the possibility of residual confounding of other dietary factors or patterns.
Drinking may stimulate eating, particularly in social settings where usually drinking alcohol is common and unhealthy foods. One study suggests that the number of people present at a meal is positively correlated with the quantity of food consumed, and that association is stronger when alcohol is involved (104).
Prior research suggests that men who consume alcohol do not consume fewer calories from other food sources, than men who do not drink (70). Contrarily, women who drink alcohol consume fewer calories from other sources, suggesting that alcohol calories could replace food calories, among women but not among men. In our population it seams like this behaviour is not common, because we found a statistical positive association with lifetime alcohol consumption and
obesity (overall and central) in women. Another explanation for the founded association could be related with the total amount of alcohol that is higher than in other previous studies population.
In time, over drinking and eating (excess of energy intake), depending on certain individual characteristics (gender, metabolic, genetic), food patterns, physical activity and economic and social setting, could lead to weight gain. There is a gradual process of alcohol associated with weight gain that should be considered in the development of public health polices.
Strengths and limitations
This is a cross sectional study and therefore limit the definition of sequence temporality of the association and the establishment of causality. The analyses of lifetime exposition minimize this problem, supporting the founded associations. The broad category of ‘non-drinkers’ includes a number of different drinking patterns, including people who have never drunk alcohol in their life and people who were once heavy drinkers but who gave up alcohol for health reasons, as well as other more complex histories. As previously described (51) a systematic misclassification error could be present by including as ‘abstainers’, many people who had reduced or stopped drinking, a phenomenon associated with ageing and ill health. Also, a problem arises in defining people who only drink very occasionally (e.g. champagne on special events), who may say they do not drink in one culture (e.g. Spain) but will consider themselves occasional drinkers in another (105). Conversely, data from the 1970s suggests that a small, but still significant, number (10%-15%) of those in temperance cultures who define
themselves politically as abstainers will nevertheless report drinking at least once in the past year (106). Although we could admit that this bias is present when the previous year consumption was considered, when life-time consumption is evaluated this possible error is again minimized.
The lack of a global consensus on survey questions, time frames and definitions of terms such as heavy drinking make the data inconsistent, difficult to interpret, and not comparable cross-nationally. The definition of moderate drinking has a very broad range (from 5 to 60 g of alcohol per day) depending on the study population, and the tool used for assessment. We used the American Heart Association recommendations that assume different cut off points for women and men and to facilitate international results comparisons.
Alcohol quantity may not fully explain important relations between drinking and health outcomes. Drinking patterns, frequency, and beverage choices, account for differences in physical activity, diet, and changes in alcohol consumption that could also be involved in obesity development. However, those effects were not approached in the present analyses.
The mean of energy intake was similar in obese and non obese. The underreported food consumption by obese individuals was described in previous studies (107). In the present study, the non-obese category includes also the overweight people, which could also underreport food consumption. Additionally, no data is available about the specific possibility of misreporting on alcohol consumption by obese people.
Misreporting of self-reported alcohol consumption, particularly among heavy alcohol consumers, cannot be excluded. However, this is a general characteristic for epidemiological studies addressing the association between alcohol
consumption and disease outcome. This problem could be minimized in a community sample were alcohol consumption is socially accepted and part of the daily habits.
The main strengths of the present study is the relatively large number of participants from both sexes, the possibility of evaluating the effect of two different approaches of alcohol consumption (life-time and current intake), and the adjustment for several important confounders. The wide range of alcohol consumption in women and men could be also considered strength in this study, giving the possibility of showing the effects of alcohol on obesity in both genders.
6. CONCLUSION
The present study performed with Portuguese adults, supports the conclusion that amounts of alcohol consumption higher than 30g/day, were related with higher prevalence of overall and central obesity, in both sexes.
The magnitude of this relation was stronger in men than women and, when lifetime alcohol consumption was considered.
7. REFERÊNCIAS BIBLIOGRÁFICAS
1. Report of a WHO/FAO Expert Consultant. Diet, Nutrition and, the Prevention of Chronic Diseases. Genebra 2003.
2. Gutiérrez-Fisac JL, et al. Increasing prevalence of overweight and obesity among Spanish adults, 1987-1997. Int J Obes Relat Metab Disord 2000; 24: 1677-82.
3. http://www.irdes.fr/ecosante/OCDE/814010.html
4. Entrala-Bueno A, Iglesias C, De Jesús F. Diet and physical activity. A healthful binomial. Eur J Clin Nutr 2003; 57: 63-5.
5. Schroder H, et al. Secular trends of obesity and cardiovascular risk factors in a Mediterranean population. Obesity 2007;15:557-562.
6. Do Carmo I, Dos Santos O, Camolas J, Vieira J, Carreira M, Medina L, Reis L, Myatt J, Galvão-Teles A. Overweight and obesity in Portugal: national prevalence in 2003-2005. Obes Rev 2008; 1:11-9.
7. Organisation for Economic Co-operation and Development. DELSA/HEA/WD/HWP, Health Working Papers Mar 2009; No 45.
8. McTigue K, et al. Mortality and cardiac and vascular outcomes in extremely obese women. JAMA 2006; 296:79–86.
9. Flegal KM, et all. Excess deaths associated with underweight, overweight, and obesity. JAMA 2005; 293:1861–1867.
10. Fontaine KR, et all. Years of life lost due to obesity. JAMA 2003; 289:187–193. 11. Koh-Banerjee P, et al. Prospective study of the association of changes in dietary intake, physical activity, alcohol consumption, and smoking with 9-y gain in waist circumference among 16587 US men. Am J Clin Nutr 2003; 78: 719-27
12. Banegas JR, et all. P, Rodríguez-Artalejo F. A simple estimate of mortality attributable to excess weight in the European Union. Eur J Clin Nutr 2003; 57:
13. Bhattacharya J, Sood N. Health Insurance and Obesity Externality. National Bureau of Economic Research Working Paper 2005. No 11529
14. Thompson D, Wolf AM. The Medical-Care Cost Burden of Obesity. Obes Rev 2001; 2:189-197.
15. Finkelstein EA, Ruhm CJ, Kosa KM. Economic Causes and Consequences of Obesity. Annu Rev Pub Health 2005; 26:239-257.
16. Simon GE, et al. Association between obesity and psychiatric disorders in the US adult population. Arch Gen Psychiatry 2006; 63:824–830.
17. Rippe JM, Crossley S, Ringer R. Obesity as a chronic disease: modern medical and lifestyle management. J Am Diet Assoc 1998; 98:S9–15.
18. Kissebabh A, Krakower GR. Regional adiposity and morbidity. Phisiol Rev 1994; 74:761-811.
19. Wajchenberg BL. Subcutaneous and visceral adipose tissue: their relation to the metabolic syndrome. End Rev 2000; 21:697-738.
20. Aronne LJ. Classification of obesity and assessment of obesity -related health risks. Obs Res 2002; 10: 105s-115s.
21. Poirier P, Despres JP. Waist circumference, visceral obesity, and cardiovascular risk. J Cardiopulm Rehabil 2003; 23:161-169.
22. Lieber CS. Methabolism of ethanol, In Lieber CS, ed. Medical and nutritional complications of alcoholism. New York: Plenum Publishing Corporation, 1992. pp1-35.
23. Ferreira FAG, Graça MES. Tabela de composição de alimentos portugueses. 2ª. Lisboa: Instituto Nacional de Saúde Dr. Ricardo Jorge; 1985.
24. Lieber CS. Microssomal ethanol-oxidizing system (MEOS): the first 30 years (1968-1998)- a review. Alcohol Clin Esp Res 1999; 23:991-1007.
25. Lieber CS, De Carli LM. Hepatic microssomal ethanol-oxidizing system: in vitro characteristics and adaptive properties in vivo. J Biol Chem 1970; 245:2505-2512. 26. Lands WEM, Zakhari S. The case of the missing calories. Am J Clin Nutr 1991; 54:47-48.
27. Sakurai Y, et al. Relation of total and beverage – specific alcohol intake to body mass index and waist-t-hip ratio: a study of self – defence officials in Japan. Eur J Epidemiol 1997; 13:893-898.
28. Suter PM. Is alcohol consumption a risk factor for weight gain and obesity? Crit Rev Clin Lab Sci 2005; 42:197-227.
29. Anderson P, Baumberg B. Alcohol in Europe. London: Institute of Alcohol Studies 2006.
30. Furlani P, et al. Ex-post evaluation of the Common Market organisation for Wine. Tender AGRI/ Evaluation/2002/6. Prepared for European Commission 2003-DGagriculture.
http://ec.europa.eu/comm/agriculture/eval/reports/wine/index_en.htm
31. Room R, Babor T, Rehm J. Alcohol and public health. Lancet 2005; 365: 519-530.
32. Anderson P. The risk of alcohol. PhD thesis. 2003 Nijmegen, Radboud University. http//webdoc.ubn.kun.nl/mono/a/Anderson_p/riscofal.pdf.
33.Marques-Vidal P, Dias CM. Trends and determinants of alcohol consumption in Portugal: results from the national health surveys 1995 to 1996 and 1998 to 1999. Alcohol Clin Exp Res 2005; 29: 89-97.
34. Rehm J, et al. In WHO (ed), Comparative quantification of health risks: global and reginal burden of disease due to selected major risk factors 2004. Geneva:WHO.
35. Lemmens PH. Relationship of alcohol consumption and alcohol problems at the population level. In Heather N, Peters TJ, StockweelT eds. International handbook of alcohol dependence and problems 2001. Chichester: John Wiley and Sons, Ltd.
36. Renaud SC, Gueguen R, Siest G, Salamon R. Wine, beer, and mortality in middle-aged men from Eastern France. Arch Intern Med 1999; 159:1865–1870. 37. Hansen et al. Effect of red wine and red grape extract on blood lipids. Homeostatic factors, and other risk factors for cardiovascular disesse. Eur J Clin Nutr 2005; 59:449-455.
37. Keil U, Chambless LE, Do¨ring A, Filipiak B, Stieber J. The relation of alcohol intake to coronary heart disease and all-cause mortality in a beer drinking population. Epidemiol 1997; 8:150 – 156.
38. Kitamura A, Iso H, Sankai T, Naito Y, Sato S, Kiyama M, et al. Alcohol intake and premature coronary heart disease in urban Japanese men. Am J Epidemiol 1998; 147: 59–65.
40. Rimm EB, Klatsky A, Grobbee D, Stampfer MJ. Review of moderate alcohol consumpton and reduced risk of coronary heart disease: is the effect due to beer, wine, or spirits? Br Med J 1996; 312:731–736.
41. Estruch R, et al. Different effects of red wine and gin consumption on inflammatory biomarkers of atherosclerosis: a prospective randomized crossover trial. Effects of wine on inflammatory markers. Atherosclerosis 2004; 175: 117– 123.
42. Sierksma A, et al. Moderate alcohol consumption reduces plasma C-reactive protein and fibrinogen levels; a randomized, diet-controlled intervention study. Eur. J. Clin. Nutr 2002; 56: 1130–1136.
43. Sierksma A, et al. Effect of moderate alcohol consumption on adiponectin, tumor necrosis factor-alpha, and insulin sensitivity. Diabetes Care 2004; 27: 184– 189.
44. Wandler A et al. Ethanol exerts anti-inflammatory effects in human adipose tissue in vitro. Molecular and Cellular Endocrinology 2008; 296: 26–31.
45. Friedman H. Alcohol effects on cytokine responses by immunocytes. Alcohol Clin. Exp. Res 1998 22, 184S–187S.
46. Szabo G e tal. Regulation of human monocyte functions by acute ethanol treatment: decreased tumor necrosis factor-alpha, interleukin-1 beta and elevated interleukin-10, and transforming growth factor-beta production. Alcohol Clin. Exp. Res. 1996; 20: 900–907.
47. Saeed RW et al.. Ethanol blocks leukocyte recruitment and endothelial cell activation in vivo and in vitro. J. Immunol 2004; 173: 6376–6383.
48. Englund OL. Alcohol consumption in relation to metabolic regulation, inflammation, and adiponectin in 64-year-old Caucasian women: a population-based study with a focus on impaired glucose regulation. Diabetes Care 2006; 29, 908–913.
49. Corrao et al. Alcohol and coronary heart disease: a meta-analysis. Addiction 2000; 95; 1505-1523.
50. Nielsen et al. the influence of duration of follow-up on the association between alcohol consumption and cause-specific mortality in a prospective cohort study. Ann Epidemiol 2005; 15:44-55.
51. Fillimore KM, et al. Moderate alcohol use and reduced mortality risk: Systematic error prospective studies. Addiction Research and Theory 2006:1-31. 52. Flatt JP, et al. Effects of dietary fat on postprandial substrate oxidation and on carbohydrate and fat balances. J Clin Invest 1985; 76:1019-1024.
53. Flatt JP. The impact of dietary carbohydrates on body weight maintenance. In:Altschul AM, Ed. Low Calorie Foods Handbook 1993 pp.441-477. New York: Marcel Dekker Inc.
54. Jequire E, Tappy L. Regulation of body weight in humans. Phisiol Rev 1999; 79:451-480.
55. Lieber CS. The influence of alcohol in nutritional status. Nutr Rev 1988; 46:241-254.
56. Abel EL. Cannabis: Effects on hunger and thirst. Behavioral Biology 1975; 15: 255−281.
57. Grunberg NE. The effects of nicotine and cigarette smoking on food consumption and taste preferences. Addictive Behaviors 1982; 7: 317−331.
58. Hetherington MM, et al. Stimulation of appetite by alcohol. Physiology & Behavior 2001; 74: 283−289.
59. Siler SQ. The inhibition of gluconeogenesis following alcohol in humans. Am J phisiol 1998; 275:E897-E907.
60. De Castro JM, Orozco S. Moderate alcohol intake and spontaneos eating patterns of humans:evidence of unregulated supplementation. Am J Nutr 1990; 52:246-253.
61. Forsander OA. Hypotesis: factors involved in mechanisms regulating food intake affect alcohol consumption. Alcohol Alcohol 1998; 64:279-285.
62. Barry D, Petry NM. Associations between body mass index and substance use disorders differ by gender: Results from the National Epidemiologic Survey on Alcohol and Related Conditions. Addictive Behaviors 2009; 34: 51–60
63. Breslow RA, Smothers BA. Drinking patterns and body mass index in never smokers: National Health Interview Survey, 1997–2001. Am J Epidemiol 2005; 161: 368–376.
64. French MT, et al. Alcohol consumption and body weight. Health Econ. (2009).Published online in Wiley Inter Science (www.interscience.wiley.com). DOI: 10.1002/hec.1521.
65. Hillers VN, Massey LK. Interrelationship of moderate high alcohol consumption with the diet and health status. Am J Clin nutr 1985; 41:356-362.
66. Rissanen A, et al. Employed problem drinkers: a nutritional risk group? Am J Clin Nutr 1987; 45:456-461.
67. Carolyn A. et al. Longitudinal associations among depression, obesity and alcohol use disorders in young adulthood. Doi:10.1016/josppsych.2009.05.013 (in press).
68. Collaborative group on hormonal factors in breast cancer. Alcohol, tobacco and breast cancer - collaborative reanalysis of individual data from 53 epidemiological studies, including 58,515 women with breast cancer and 95,067 women without the disease. British J Cancer 2002; 87:1234-1245.
69. Swift R. Direct measurement of alcohol and its metabolites. Addiction 2003; 98 (S2):73-80.
70. Colditz GA, et al. Alcohol intake in relation to diet and obesity in women and men. Am J Clin Nutr 1991; 54: 49−55.
71. Prentice AM. Alcohol and obesity. Int J Obes Rel Metab Dis 1995; 19: S44−50 Suppl 5.
71. Wannamethee SG, Shaper AG. Alcohol, body weight, and weight gain in middle-aged men. Am J Clin Nutr 2003; 77:1312−1317.
72. Wannamethee SG, Shaper AG, Whincup PH. Alcohol and adiposity: Effects of quantity and type of drink and time relation with meals. Int J Obes 2005; 29: 1436−1444.
73. Schroder H, et al. Relationship of abdominal obesity with alcohol consumption at population scale. Eur J Nutr 2007; 46: 369−376.
74. Hellerstedt WL, Jeffery RW, Murray DM. The association between alcohol intake and adiposity in the general population. Am J Epidemiol 1990; 132: 594−611.
75. Ramos E, Lopes C, Barros H. Investigating the effect of nonparticipation using a population-based case-control study on myocardial infarction. Ann Epidemiol 2004; 14: 437-441.
76. Folstein M, Folstein S, McHush R. 'Mini-mental state'. A practical method for grading the cognitive state of patients for the clinician. J Psychiatr Res 1975; 12: 189-198.
77. Expert Panel on the Identification, Evaluation, and Treatment of Overweight in Adults. Clinical guidelines on the Identification, Evaluation, and Treatment of Overweight and Obesity in adults: executive summary. Am J Clin Nutr 1998; 68: 899-917.
78. Batista I, Bandarra NM. Influência de quatro métodos culinários na composição química de várias espécies de peixe. Rev Port Nutr. 1993; 3:5-14. 79. Mano ML, et al. Composição de alguns alimentos cozinhados. Alguns produtos servidos em "snack-bares". Rev Port Nutr. 1989; 4:19-24.
80. Lopes C. Reproducibility and validity of a semi-quantitative food-frequency questionnaire. In: Diet and acute myocardial infarction: a population-based case-control study. [PhD thesis in Portuguese]. Porto: University of Porto; 2000, pp 79-115.