F
F
I
I
N
N
A
A
N
N
C
C
I
I
A
A
L
L
I
I
S
S
A
A
T
T
I
I
O
O
N
N
A
A
N
N
D
D
T
T
H
H
E
E
F
F
A
A
L
L
L
L
I
I
N
N
T
T
H
H
E
E
L
L
A
A
B
B
O
O
U
U
R
R
S
S
H
H
A
A
R
R
E
E
:
:
A
A
P
P
A
A
N
N
E
E
L
L
D
D
A
A
T
T
A
A
E
E
C
C
O
O
N
N
O
O
M
M
E
E
T
T
R
R
I
I
C
C
A
A
N
N
A
A
L
L
Y
Y
S
S
I
I
S
S
F
F
O
O
R
R
T
T
H
H
E
E
E
E
U
U
R
R
O
O
P
P
E
E
A
A
N
N
U
U
N
N
I
I
O
O
N
N
C
C
O
O
U
U
N
N
T
T
R
R
I
I
E
E
S
S
R
R
i
i
c
c
a
a
r
r
d
d
o
o
B
B
a
a
r
r
r
r
a
a
d
d
a
a
s
s
D
D
e
e
z
z
e
e
m
m
b
b
r
r
o
o
2
2
0
0
1
1
7
7
W
W
P
P
n
n
.
.
º
º
2
2
0
0
1
1
7
7
/
/
0
0
2
2
DOCUMENTO DE TRABALHO WORKING PAPERFINANCIALISATION AND THE FALL IN THE LABOUR SHARE: A
PANEL DATA ECONOMETRIC ANALYSIS FOR THE EUROPEAN
UNION COUNTRIES
1Ricardo Barradas*
WP n. º 2017/02
DOI: 10.15847/dinamiacet-iul.wp.2017.02
1. INTRODUCTION ... 3
2. THE RELATIONSHIP BETWEEN FINANCIALISATION AND THE FALL IN THE LABOUR SHARE ... 5
3. FINANCIALISATION AND THE LABOUR SHARE: AN ECONOMIC MODELISATION ... 10
4. DATA AND METHODOLOGY: THE ECONOMETRIC FRAMEWORK ... 13
4.1 DATA ... 13
4.2 METHODOLOGY ... 17
5. EMPIRICAL RESULTS AND DISCUSSION ... 19
6. CONCLUSION ... 28
7. REFERENCES ... 30
8. APPENDIX ... 37
2
FINANCIALISATION AND THE FALL IN THE LABOUR SHARE: A PANEL
DATA ECONOMETRIC ANALYSIS FOR THE EUROPEAN UNION
COUNTRIES
2ABSTRACT
This paper conducts an empirical analysis of the relationship between financialisation and the labour share using panel data composed of 27 European Union countries over 19 years (from 1995 to 2013). Adopting a Kaleckian perspective, framed in the post-Keynesian literature, financialisation exerts a negative influence on the labour share through three different channels: the change in the sectorial composition of economies (the increasing importance of financial activity and the decreasing importance of general government activity), the proliferation of ‘shareholder value orientation’ and the deterioration of general workers’ bargaining power. We estimate a labour share equation with the traditional variables (lagged labour share, technological progress, globalisation, education and output growth) and four further measures of financialisation (financial activity, general government activity, ‘shareholder value orientation’ and the trade union density rate). The findings show a disruptive relationship between financialisation and the labour share in European Union countries, mainly through the channels of general government activity and ‘shareholder value orientation’. It is also found that financialisation has contributed to a fall in the labour share in European Union countries as a whole and more specifically in non-euro area countries, ‘bank-based’ countries and ‘coordinated market’ countries. The slowdown of output was the main driver of the fall in the labour share in European Union countries, a trend that could persist in the future taking into account the fears of potential ‘secular stagnation’ in the current era of financialisation.
KEYWORDS
Financialisation, Functional Income Distribution, Labour Share, European Union, Panel Data, Least-Squares Dummy Variable Bias-Corrected Estimator
JEL CLASSIFICATION
C23, D33, E25 and E44
2 The authors thank the helpful comments and suggestions of Marta Silva and Rúben Barros. The usual disclaimer applies.
3
1. INTRODUCTION
Mainstream economics states that the labour share and the profit share are constant over time (Bowley, 1937; and Kaldor, 1961). Nonetheless, the labour share has decreased and the profit share has increased in the majority of economies since the 1980s (Stockhammer, 2009, 2012 and 2017; Kristal, 2010; Dünhaupt, 2011; Peralta and Escalonilla, 2011; Estrada and Valdeolivas, 2012; Lin and Tomaskovic-Devey, 2013; among others).
Against this backdrop scholars of financialisation, framed in the post-Keynesian literature and from a Kaleckian perspective, advocate that financialisation represents an important driver in the fall of the labour share due to three channels (Hein, 2012; Hein and Detzer, 2014; Michell, 2014; Hein and Dodig, 2015; among others). The first channel involves a change in the sectorial composition of economies, namely through growth in the financial sector and a reduction in general government activity. The second channel is caused by the proliferation of a corporate governance model based on ‘shareholder value orientation’. The third channel is related to the deterioration of the collective bargaining power exerted by trade unions.
Accordingly, some empirical studies have emerged in recent years to assess the relationship between financialisation and the labour share. Most of these studies derive and estimate labour share equations, finding statistical evidence that financialisation has caused a decline in the labour share (e.g. Stockhammer, 2009 and 2017; Kristal, 2010; Peralta and Escalonilla, 2011; Dünhaupt, 2013a; Lin and Tomaskovic-Devey, 2013; Alvarez, 2015; Köhler et al., 2016; and Barradas and Lagoa, 2017).
This paper examines the impact of financialisation on the labour share in European Union (EU) countries between 1995 and 2013, making a threefold contribution to the literature. Firstly, it assesses in a complete way the effects of financialisation on the labour share by analysing the three aforementioned channels, whereas most empirical studies on this matter typically focus on a single aspect of financialisation (Köhler et al., 2016). The study by Barradas and Lagoa (2017) is the only exception, but it is centred on Portugal between 1978 and 2012 through a time series econometric analysis. Secondly, a panel data econometric analysis is performed rather than a time series econometric analysis, which allows us to determine whether financialisation has been responsible for a fall in the labour share in a large set of countries. A panel data econometric analysis also allows a higher number of observations, sample variability and less collinearity, improving the accuracy and reliability of the estimates. Thirdly, the study
4
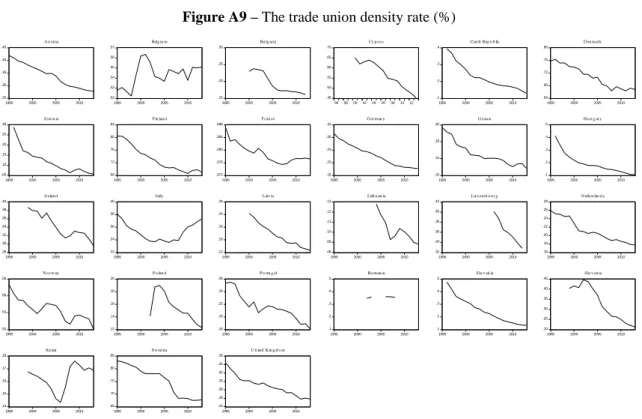
focuses on EU countries. EU countries represent an interesting case study, as they share common economic rules because they belong to the same economic and political region. Nevertheless, they also present a certain degree of heterogeneity, namely in terms of their presence in the euro area (euro area countries and non-euro area countries), their type of financial system (‘market-based’ countries and ‘bank-based’ countries in the typology of Bijlsman and Zwart, 2013; and Haan et al., 2015) and their variety/model of capitalism (‘liberal market’ countries, ‘coordinated market’ countries, ‘hybrid/mixed market’ countries and ‘transition’ countries in the spirit of Hall and Soskice, 2001; and other related works in the field of comparative political economy). Despite this diversity, there has been a fall in the labour share in most of these countries (Figure A1 in the Appendix), concurrent with growth in the financial sector (Figure A6 in the Appendix), a reduction in general government activity (Figure A7 in the Appendix), an increase in the ‘shareholder value orientation’ (Figure A8 in the Appendix) and a weakening of trade unions (Figure A9 in the Appendix). It would therefore be interesting to determine whether there is a disruptive relationship between financialisation and the labour share and the extent to which financialisation has contributed to the fall in the labour share.
We estimate a labour share equation using standard variables (lagged labour share, technological progress, globalisation, education and output growth) and four additional variables linked to financialisation (financial activity, general government activity, ‘shareholder value orientation’ and trade union density rate). The results confirm that financialisation exerts a negative influence on the labour share in EU countries, mainly through general government activity and ‘shareholder value orientation’. It is also found that financialisation has indeed contributed to the fall in the labour share in EU countries as a whole as well as in the case of non-euro area countries, ‘bank-based’ countries and ‘coordinated market’ countries.
The remainder of the paper is organised as follows. In Section 2 we present a short literature review on the relationship between financialisation and the fall in the labour share. A labour share equation is built in Section 3. The data and econometric methodology are described in Section 4. Section 5 presents the main findings and the respective discussion. Finally, Section 6 concludes.
5
2. THE RELATIONSHIP BETWEEN FINANCIALISATION AND THE
FALL IN THE LABOUR SHARE
Functional income distribution is the way in which output is divided between the different factors of production, namely labour and capital (Dünhaupt, 2013b). Thus, the labour share and the profit share correspond to the fraction of the national income that is directed to labour (employees) and capital (shareholders), respectively.
Against this background mainstream economics argues that these shares are constant over time. This idea is so embedded in the mainstream literature that it is commonly referred to as a ‘law’ (Bowley, 1937) or even as a ‘stylized fact’ of economic growth (Kaldor, 1961).
Nonetheless, the labour share has declined in the major advanced economies since the early 1980s, with a corresponding increase in the profit share (Stockhammer, 2009, 2012 and 2017; Kristal, 2010; Dünhaupt, 2011; Peralta and Escalonilla, 2011; Estrada and Valdeolivas, 2012; Lin and Tomaskovic-Devey, 2013; among others). Despite some heterogeneity in that evolution, EU countries are not an exception of the global trend of decline in the labour share since the mid-1990s (Figure A1 to Figure A9 in the Appendix)3. Moreover, it is important to note that in some countries the labour share already represents less than half of the national income. This is the case of the Czech Republic, Greece, Lithuania, Hungary, Poland, Romania, Slovakia, Latvia, Norway, Ireland, Malta and Sweden. This seems to put into question the constancy of the labour share over time, which is even considered as ‘a mirage’ (Keynes, 1939) or a ‘bit of a miracle’ (Solow, 1958).
This unequal distribution of the national income has increased the conflict of corporations and shareholders against wage earners (Dünhaupt, 2013a), taking into account that the importance of the shares of rents, profits and wages provides an indication of the relative power of different groups in a certain society (Atkinson, 2009). Several consequences can be identified in the literature regarding the fall in the labour share. The first is the emergence of social strains (Dünhaupt, 2011). The second is the reduction in the aggregate demand because the economic growth in most OECD countries is characterized by a ‘wage-led’ model instead of a ‘profit-led’ model (Naastepaad and Storm, 2007; Hein and Vogel, 2008; and Dünhaupt, 2013a). Note that wage incomes are normally related to higher consumption propensities than
3 As highlighted in Section 4, our sample covers the period from 1995 and 2013. However, the decreasing
6
profit incomes and therefore generate a greater aggregate demand (Stockhammer, 2012). The third is the undermining of the sustainability of social security systems, since their main funding source in some countries is based on contributions that depend on the level of wages (Cichon et al., 2004). The fourth is the increase in households’ indebtedness to mitigate the fall in wages and to sustain conspicuous consumption (‘keeping up with the Joneses’) (Hein, 2012). The fifth is the increase in inequality in personal incomes (Karanassou and Sala, 2013).
Against this backdrop scholars on financialisation, framed in the post-Keynesian literature4, claim that financialisation is one of the drivers of the fall in the labour share in the last three decades. Adopting a Kaleckian perspective, these authors stress that the relationship between financialisation and the fall in the labour share works through three different channels and several sub-channels (Hein, 2012; Hein and Detzer, 2014; Michell, 2014; Hein and Dodig, 2015; among others) – Figure 1.
Figure 1 – The relationship between financialisation and the fall in the labour share
Falling labour share (Rising profit share)
Change in sectorial composition Increasing importance of finance
Downsizing of government activity
‘Shareholder value orientation’ Rise in top management wages
Rise in the profit claims of rentiers
Weakening of trade unions
‘Shareholder value orientation’ Increasing importance of finance Downsizing of government activity Deregulation of labour markets Liberalisation and globalisation
Source: Barradas and Lagoa (2017) based on Hein (2012), Hein and Detzer (2014), Michell (2014), Hein and Dodig
(2015), among others
The first channel is related to a change in the sectorial composition of economies, namely through the increasing importance of the financial sector in relation to the non-financial sector and the decreasing weight of general government activity.
4 As emphasised by Stockhammer (2009), we recognise that there are other schools of thought explaining
the fall in the labour share. For instance, neoclassical economics emphasises the role of technological progress and preferences, Keynesian/Kaldorian economics evokes the importance of the aggregate demand and Marxian economics highlights the relative power relations in the class struggle. Nonetheless, these schools of thought are only applied in a highly restrictive long-term equilibrium of a closed economy characterised by full capacity utilisation (Stockhammer, 2009). Thus, they cannot be used to analyse the medium-term changes in income distribution of economies in which the capacity is underutilised and that are open to trade and international and financial capital. These caveats are our main reasons for following the post-Keynesian literature and a Kaleckian perspective.
7
On the one hand, Hein (2012) stresses that the increasing importance of the financial sector implies a decrease in the fall in the labour share, because the labour share of the financial sector is traditionally smaller than the labour share of the non-financial sector. Additionally, Kus (2012) highlights that the expansion of the financial sector is responsible for the shrinkage in the profitability of the non-financial sector, which is reflected in the contraction of the wages of middle-class and blue-collar workers in the non-financial sector. This author also stresses that this change in the sectorial composition of economies from non-financial to financial activities has contributed to the weakening of certain policies and institutions that normally mitigate the effects of poverty and inequality, for instance trade unions and/or minimum wage laws that function as institutional mechanisms that tend to support wages.
On the other hand, Hein (2012) and Dünhaupt (2013a) admit that the decreasing weight of general government activity also fosters the reduction in the labour share because the general government is a ‘non-profit’ institutional sector from the point of view of national accounts that by definition does not produce any capital income. In the same vein, Dünhaupt (2013b) reiterates that the privatisation of public corporations is also associated with a fall in the labour share, because public corporations have a larger labour share than private ones. The reduction in general government activity (either directly or indirectly through public corporations) is explained by the financialisation logic, which aims to enlarge market interests to areas that were previously under the control of the public sector (Fine, 2011).
The second channel is connected with the emergence of a new design of corporate governance that favours the maximisation of shareholder value over the other constituents of corporations, which tends to favour a rise in top management wages, a rise in the profit claims of rentiers and a cut in the labour costs5. This is the so-called ‘shareholder value orientation’ (Aglietta, 2000; Lazonick and O’Sullivan, 2000; Stockhammer, 2010; among others). The fall in the labour share is also explained by the so-called ‘neoliberal paradox’, according to which shareholders’ demand for higher and higher levels of profits force non-financial corporations to cut their labour costs (Crotty, 2005).
The third channel involves the deterioration of workers’ bargaining power, typically measured by the collective bargaining power played by trade unions, which tends to support a
5 However, the rise in top management wages could have a positive impact on the labour share, because
these wages are also included in that share (Hein, 2012; Hein and Detzer, 2014). These authors also note that the labour share excluding top management wages has fallen even more than the total labour share.
8
decrease in wages (Stockhammer, 2009). Hein (2012) offers five explanations for the weakening of trade unions.
Firstly, the ‘shareholder value orientation’ has promoted a strategy based on short-term profitability with deleterious effects on real investment, economic growth and employment (Orhangazi, 2008; Hein, 2012; among others), which implies a fading of trade unions.
Secondly, the increasing importance of the financial sector vis-à-vis the non-financial sector has also been responsible for weakening trade unions, taking into account that the unionisation levels are normally stronger in the non-financial sector (and mainly in manufacturing activities).
Thirdly, the downsizing activity of the general government sector has also hurt the power of trade unions, because public servants tend to present higher unionisation levels than private servants. Additionally, the abandonment of Keynesian demand-side policies aimed at low levels of unemployment and the proliferation of Monetarist supply policies aimed at low levels of inflation have originated huge flexibility in the labour market and an increase in unemployment, which also restrains collective wage bargaining (Kus, 2012).
Fourthly, the deregulation of labour markets has also undermined the bargaining power of trade unions. The flexibility of labour markets has been adopted as an excuse to decrease the unemployment levels, because they tend to be attributable to a rigid labour market and overgenerous welfare states. Against this backdrop a majority of measures have been focused on reducing the level and duration of unemployment benefits, decreasing employment protection and decentralising collective and wage bargaining (Stockhammer, 2004).
Fifthly, liberalisation and globalisation have facilitated the relocation of corporations’ production from high- to low-wage countries, seeking a reduction in costs and an increase in profits. Corporations are becoming ‘nomadic’, because they are not engrained in any specific country, which tends to decrease their feeling of responsibility towards local communities, employees and other stakeholders (Zamagni, 2003). This phenomenon has increased the competition among workers through the ‘threat effect’ of corporations, because the utilisation of outsourcing and the relocation of production to low-wage countries reduce the power of trade unions, as they are predominantly organized at the national level (Hein, 2012). As this delocalisation is more notorious in the case of manufacturing corporations, the consequence has been the replacement of jobs in the manufacturing sector (which are normally better paid and more unionized) with jobs in the service sector (which are normally lower paid and less unionized). At the same time, liberalisation and globalisation have delineated an increase in
9
multi- and transnational corporations, in which labour’s position is weaker than in national corporations.
Despite the growing body of theoretical work on the relationship between financialisation and the fall in the labour share, there are few empirical studies on the subject (Peralta and Escalonilla, 2011; Dünhaupt, 2011 and 2013a; Alvarez, 2015; and Köhler et al., 2016). Nonetheless, we can identify in the literature some empirical studies estimating labour share equations for several countries to conduct an econometric analysis of financialisation’s impact on the labour share. Most of these studies find it to be harmful.
Stockhammer (2009 and 2017), Kristal (2010), Peralta and Escalonilla (2011), Dünhaupt (2013a) Lin and Tomaskovic-Devey (2013), Alvarez (2015), Köhler et al. (2016) and Barradas and Lagoa (2017) are good examples of econometric studies on this matter. However, they do not study directly all three aforementioned channels related to the influence of financialisation on the labour share. By incorporating only some channels into their estimates, they do not assess correctly and completely the effects of financialisation on the labour share. Köhler et al. (2016) argue that these papers are typically centred on a single aspect of financialisation but that they also do not include in their estimates any variables linked with the first channel. The study by Barradas and Lagoa (2017) is the only exception, but it focuses only on Portugal. They perform a time series econometric analysis from 1978 and 2012 using an autoregressive distributed lag model. Their results show that financialisation has exerted an influence on the evolution of the Portuguese labour share, notably through channels linked with the general government activity and trade unions.
This paper aims to make an empirical assessment of the relationship between financialisation and the fall in the labour share using a large set of countries, the EU countries. To the best of our knowledge, this is the first paper to conduct a panel data econometric analysis for a group of countries over time about the relationship between financialisation and the labour share. This approach will allow us to perceive whether the prejudicial effects of financialisation have been generalised and are transversal to this large set of countries or whether they only affected specific countries from a macroeconomic view-point6.
6 From an econometric view-point, panel data econometric analysis has several other advantages over
simple time series econometric analysis, as pointed out by Baltagi (2005) and Brooks (2008), among others. The majority of these advantages are directly related to the possibility of collecting a higher number of observations with more variability and less collinearity, which tends to improve the accuracy and the reliability of estimates.
10
3. FINANCIALISATION AND THE LABOUR SHARE: AN ECONOMIC
MODELISATION
In the following we estimate an equation in which the labour share is a function of two different groups of variables. Firstly, we include four variables that are normally considered to be traditional explanations for the evolution of the labour share: lagged labour share, technological progress, globalisation, education and output growth. Secondly, as described previously, we incorporate four variables linked to the three channels related to the effects of financialisation on the labour share: financial activity, general government activity, ‘shareholder value orientation’ and trade unions.
Accordingly, our labour share equation takes the following form:
(1)
where i is the country, t is the time period (years),
LS
is the labour share of country i at timet,
TP
is the technological progress of country i at time t,GL
is the globalisation degree of country i at time t,ED
is the education level of country i at time t,OG
is the output growth of country i at time t,FA
is the financial activity of country i at time t,GA
is the general government activity of country i at time t,SO
is the ‘shareholder value orientation’ of country i at time t andTU
is the importance of trade unions of countryi
at timet
.The two-way error term component is given by:
(2)
where i accounts for unobservable country-specific effects and t accounts for time-specific effects. The term it, is the random disturbance in the regression, varying across countries and years.
We include the lag of the dependent variable, taking into account the persistence degree that is present in macroeconomic variables in general and in wages in particular. This also allows us to control the labour adjustment costs (Karanassou and Sala, 2013) and wage inertia or sluggishness (higher/lower wages normally lead to higher/lower subsequent wages, which means that current wages depend on past wages). Wage inertia is a well-recognised empirical
t , i t i t , i t , i t , i 9 t , i 8 t , i 7 t , i 6FA
GA
SO
TU
0 1 i,t1 2 i,t 3 i,t 4 i,t 5 i,t t , i LS TP GL ED OG LS
11
fact in labour economics (Blanchard and Katz, 1997; and Montuenga-Gómez and Ramos-Parreño, 2005).
All the variables are expressed as ratios (labour share, globalisation, education, financial activity, general government activity, ‘shareholder value orientation’ and trade unions) or growth rates (technological progress and output growth). This approach has two different advantages. Firstly, it allows us to use variables from different countries that are expressed in different currencies, avoiding the utilisation of exchange rates to convert them into the same currency. Secondly, it facilitates the interpretation of coefficients in terms of elasticities.
Note that we are proposing to estimate an aggregate function for the labour share, following for example Stockhammer (2009), Kristal (2010), Peralta and Escalonilla (2011), Dünhaupt (2013a), Karanassou and Sala (2013) and Barradas and Lagoa (2017). This approach introduces some limitations into the analysis of our results. On the one hand, it prevents the assessment of the effects of financialisation on the wages of workers from different countries, sectors, industries and/or corporations (taking into account their dimension or ownership). On the other hand, it tends to despise the historical, social and economic circumstances responsible for the evolution of the labour share in each country, because a panel data econometric analysis estimates an average effect of several countries. Here we follow a macroeconomic perspective to assess the role of financialisation in the fall of the labour share in EU countries. Thus, if the four channels of financialisation are found to have a macroeconomic effect, we cannot determine whether it is due to the impact of some countries/sectors/industries/corporations or whether it is more generalised across all of them. If we do not find any macroeconomic effect, we cannot exclude the possibility that they affect a subset of countries/sectors/industries/corporations, which, however, is not enough to create a macroeconomic effect on the labour share.
Accordingly, the lagged labour share, education, general government activity and trade unions are expected to influence the labour share positively, while technological progress, globalisation, financial activity and ‘shareholder value orientation’ are expected to exert a negative influence on the labour share. Output growth could have a positive or a negative influence on the labour share. Thus, the coefficients of these independent variables should have the following signs:
12
Technological progress is expected to exert a negative influence on the labour share, because it has been associated with a reduction in the number of units of labour required by the majority of corporations (Guerriero and Sen, 2012). Indeed, technological progress has become capital augmenting since the beginning of the 1980s, instead of labour augmenting as in the 1960s or 1970s (Stockhammer, 2009; Guerriero and Sen, 2012; and Dünhaupt, 2013b). These authors suggest that the proliferation of information and communication technologies has only favoured high-skilled labour, being a substitute for low-skilled labour. This argument is reinforced by the European Commission (2007), according to which new technologies have substituted low-skilled or unlow-skilled labour and complemented high-low-skilled labour. The result has been an increase in the labour share of high-skilled labour, which has not been sufficient to compensate for the decline in the labour share of low-skilled labour, resulting in a decrease in the labour share as a whole.
Globalisation is also expected to exert a negative effect on the labour share. According to Guerriero and Sen (2012) and Dünhaupt (2013b), this hypothesis rests on Stolper and Samuelson’s (1941) theorem on the Hecksher-Ohlin model, according to which globalisation raises the return on the factor that is relatively abundant (capital and the corresponding profits in the case of northern countries) and lowers the return on the non-abundant factor (labour and the corresponding wages in the case of southern countries). Concurrently, as discussed in the previous section, globalisation also reduces the labour share due to its harmful effect on the power of trade unions.
In addition, the labour share is expected to depend positively on the education level of the respective labour force due to its positive impact on employment and wages (Diwan, 2000; Daudey and García-Peñalosa, 2007; and Guerriero and Sen, 2012). Lin and Tomaskovic-Devey (2013) confirm this relationship by arguing that education levels are related to the workforce’s skills in a context in which a higher (lower) education level indicates that a larger (smaller) proportion of the workforce is skilled (unskilled) and has higher (lower) wages.
Output growth has an undetermined effect on the labour share. A positive effect is expected whenever the labour share is procyclical. Here, the argument is inspired by the relationship between output growth and unemployment following the Phillips curve (Estrada and Valdeolivas, 2012). This indicates that, when the aggregate demand increases (decreases), unemployment tends to decrease (increase), which favours a rise (decline) in employment and wages. A negative effect occurs when the labour share is countercyclical by increasing (decreasing) during recessions (expansions) (Dünhaupt, 2013a and 2013b). Three explanations
13
are provided by Willis and Wroblewski (2007) to justify the countercyclical behaviour of the labour share. Firstly, wages are sluggish; that is, they need some time to adjust, which normally occurs once a year. Secondly, corporations tend to delay employment adjustments due to the costs of firing and hiring workers, which are particularly relevant in times of macroeconomic uncertainty. Thirdly, there is risk sharing between employers (corporations) and employees (workers), because the latter tend not to demand an increase in their wages during expansions in exchange for wage security in recessions.
Finally, as discussed in the previous section, financial activity tends to lower the labour share, because it is smaller than the labour share of the non-financial sector. General government activity has a positive effect on the labour share, taking into account that the general government is a ‘non-profit’ institutional sector that does not generate any capital incomes. The ‘shareholder value orientation’ should constrain the labour share, given the pressures of shareholders to generate short-term profits, which are normally associated with a cut in the labour costs. Trade unions are expected to influence the labour share positively by reflecting the greater bargaining power of workers.
4. DATA AND METHODOLOGY: THE ECONOMETRIC FRAMEWORK
4.1 DATA
With the aim of assessing the relationship between financialisation and the fall in the labour share in EU countries, annual data from 1995 and 2013 were collected for a set of 27 countries (Austria, Belgium, Bulgaria, Cyprus, the Czech Republic, Denmark, Estonia, Finland, France, Germany, Greece, Hungary, Ireland, Italy, Latvia, Lithuania, Luxembourg, the Netherlands, Norway, Poland, Portugal, Romania, Slovakia, Slovenia, Spain, Sweden and the United Kingdom). Due to the lack of available data, Malta was the only EU country that had to be excluded. Table 1 exhibits the sample period, the number of observations and the number of missing values per country.
14
Table 1 – Sample composition
Country Period Observations Missing
Austria 1995-2013 19 0 Belgium 1995-2013 19 0 Bulgaria 1998 / 2000-2012 14 5 Cyprus 1998 / 2000-2013 15 4 Czech Republic 1996-2013 18 1 Denmark 1995-2013 19 0 Estonia 1996-2013 18 1 Finland 1995-2013 19 0 France 1995-2013 19 0 Germany 1995-2013 19 0 Greece 1995-2013 19 0 Hungary 1996-2013 18 1 Ireland 1999-2013 15 4 Italy 1995-2013 19 0 Latvia 2000-2013 14 5 Lithuania 2004-2013 10 9 Luxembourg 2006-2012 7 12 Netherlands 1995-2013 19 0 Norway 1995-2013 19 0 Poland 2002-2013 12 7 Portugal 1995-2013 19 0 Romania 1998 / 2002-2003 / 2006-2008 / 2012 7 12 Slovakia 1996-2013 18 1 Slovenia 1999-2013 15 4 Spain 1999-2013 15 4 Sweden 1995-2013 19 0 United Kingdom 1995-2013 19 0
This is the period and the frequency for which data for all the variables are available, which are appropriate for the study for three reasons. Firstly, financialisation became more preponderant in the 1990s (van der Zwan, 2014). Thus, our sample covers the period when financialisation was more notorious. Secondly, the decline in the labour share started in the 1980s, and therefore it is reasonable to have a sample starting in the mid-1990s (Köhler et al., 2016). Thirdly, the fall in the labour share is a long-term structural phenomenon, and hence annual data are likely to capture the determinants of the labour share better than higher-frequency data.
Accordingly, panel data (or longitudinal data) were constructed, since data were collected for a set of 27 cross-sectional units (N27) observed over time between 1995 and 2013 (
T
19
). However, unbalanced panel data were obtained taking into account that it was not possible to collect data for all the variables for all the years for each country. Our sample has 70 missing values, therefore being composed of a total of 443 observations.15
With regard to the definition of the data and the corresponding sources, we use the adjusted labour share7 as a percentage of the gross domestic product, available in the AMECO database. This variable is quantified as the ratio between the compensation per employee and the gross domestic product at current market prices per employee.
Technological progress is proxied by the annual growth rate of the total factor productivity of the total economy at 2010 market prices, available in the AMECO database.
We use the exports as a percentage of the gross domestic product to measure globalisation, which tends to be related to the degree of openness of a certain country. These two variables were collected from the AMECO database at current prices and in billions of national currency.
The total general government expenditure on education as a percentage of the gross domestic product is used as a proxy for education. This variable was collected from the government finance statistics, available from Eurostat. This is the only education-related variable available for our sample. However, our assumption is that an increase (decrease) in the general government expenditure on education tends to promote an increase (decrease) in the education level of the labour force.
The evolution of output growth is assessed by the annual growth rate of the gross domestic product at 2010 market prices, collected from the AMECO database.
We use the gross value added of the financial sector (activities classified into category K following the second revision of NACE) as a percentage of the gross value added of the total economy. These variables were collected from European national accounts at currency prices and in millions of national currency, available from Eurostat.
The general government activity corresponds to the ratio between the gross value added of the general government and the gross value added of the total economy. These variables were collected from the European sector accounts at current prices and in millions of national currency, available from Eurostat.
The proxy for ‘shareholder value orientation’ used here is the difference between the financial payments (the sum of the interest and the distributed income of corporations in which
7 The choice of the adjusted labour share rather than the labour share by itself allows us to include both
dependent and self-employed workers. Therefore, the adjusted labour share allows us to circumvent the possible bias regarding the problem that the earnings of the self-employed are treated as labour income in certain cases and as capital income in others (Dünhaupt, 2013a).
16
dividends are included8) paid by non-financial corporations and the financial receipts (the sum of the interest and the distributed income of corporations in which dividends are included) received by non-financial corporations as a percentage of the gross value added of non-financial corporations. These variables were collected from the European sector accounts at current prices and in millions of national currency, available from Eurostat.
Finally, we used the traditional variable of the trade union density rate to assess the importance of trade unions. This variable conveys the number of union members who are employees as a percentage of the total number of employees9. This variable was collected from the Labour Force Statistics, available from the OECD database. When not available from the OECD (or when only some observations were available), observations of this variable were completed with data from both the ICTWSS and the International Labour Organization databases.
Table A1 in the Appendix contains the descriptive statistics of the data, and Table 2 presents the corresponding correlations between all the variables. All the correlations are lower than 0.8 in absolute terms, precluding the existence of multicollinearity between our variables (Studenmund, 2005). The only exception is the correlation between technological progress and output growth. Nonetheless, the variance inflation factor (VIF) of each variable is smaller than 5 (Table A2 in the Appendix), which rejects the possibility of multicollinearity between our variables (Studenmund, 2005).
Table 2 – The correlation matrix between variables
LS TP GL ED OG FA GA SO TU LS 1 TP -0.20*** 1 GL -0.19*** -0.03 1 ED 0.27*** -0.10** 0.08* 1 OG -0.27*** 0.84*** 0.06 -0.12** 1 FA 0.13*** -0.18*** 0.66*** -0.02 -0.08* 1 GA 0.03 -0.10** -0.24*** 0.63*** -0.19*** -0.25*** 1 SO -0.25*** -0.09* -0.05 -0.17*** -0.03 0.02*** -0.22*** 1 TU 0.06 0.02 -0.01 0.36*** 0.00 0.01 0.55*** -0.05 1
Note: *** indicates statistical significance at 1% level, ** indicates statistical significance at 5% level and * indicates statistical significance at 10% level
8 The distributed income of corporations includes dividends and withdrawals from the income of
quasi-corporations (the amounts that entrepreneurs withdraw for their own use from the profits earned by the quasi-corporations that belong to them).
9 It should be noted that this variable could underestimate the collective bargaining power of general
workers, because the number of trade union members tends to be lower than the number of workers covered by other collective bargaining agreements (Bassanini and Duval, 2006; and OECD, 2006). In addition, this variable tends to exclude the trade union members who are not in paid employment, for instance the self-employed, unemployed and retired, among others.
17
In addition, note that all the variables that are expected to exert a negative influence on the labour share are negatively correlated with it. The variable of financial activity is the only exception.
4.2 METHODOLOGY
Our labour share equation is estimated using the least-squares dummy variables bias-corrected (LSDVBC)10 estimator, introduced by Nickel (1981), Kiviet (1995) and Bun and Kiviet (2003)11. Bruno (2005a and 2005b) extends this estimator to unbalanced panels. This is the most appropriate estimator to carry out our estimates taking into account that we have a dynamic panel data model (with the inclusion of a lagged dependent variable among the independent variables), an unbalanced panel (with some missing values in our sample) and a macro panel (with a relatively small cross-sectional dimension
N
).Three different reasons can be highlighted to underline the appropriateness of the LSDVBC estimator. Firstly, the traditional panel data estimators (e.g. pooled ordinary least squares, least-squares dummy variables, fixed effects and random effects) are biased and/or inconsistent, because the lagged dependent variable is correlated with fixed effects in the error term (Nickel, 1981; Baltagi, 2005; Cameron and Trivedi, 2009; among others). Secondly, the standard panel data estimators for dynamic panel data models (e.g. Anderson and Hsiao, 1982; Arrelano and Bond, 1991; Arrelano and Bover, 1995; and Blundell and Bond, 1998) are severely biased and imprecise in the case of macro panels in which the cross-sectional dimension
N
is relatively small (Bruno, 2005a and 2005b). Thirdly, Monte Carlo evidence has shown that the LSDVBC outperforms the former estimators in terms of bias and root mean
10 We follow the ‘xtlsdvc’ instruction from the Stata software.
11 It should be noted that we do not perform panel unit root tests assuming the stationarity of our nine variables in levels due to the following three reasons. Firstly, our variables are measured in ratios (in the case of the labour share, globalisation, education, financial activity, general government activity, ‘shareholder value orientation’ and trade unions) and in growth rates (in the case of technological progress and output growth). In these circumstances it is reasonable to assume that these variables are in fact stationary in levels. Secondly, plots of our variables (Figure A1 to Figure A9 in the Appendix) also seem to suggest that they are stationary in levels. Thirdly, the standard panel unit roots tests tend to assume that
T
and therefore they have low power and perform very poorly in the presence of macro panels in which the cross-sectional dimensionN
is higher than the period dimensionT
(Baltagi, 2005; Hlouskova and Wagner, 2006; Cameron and Trivedi, 2009; among others). Thus, in the case of macro panels with a smallT
, the risk of concluding that the whole panel is non-stationary in levels even when the panel has a large proportion of stationary data in levels should not be discarded.18
squared error when in the presence of macro panels (Kiviet, 1995; Judson and Owen, 1999; and Bruno, 2005a and 2005b).
According to Bruno (2005a and 2005), the LSDVBC estimator operates in two different steps. In the first one, it produces consistent estimates by requiring the definition of an initial matrix of starting values that can be performed using three different consistent estimators (Anderson and Hsiao, 1982; Arrelano and Bond, 1991; and Blundell and Bond, 1998). Nevertheless, the option for one of these three different estimators does not affect significantly the estimates produced (Bun and Kiviet, 2001; and Bruno, 2005a and 2005b). In the second one, it corrects the bias by undertaking a set of multiple replications to bootstrap the standard errors.
In the next section, we analyse the results of our estimations for EU countries. Some robustness analyses are also carried out with the aim of assessing whether the results exhibit some sensitivity to other specifications and/or sub-samples. In all the estimations, we use the Arrelano and Bond estimator to initialise the LSDVBC estimator and a number of replications equal to 250. Time dummies are included in all the specifications as well as a WALD test to assess their joint significance.
19
5. EMPIRICAL RESULTS AND DISCUSSION
This section presents the results of our estimates. We start by estimating our baseline labour share equation for all years and all countries by presenting three different specifications. Specification I includes only the control variables to compare with the results obtained by other authors who did not take into account the role of financialisation in the explanation of the labour share. In specification II we incorporate only the variables linked with financialisation. Specification III comprises all the variables. The results are presented in Table 3.
Table 3 – Estimations of the labour share equation
Variable Specification I Specification II Specification III
LSt-1 0.824*** (0.038) [21.43] 0.714*** (0.041) [17.20] 0.753*** (0.39) [19.48] TPt -0.430*** (0.054) [-7.91] -0.418*** (0.056) [-7.45] GLt -0.021** (0.010) [-2.20] -0.018* (0.011) [-1.65] EDt 0.256 (0.168) [1.53] -0.077 (0.195) [-0.39] OGt 0.228*** (0.039) [5.83] 0.227*** (0.041) [5.50] FAt 0.180** (0.092) [1.96] 0.118 (0.083) [1.43] GAt 0.262*** (0.068) [3.86] 0.224*** (0.086) [2.61] SOt -0.050*** (0.019) [-2.63] -0.040** (0.018) [-2.26] TUt -0.026 (0.022) [-1.17] -0.022 (0.022) [-0.98] Observations 383 383 383 Groups (Countries) 27 27 27
Time Effects Yes Yes Yes
P-value Wald Test 0.012** 0.000*** 0.010***
Note: Standard errors in ( ), z-statistics in [], *** indicates statistical significance at 1% level, ** indicates statistical
significance at 5% level and * indicates statistical significance at 10% level. Coefficients, standard errors and z-statistics for the year dummies are not reported
20
In relation to specification I, all the variables are statistically significant at the conventional significance levels with the exception of education. However, education is almost statistically significant and has the expected positive sign, partially confirming its positive impact on the labour share. On the other hand, all the coefficients of the statistically significant variables have the expected signs. In fact, the lagged labour share and output growth exert a positive influence on the labour share, and technological progress and globalisation negatively influences the labour share. These results are corroborated by the literature, namely by confirming that the lagged labour share is a strong determinant of the current labour share (Blanchard and Katz, 1997; Montuenga-Gómez and Ramos-Parreño, 2005; Judzik and Sala, 2013; Karanassou and Sala, 2013; and Köhler et al., 2016) and that the labour share is strongly procyclical in relation to output growth (Estrada and Valdeolivas, 2012; and Barradas and Lagoa, 2017). Our results also confirm the neoclassical hypothesis of skill-biased technological change, the Hecksher-Ohlin model and the Stolper and Samuelson theorem. Overall, we obtain quite similar results to other works that did not take into account the role of financialisation in the fall in the labour share (European Commission, 2007; International Monetary Fund, 2007; Stockhammer, 2009; Judzik and Sala, 2013; Karanassou and Sala, 2013; and Köhler et al., 2016).
With regard to specification II, all the variables are statistically significant at the traditional significance levels with the exception of the trade union density rate. The non-significance of trade unions is also found by Dünhaupt (2013a), which could be explained by the fact that the trade union density underestimates the collective bargaining power of general workers (Bassanini and Duval, 2006; and OECD, 2006). The remaining variables have the expected signs with the exception of financial activity. In fact, financial activity exerts a positive influence on the labour share, which is not in accordance with the literature on financialisation. This suggests that the growth in the financial sector does not have a detrimental impact on the labour share in EU countries. This could be explained by the higher wages of the financial sector vis-à-vis the wages of the other sectors in EU countries, namely the so-called ‘financial sector wage premium’ (Denk, 2015). The general government activity exerts a positive influence on the labour share, which is consistent with the literature on financialisation and the results obtained by Dünhaupt (2013a), Barradas and Lagoa (2017) and Stockhammer. Finally, as expected, the labour share is negatively influenced by the ‘shareholder value orientation’, as in Dünhaupt (2013a) and Alvarez (2015).
Regarding specification III, the results do not change dramatically in comparison with the results of the two previous specifications. The majority of the variables maintain their
21
statistical significance and the same sign, confirming the robustness of our results. The only exceptions are the variables of education and financial activity, which lost their statistical significance definitively. Given that education and financial activity remain relatively stable in our sample (Figure A4 and Figure A6 in the Appendix), their lack of statistical significance is not too surprising.
Now we determine whether the labour share has been affected in the same manner and/or degree in the different EU countries, taking into account the heterogeneity existing between them, specifically in terms of their presence in the euro area (euro area countries and non-euro area countries), their type of financial system (‘market-based’ countries and ‘bank-based’ countries) and their variety/model of capitalism (‘liberal market’ countries, ‘coordinated market’ countries, ‘hybrid/mixed market’ countries and ‘transition’ countries). In all three cases, our sample is divided into sub-samples, which also allow us to confirm the robustness of our results to resampling. These analyses are carried out only for specification III to avoid the problem of omitted variables and therefore increase the consistency of our estimates.
Table 4 exhibits the results of our estimates for the euro area countries and non-euro area countries12. Two important conclusions deserve our attention. Firstly, the results for the euro area countries are quite similar to the results obtained for all the countries in terms of statistical significance and signs. Effectively, the variables that are statistically significant in the case of euro area countries are just the same in the case of all the countries and they have the same influence on the labour share. Secondly, the results for the non-euro area countries also do not change dramatically. On the one hand, globalisation and ‘shareholder value orientation’ lose their statistical significance, albeit maintaining their negative coefficients. On the other hand, financial activity becomes statistically significant, influencing the labour share positively.
12 The euro area countries are composed of Austria (after 1998), Belgium (after 1998), Cyprus (after
2008), Estonia (after 2010), Finland (after 1998), France (after 1998), Germany (after 1998), Greece (after 2000), Ireland (after 1998), Italy (after 1998), Luxembourg (after 1998), the Netherlands (after 1998), Portugal (after 1998), Slovakia (after 2008), Slovenia (after 2016) and Spain (after 1998). The non-euro area countries consist of the remaining years and countries.
22
Table 4 – Estimations of the labour share equation by presence in the euro area
Variable Euro Area Countries Non-Euro Area Countries
LSt-1 0.753*** (0.060) [12.61] 0.764*** (0.067) [11.37] TPt -0.454*** (0.070) [-6.48] -0.414*** (0.099) [-4.18] GLt -0.044** (0.018) [-2.41] -0.010 (0.019) [-0.50] EDt -0.185 (0.291) [-0.64] -0.184 (0.357) [-0.51] OGt 0.281*** (0.061) [4.57] 0.205*** (0.075) [2.73] FAt 0.101 (0.091) [1.11] 0.271* (0.157) [1.72] GAt 0.482*** (0.145) [3.31] 0.276* (0.154) [1.79] SOt -0.040* (0.021) [-1.93] -0.041 (0.036) [-1.15] TUt 0.010 (0.046) [0.22] -0.054 (0.046) [-1.17] Observations 158 199 Groups (Countries) 16 24
Time Effects Yes Yes
P-value Wald Test 0.000*** 0.638
Note: Standard errors in ( ), z-statistics in [], *** indicates statistical significance at 1% level, ** indicates statistical
significance at 5% level and * indicates statistical significance at 10% level. Coefficients, standard errors and z-statistics for the year dummies are not reported
The results of our estimates for ‘market-based’ and ‘bank-based’ countries are presented in Table 513. The results for ‘market-based’ countries show that the lagged labour share is the only statistically significant determinant of the labour share. All the remaining variables are not statistically significant at the conventional significance levels. This should be caused by the relatively small sample that makes up the ‘market-based’ group of countries. The results for ‘bank-based’ countries confirm that the lagged labour share, output growth, financial activity and general government activity exert a positive influence on the labour share, while technological progress and ‘shareholder value orientation’ maintain their negative influence.
13 According to Bijlsman and Zwart (2013) and Haan et al. (2015), the group of ‘market-based’ countries is
constituted by Belgium, Finland, France, the Netherlands, Sweden and the United Kingdom. The remaining countries are characterised as ‘bank-based’ countries.
23
Table 5 – Estimations of the labour share equation by type of financial system
Variable ‘Market-based’ Countries ‘Bank-based’ Countries
LSt-1 0.756*** (0.093) [8.09] 0.721*** (0.049) [14.65] TPt -0.029 (0.191) [-0.15] -0.399*** (0.060) [-6.62] GLt -0.033 (0.028) [-1.16] -0.009 (0.014) [-0.67] EDt 0.039 (0.453) [0.09] -0.117 (0.234) [-0.50] OGt -0.248 (0.157) [-1.58] 0.220*** (0.044) [4.96] FAt -0.079 (0.137) [-0.58] 0.218** (0.105) [2.07] GAt 0.058 (0.297) [0.20] 0.294*** (0.098) [3.01] SOt 0.041 (0.043) [0.96] -0.061*** (0.023) [-2.69] TUt 0.020 (0.046) [0.43] -0.031 (0.028) [-1.12] Observations 102 281 Groups (Countries) 6 21
Time Effects Yes Yes
P-value Wald Test 0.346 0.001***
Note: Standard errors in ( ), z-statistics in [], *** indicates statistical significance at 1% level, ** indicates statistical
significance at 5% level and * indicates statistical significance at 10% level. Coefficients, standard errors and z-statistics for the year dummies are not reported
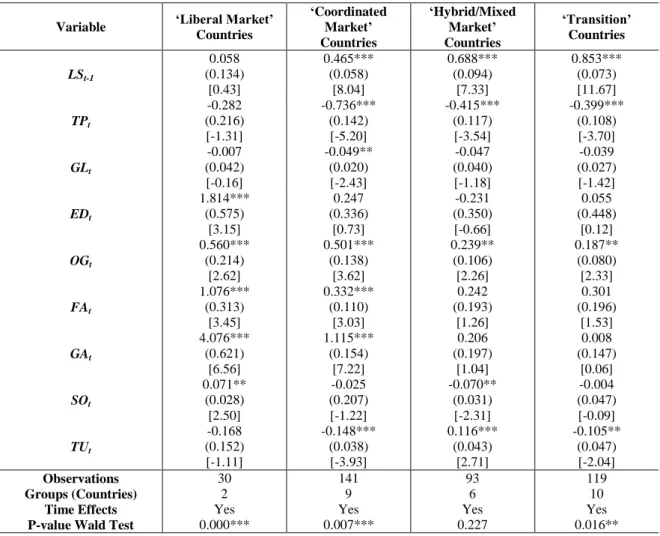
Table 6 contains the results of our estimates for each variety/model of capitalism14. These results should be analysed with caution, because we obtain small samples to make up each group of countries, particularly in the case of ‘liberal market’ countries. With regard to ‘liberal market’ countries, education, output growth, financial activity, general government activity and ‘shareholder value orientation’ are the only variables that are statistically significant, and all of them positively influences the labour share. The most perverse result concerns ‘shareholder
14 The distribution of countries according to their variety/model of capitalism was carried out taking into
account the seminal contribution of Hall and Soskice (2001) and other related works in the field of comparative political economy. Accordingly, Ireland and the United Kingdom belongs to ‘liberal market’ countries; Austria, Belgium, Denmark, Finland, Germany, Luxembourg, the Netherlands, Norway and Sweden belongs to ‘coordinated market’ countries; Cyprus, France, Greece, Italy, Portugal and Spain belongs to ‘hybrid/mixed market’ countries; and Bulgaria, the Czech Republic, Estonia, Hungary, Latvia, Lithuania, Poland, Romania, Slovakia and Slovenia belongs to ‘transition’ countries.
24
value orientation’, because typically this variable tends to exert a negative effect on the labour share. This seems to suggest that a higher level of (net) financial payments (interest and dividends) is associated with an increase in general wages. Two different mechanisms could explain this result. Firstly, non-financial corporations tend to increase their wages when they are in a better economic and financial situation, that is, when they have higher profits, which also determine a higher level of payout ratios. Secondly, non-financial corporations tend to give bonuses (included in wages) based on their profits, indicating that higher profits imply higher wages and higher payout ratios. This is especially relevant in the case of top management, for which variable wages (as a function of profits) are gaining preponderance. As argued by Hein (2012) and Hein and Detzer (2014), this result seems to confirm that the rise in top management wages has in fact delineated an increase in the labour share in these countries. In the case of ‘coordinated market’ countries, the lagged labour share, output growth, financial activity and general government activity maintain their statistical significance and their positive influence on the labour share. Technological progress, globalisation and trade unions are also statistically significant at the conventional significance levels, albeit exerting a negative effect on the labour share. The coefficient of trade unions seems to be quite controversial, notably because unionisation levels are regularly a positive determinant of the labour share (Stockhammer, 2009; Kristal, 2010; Judzik and Sala, 2013; Lin and Tomaskovic-Devey, 2013; Köhler et al., 2016; and Barradas and Lagoa, 2017). This indicates that unionisation levels exert a negative influence on wages in ‘coordinated market’ countries, probably because trade unions have privileged the maintenance and creation of jobs rather than an increase in wages due to the increasingly globalised competitive environment since the 1990s. This is confirmed by Hein and Schulten (2004), who stress that this change in the collective bargaining arrangements occurred at both the corporation and the national level. At the corporation level, these authors highlight the emergence of ‘pacts for employment and competitiveness’ following the principle of ‘concession bargaining’ whereby employees agreed to labour cost reductions (a decrease in wages and/or extension of working time) in exchange for limited job guarantees given by corporations. At the national level, these authors emphasise the materialisation of tripartite social pacts that established a certain 'competitive corporatism' the primary aim of which was to secure a policy of wage moderation to strengthen the national competitiveness. In relation to ‘hybrid/mixed market’ countries, the labour share is negatively influenced by technological progress and ‘shareholder value orientation’ and positively influenced by the lagged labour share, output growth and trade unions. Finally, regarding ‘transition’ countries, only the lagged
25
labour share, technological progress, output growth and trade unions are statistically significant at the traditional significance levels. They exhibit the expected signs with the exception of trade unions, which again become a negative determinant of the labour share, as in the case of ‘coordinated market’ countries. Note that the negative impact of the trade union density on the labour share occurs only in the case of ‘coordinated market’ countries and in the case of ‘transition’ countries. This is because the majority of these countries follow an export-led growth model, which requires by itself a higher level of competitiveness.
Table 6 – Estimations of the labour share equation by variety/model of capitalism
Variable ‘Liberal Market’
Countries ‘Coordinated Market’ Countries ‘Hybrid/Mixed Market’ Countries ‘Transition’ Countries LSt-1 0.058 (0.134) [0.43] 0.465*** (0.058) [8.04] 0.688*** (0.094) [7.33] 0.853*** (0.073) [11.67] TPt -0.282 (0.216) [-1.31] -0.736*** (0.142) [-5.20] -0.415*** (0.117) [-3.54] -0.399*** (0.108) [-3.70] GLt -0.007 (0.042) [-0.16] -0.049** (0.020) [-2.43] -0.047 (0.040) [-1.18] -0.039 (0.027) [-1.42] EDt 1.814*** (0.575) [3.15] 0.247 (0.336) [0.73] -0.231 (0.350) [-0.66] 0.055 (0.448) [0.12] OGt 0.560*** (0.214) [2.62] 0.501*** (0.138) [3.62] 0.239** (0.106) [2.26] 0.187** (0.080) [2.33] FAt 1.076*** (0.313) [3.45] 0.332*** (0.110) [3.03] 0.242 (0.193) [1.26] 0.301 (0.196) [1.53] GAt 4.076*** (0.621) [6.56] 1.115*** (0.154) [7.22] 0.206 (0.197) [1.04] 0.008 (0.147) [0.06] SOt 0.071** (0.028) [2.50] -0.025 (0.207) [-1.22] -0.070** (0.031) [-2.31] -0.004 (0.047) [-0.09] TUt -0.168 (0.152) [-1.11] -0.148*** (0.038) [-3.93] 0.116*** (0.043) [2.71] -0.105** (0.047) [-2.04] Observations 30 141 93 119 Groups (Countries) 2 9 6 10
Time Effects Yes Yes Yes Yes
P-value Wald Test 0.000*** 0.007*** 0.227 0.016**
Note: Standard errors in ( ), z-statistics in [], *** indicates statistical significance at 1% level, ** indicates statistical
significance at 5% level and * indicates statistical significance at 10% level. Coefficients, standard errors and z-statistics for the year dummies are not reported
Finally, we present the economic significance of our statistically significant estimates (McCloskey and Ziliak, 1996; and Ziliak and McCloskey, 2004). This allows us to identify better the role of financialisation (and the other determinants) in the evolution of the labour
26
share in EU countries since 1995. The results are available in Table 7. In the majority of countries, technological progress was the main driver of the labour share, whilst output growth had the worst impact. In fact, the deceleration of technological progress favoured an increase in the labour share of around 174, 210, 149, 149, 168, 164 and 216 per cent in all the countries, euro area countries, non-euro area countries, ‘bank-based’ countries, ‘coordinated market’ countries, ‘hybrid/mixed market’ countries and ‘transition’ countries, respectively. The output slowdown contributed to a decline in the labour share of about 88, 132, 42, 79, 17, 89, 148 and 84 per cent in all the countries, euro area countries, non-euro area countries, ‘bank-based’ countries, ‘liberal market’ countries, ‘coordinated market’ countries, ‘hybrid/mixed market’ countries and ‘transition’ countries, respectively. This is a matter of concern taking into account the fears around the emergence of a new ‘secular stagnation’ in the current era of financialisation. The remaining variables had smaller economic impacts on the labour share, because they exhibited lower growth rates from 1995 to 2013. Note that technological progress and output growth are the two variables that denote the highest growth rates, due to the pronounced drop in the recent crisis. Hence, the increase in the degree of openness (globalisation) was also prejudicial to the labour share. The labour share would have been higher by about 6, 7 and 3 per cent if had there not been a rise in the degree of openness of all the countries, euro area countries and ‘coordinated market’ countries, respectively. The variables linked with financialisation also explained the evolution of the labour share, although their economic effects differed across countries. Considering all the countries as a whole, the decrease in the general government activity contributed to a decline in the labour share of about 3 per cent. This effect did not compensate for the concomitant decline in net financial payments, which only contributed to an increase in the labour share of about 2 per cent. In general terms, the global net effect of financialisation was marginally negative. In euro area countries, the global net effect of financialisation on the labour share was positive. Effectively, the increase in general government activity and the reduction in net financial payments delineated a rise in the labour share of about 14 and 2 per cent, respectively. In non-euro area countries, the global net effect of financialisation was prejudicial, in a context in which the labour share would have been larger by about 11 and 1 per cent without the fall in the financial activity and the general government activity, respectively. In ‘bank-based’ countries, the decrease in financial activity and general government activity were responsible for a fall in the labour share by around 2 and 4 per cent, respectively. These effects were not sufficient to compensate for the rise in the labour share of about 5 per cent caused by the reduction in net financial payments. In ‘liberal