M. Papadrakakis, M. Fragiadakis, V. Plevris (eds.) Corfu, Greece, 26–28 May 2011
MODELLING ISSUES ON SEISMIC ASSESSMENT
OF IRREGULAR RC STRUCTURES
Romain Sousa1, Federica Bianchi1, Rui Pinho2, Roberto Nascimbene1 Danai Kazantzidou3
1 European Centre for Training and Research in Earthquake Engineering (Eucentre)
Via Ferrata 1, 27100 Pavia
[email protected] [email protected] [email protected]
2 Department of Structural Mechanics, University of Pavia
Via Ferrata 1, 27100 Pavia [email protected]
3 ROSE School, IUSS Pavia
c/o Eucentre, Via Ferrata 1, 27100 Pavia [email protected]
Keywords: Nonlinear Analysis, Seismic Assessment, RC Structures
Abstract. Many existing RC structures worldwide were designed for gravity loads only, with
inadequate lateral load resistance, lateral stiffness and poor detailing of the reinforcement. Moreover, the concept of regularity both in plan and elevation that characterise a good con-ceptual design was, in most cases, not taken into account.
The introduction in Europe of the regulations for seismic assessment of existing structures imposed stricter performance requirements for building structures. In order to take into ac-count the poor seismic behaviour of such buildings, recent seismic codes – namely EC8 and NTC08 (Italian code), introduce a number of prescriptions regarding issues such as analysis type, load distribution, accidental eccentricity, etc. At the same time, these codes give room for engineering judgment to be used with reference to the definition of structural and non-structural elements such as slabs or infill walls, and obviously leave it up to the analyst deci-sions regarding Finite Elements typology, meshing, mass modelling, etc.
The main goal of this work is thus to provide an extensive and wide evaluation on the in-fluence of each of the abovementioned parameter on the seismic assessment of structures. For this purpose, nonlinear static procedures, as well as nonlinear dynamic analysis are per-formed on a real building that has also been experimentally tested in the past. The results will hopefully provide indications on the relative importance of each modelling parameter or de-cision.
1 INTRODUCTION
The existing building stock poses a much more serious and complex seismic safety prob-lem when compared to safe earthquake design of new construction. Moreover, the past thirty years have witnessed such a significant increase of knowledge in the field of earthquake engi-neering, that even relatively modern structures may no longer meet the requisites of constant-ly developing regulations.
It has been recognised by the scientific community that force-based approaches for seismic assessment of structures are inappropriate. Instead, assessment methods employing displace-ment-based approaches, where member deformations are evaluated, tend to provide a more suitable estimation of the actual structure capacity. In order to implement this new philosophy and accurately estimate the members deformations, typically evaluated in terms of chord rota-tions, it is required advanced modelling capabilities that allows the structure to go behind the linear range.
Nonlinear dynamic analyses are, at the present time, the most accurate approach to evalu-ate the seismic response of structures. On the other hand, nonlinear static analyses (Pushover) are a simplified approach that allows the evaluation of the structure’s behaviour when sub-jected to an increasing monotonic lateral load. Despite being considered a suitable approach for regular structures, its application on irregular structures has been pointed out as one of the main shortcomings of this type of analysis. Moreover, difficulties inherent to uncertainties in the definition of structural and non-structural elements such as slabs or infill walls, associated with modelling decisions regarding Finite Elements typology, meshing, mass modelling, etc., represents additional drawbacks.
The output of this study will hopefully provide some guidance on critical structural model-ling issues that require urgent attention in order to overcome some uncertainties associated with the assessment of existing reinforced concrete (RC) structures.
2 STRUCTURAL BEHAVIOUR OF IRREGULAR RC STRUCTURES
Recent seismic events such as the 1985 Mexico, the 1994 Northridge, the 1995 Kobe and the 1999 Kocaeli earthquakes induced severe damage to non-ductile RC buildings proving that many constructions located in seismic zones are unable to withstand moderate to severe earthquakes and therefore observe significant damage and contribute to significant loss of lives.
Usually these structures were designed for gravity loads only, neglecting all the basic con-cepts for a good seismic behaviour such as regularity, both in plan and elevation, adequate lateral resistance systems, detailed reinforcement, etc. Because lateral actions were not taken into account in the design process, the columns cross-sections tend to be relatively small with insufficient longitudinal and transversal reinforcement. Very often these structures exhibit al-so a reduction in the columns cross-section over the high of the building. Consequently these elements possess reduced deformation capacity and, very often lead to soft-storey mecha-nisms and deformation shapes characterized by a strong torsional component.
In addition to the properties of the main structural system, there are other structural ele-ments that, despite not being considered as part of the primary earthquake-resistant system, might modify the response of the building when the latter is subjected to lateral loads. For in-stance, infill panels are typically considered as secondary or non-structural elements, present only to provide a physical separation of spaces and insulation and, consequently, without any structural purpose. For this reason, generally they are not considered in the assessment proce-dure.
Nevertheless, in masonry-infilled RC frames, the infills might control the global response and often determine the performance and failure of the frame. Experience from earthquakes suggest that strong infill panels, although non-engineering and non-structural, often provide most of the earthquake resistance and prevent collapse of relatively flexible and weak RC structures [1]. However, very often, infills are not uniformly distributed over the plan and height, forcing the building to behave in an irregular fashion and, in this way, imposing high demands both in terms of forces and deformations, which may lead to local or global collapse of the structure. In this study, infill panels were modelled using the element proposed by Cris-afulli [2].
An additional issue that requires particular attention is the way in which slabs are modelled. Very often ignored in the structural assessment process, the slab may play an important role, especially when associated to irregular buildings - its effect is mainly dependent on the rela-tive in-plan stiffness compared with the stiffness of the vertical elements and its in-plan loca-tion. Typically three different solutions may be employed: no slab, rigid diaphragm, and an intermediate and perhaps more realistic solution, whereby the actual stiffness of the existing slab is considered. This latter solution can be implemented through the use of equivalent crossed trusses or, perhaps an easier and faster solution, by mean of nodal constraints with adjusted penalty functions. It must be pointed out that the aforementioned different assump-tions do not only influence the structures global behaviour, but also at the elements level, as it will be demonstrated herein.
In order to account for uncertainties in the location of masses and in the spatial variation of the seismic motion, seismic codes such as EC8 [3] and NTC08 [4] introduce an “accidental eccentricity”, which imposes an additional torsional effect on the structure, and a number of lateral load distributions for static nonlinear analysis, aimed at reproducing higher mode ef-fects in plan and elevation.
In summary, the importance and impact of the following structural parameters in the as-sessment of RC structures were assessed in the current parametric study:
• Infill panels
• Rigid/deformable slabs • Accidental eccentricity
• Lateral distribution of loads for nonlinear static analysis
3 MODELING OF RC STRUCTURES
Supported on the exponential growth of computational capabilities witnessed in recent years, structural engineers are now able to make use of the on-going scientific developments. Moreover, practitioners are now enforced to keep themselves up to date on modelling devel-opments and code requirements. Focused on this last observation, the present work intends to enlighten some clarification in some modelling issues, which have been proved to be crucial in seismic assessment of existing RC structures.
Nonlinear dynamic analyses are, currently, the most accurate approach to estimate the seismic behaviour of structures. Nevertheless, this advanced procedure requires high compu-tational effort to process the analyses and, at the same time, the output extracted from the software provides information about a single seismic event. Therefore, in order to overcome these drawbacks, nonlinear static analysis, emerges as a simplified approach that allows the estimation of the capacity, defined in terms of base shear and lateral displacements, of struc-tures subjected to increased lateral loads. The basic premise is that monotonic pushover can act as an envelope for the dynamic hysteresis.
In order to simplify the assessment procedure, a common approach consists in concentrat-ing the mass of the structure at the beam-columns joints, rather then distributed along the el-ements. Following this procedure, the time taken to build-up the model as well as the processing phase might be substantially reduced. The employment of distributed mass repre-sents a more suitable and accurate approach that enables the correct characterization of both global and local structural behaviour. On the other hand, according to previous studies, con-centrating the masses at the structural joints is suitable for nonlinear static analysis since the evaluation of the mode shapes and global response of the building is consistent with the choice of distributing the lateral pushover forces in the structural joints [5]. However, because this assumption might lead to incongruences at the element level, a sensitive study making use of both approaches was carried out.
Previously, particular attention was addresses to modelling issues associated to computa-tional performance. Nevertheless, it must be also emphasized that the time consumed during the pre- and post-processing phases may also be important. This way, and supported on the fact that beams damage are concentrated at the element ends for both static and seismic loads, a “simplified beam element”, consisting in one element defined with the beam-end-section through the entire member is evaluated. In this approach, the number of section as well as the number of elements is significantly reduced. Furthermore, the elements chord rotations can be directly obtained from the software without any additional calculations. Obviously, because in this approach the beams may not possess enough reinforcement to resist the positive moments at the mid-span, the use of concentrated mass at the beam-column joints is recommended.
In summary, the following model parameters were selected so that their influence upon the seismic response of existing RC structures is evaluated:
• Comparison between nonlinear static and dynamic analysis • Mass modelling (lumped or distributed)
• Element meshing (“simplified beam element”)
There are many other structural issues, such as soil-structure interaction, beam-column joint behaviour, bar slippage, etc, that need also some clarification. However, due to their complexity and relative importance in practical terms, they were not included in the present parametric study.
4 PARAMETRIC STUDY 4.1 Overview
The structure under analysis in this study is the SPEAR building. The main goal of SPEAR project was contributing to the improvement of current design, assessment and retrofitting technics and the development of new simplified approaches for the seismic assessment and rehabilitation of existing building structures [6]. To enhance the issues brought by plan-irregularity in older structures, the specimen was especially designed so as to represent a typi-cal non-earthquake resistant construction: it is a “strong beam-weak column system”, adding to the drawbacks originating from the plan eccentricity, the problems of poor local detailing, under-designed elements or joints and older construction practice.
The analysis of the structure was carried out with SeismoStruct - Finite Element package capable of predicting the large displacement behaviour of space frames under static or dynam-ic loading, taking into account both geometrdynam-ic nonlinearities and material inelastdynam-icity [7].
Lanese et al [8] demonstrated a good agreement between the results observed in the exper-imental test and the analytical ones (obtained by modelling the building in SeimoStruct). Con-sidering the model proposed by these authors as a starting point, the building was modified in
5
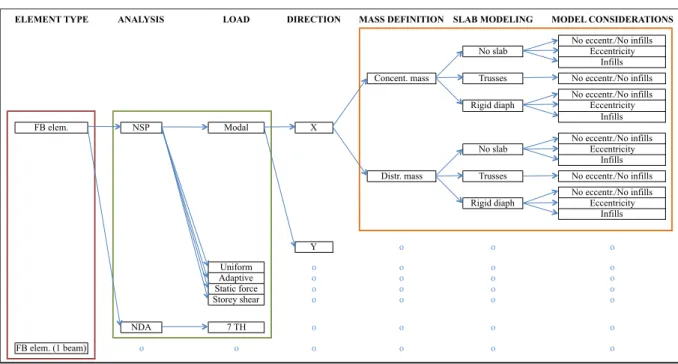
order to assess the importance of parameters mentioned before. An overview of the performed parametric study is presented in the Figure 1.
Figure 1: Parametric study flowchart.
It must be pointed out that the influence of each individual parameter was evaluated inde-pendently from the others. In order to obtain such detailed results, a total of 344 nonlinear static analyses and 224 nonlinear time-history analyses (NLTHAs) were carried out. For the sake of simplicity, only a selection of the representative results will be presented in this paper.
4.2 Building Description
The analysed structure is a three-storeys building, regular in elevation, with a storey height of 3 m. The plan configuration is non-symmetric in X and Y directions (Figure 2), with two-bay frames spanning from 3 to 6 metres.
Almost all columns have a square 250 by 250 mm cross-section; the only one that differes, column C6 in Figure 2, has a cross-section of 250 by 750 mm, which makes it much stiffer and stronger than the others along the Y direction.
The centre of stiffness (CR) (based on column secant-to-yield stiffness) is eccentric with respect to the mass centre (CM) by 1.3 m in the X direction (~13% of plan dimen- sion) and by 1.0 m in the Y direction (~9.5% of plan dimension) [6].
Figure 2: Building properties
ELEMENT TYPE ANALYSIS LOAD DIRECTION MASS DEFINITION SLAB MODELING MODEL CONSIDERATIONS
No eccentr./No infills
No slab Eccentricity
Infills Concent. mass Trusses No eccentr./No infills
No eccentr./No infills Rigid diaph Eccentricity
Infills
FB elem. NSP Modal X
No eccentr./No infills
No slab Eccentricity
Infills Distr. mass Trusses No eccentr./No infills
No eccentr./No infills Rigid diaph Eccentricity
Infills Y o o o Uniform o o o o Adaptive o o o o Static force o o o o Storey shear o o o o NDA 7 TH o o o o FB elem. (1 beam) o o o o o o
SPEAR Workshop – An event to honour the memory of Jean Donea – Ispra, 4-5 April 2005
3000 5000 5500 5000 1700 6000 4000 Y X C1 C2 C4 C5 C3 C7 C8 C9 C6 Columns C1-C5 & C7-C9 Column C6 250x250 4ø12 250x750 10ø12 stirrups ø8@250 stirrups ø8@250
Figure 1. Plan view of the structure with details of column cross-sections (dimensions in [mm])
The application described here is aimed at showing the potentiality of the procedure discussed in the previous section in a realistic situation. The fragility analysis carried out takes into account all the indications of previous research concerning the random factor representing uncertainty due to earthquake loading (Franchin et al. 2003b). Data required for the assessment, both in terms of capacity models and section modelling, are taken from !"# 2003. At the end of this section, a comparison is made with the out-come of the tests as carried out at the ELSA laboratory of the Joint Research Centre in Ispra, Italy (Negro et al. 2004).
3.1 $%&'()"&(*+,(-(.%/%-0+")!*1%)&")2+/'%+-%0,3)0%+
Only a limited number of variables, taking account of the effect of variations in the mechanical parameters on the response, can be introduced as explicit variables for the construction of the response surface. It is therefore convenient to work in the space of basic material properties, as they enable the description of sectional variability with a minimum of variables.!
In this application, the variability in the response is assumed to be essentially influ-enced only by the concrete cylinder peak stress ! and the steel yield stress & ! . These 4
two variables describe the randomness of the material properties for the whole struc-ture, i.e. their spatial variability throughout the structure is not considered.
In order to also account for this spatial variability, additional random-effect vari-ables should be introduced (Franchin et al. 2003a). In this application a simpler ap-proximate approach is adopted, consisting in inflating the variability of the steel yield strength by doubling its coefficient of variation (CoV), to account for variations in the amount of steel present in the section.
Following the recommendations of !"# 2003, the remaining parameters describing the constitutive behaviour of the unconfined and confined concrete on the section level are calculated using well-established relationships relating them directly to ! 5 & ! and 4 other section properties that are here considered as deterministic. A bi-linear steel model is fully determined by its yield strength ! , and deterministic stiffness coeffi-4 cients.
4.3 Analyses Definition
As mentioned above, the structure was subjected to both nonlinear static and dynamic analyses. Regarding the former, the recent Italian code, NTC08 [4], suggests to select two of the five lateral load distributions presented hereafter:
• Distribution proportional to the static forces (triangular)
• Distribution proportional to the first mode of vibration (modal)
• Distribution proportional to the storey shear obtained from a linear dynamic analysis • Uniform distribution
• Adaptive distribution
Note the fact that adaptive pushover, which represents an improvement with respect to conventional pushover, is introduced in this code.
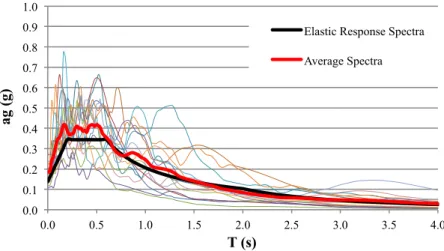
In order to acquire a realistic representation of the structural behaviour during a seismic event and evaluate the performance of simplified approaches such as nonlinear static analysis, 7 real accelerograms (not scaled nor matched) were selected to perform the nonlinear dynamic analysis. The selection was such that the average response spectrums of 14 records (7 acceler-ograms in 2 directions) would follow, in an approximate manner, the response spectrum de-fined for the study (Figure 3).
Figure 3: Individual and average acceleration spectrums selected for dynamic analysis.
The structure was then subjected, simultaneously, to pairs of bidirectional accelerations at the base in each direction (X and Y).
It must be pointed out that high deviation of individual response spectra with respect to the averaged one is difficult to avoid. Thus, high variation over the dynamic response is observed for the different accelerograms. Recall, however, that the main idea is to assess the reliability of different approaches, rather than a capacity/demand seismic compliance of the code re-quirements. The records main properties are presented in the following table:
0.0 0.1 0.2 0.3 0.4 0.5 0.6 0.7 0.8 0.9 1.0 0.0 0.5 1.0 1.5 2.0 2.5 3.0 3.5 4.0 ag (g) T (s)
Elastic Response Spectra Average Spectra
Table 1: Main properties of selected accelerograms.
Finally, in order to make the analysis shorter, each of the records was bracketed to mini-mise the amount of computation required. The bracketed duration was taken to be between 5% and 95% of the total Arias Intensity as recommended by Bommer and Martinez-Pereira [9], and estimated through the software SeismoSignal [10].
4.4 Global Assessment
The first study that was carried out in order to evaluate the building response, when sub-jected to different modelling approaches, intends to estimate its behaviour in a global level. The results obtained through nonlinear static and dynamic analyses are presented in terms of base shear and top displacement. In the following sub-chapters, a more detailed discussion on the observed behaviour for different analysis and different parameters is presented.
4.4.1. Static and dynamic analyses comparison
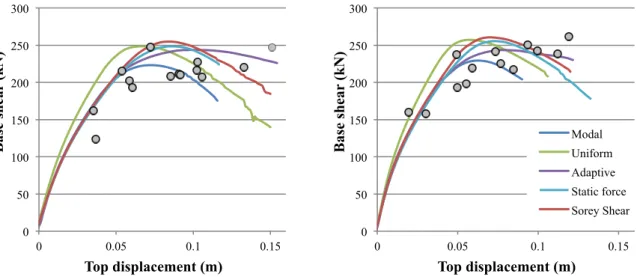
Based on Figure 4, it is possible to verify that nonlinear static analyses can accurately es-timate the global response of the building. In fact, the values obtained from nonlinear dynam-ic analyses fit in almost all cases within the five different pushover curves. Despite the difficulties to identify one pushover curve that would fit better the results obtain through non-linear dynamic analysis, it becomes clear that the capacity curves obtained from adaptive pushover are more capable to capture the real dynamic behaviour, especially in the post-peak branch. It should be also emphasised that the capacity curves ware estimated for each direc-tion independently, whilst in the nonlinear dynamic analysis the base excitadirec-tions were applied in the two directions simultaneously.
Figure 4: Comparison between nonlinear static and dynamic analysis - no slab (left) and equivalent trusses (right).
Waveform ID Earthquake Name Date Mw Fault Mechanism R (km) PGA_X (g) PGA_Y (g) Site class
198 Montenegro 15/04/1979 6.9 thrust 21 0.18 0.22 A
228 Montenegro (aftershock) 24/05/1979 6.2 thrust 33 0.20 0.27 B
291 Campano Lucano 23/11/1980 6.9 normal 16 0.16 0.18 B
439 Spitak 07/12/1988 6.7 thrust 36 0.18 0.18 C
592 Umbria Marche 26/09/1997 6 normal 5 0.20 0.22 C
1228 Izmit 17/08/1999 7.6 strike slip 47 0.24 0.14 A
1314 Ano Liosia 07/09/1999 6 normal 17 0.12 0.11 B
0 50 100 150 200 250 300 0 0.05 0.1 0.15 Bas e s h ear (k N ) Top displacement (m) 0 50 100 150 200 250 300 0 0.05 0.1 0.15 Bas e s h ear (k N ) Top displacement (m) Modal Uniform Adaptive Static force Sorey Shear
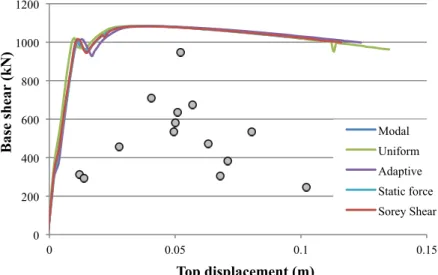
On the other hand, when in presence of infill panels within the external frames, a higher deviation from the two different approaches is identified as demonstrated in Figure 5.
Figure 5: Comparison between nonlinear static and dynamic analysis – model with infill panels.
The main reason for the lower capacity observed during dynamic analyses is the fact that nonlinear static analyses are not able to account for the cyclic degradation both in terms of strength and stiffness of the infill panels. This effect can be clearly observed from the hyster-etic behavior obtained through nonlinear dynamic analysis presented in Figure 6.
Figure 6: Hysteretic behaviour - model with infill panels. 4.4.2. Influence of accidental eccentricity
According to code prescriptions [2, 3] two different eccentricities should be considered in both directions. In fact, the one imposing an “artificial rotation” opposed to the natural defor-mation of the building reduces its torsional component. The results presented in Figure 7 indi-cate that the accidental eccentricity contribution to the global capacity, both in terms of base shear and top displacement, is not significant. Moreover, when the torsional effect is added in
0 200 400 600 800 1000 1200 0 0.05 0.1 0.15 Bas e s h ear (k N ) Top displacement (m) Modal Uniform Adaptive Static force Sorey Shear -500 -400 -300 -200 -100 0 100 200 300 400 500 -0.06 -0.04 -0.02 0 0.02 0.04 0.06 Bas e s h ear (k N ) Top displacement (m)
the opposite direction of the original building eccentricity (Acc. Ecc. 2), the buildings base shear as well as the deformation capacity is, naturally, increased.
Figure 7: Capacity curves obtained with and without accidental eccentricity. 4.4.3. Slab modelling
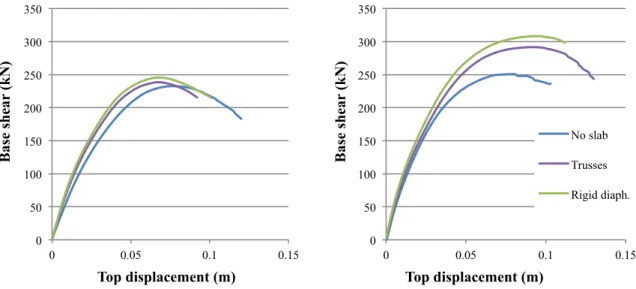
As mentioned above, the presence of an in-plan stiff slab has a major importance especial-ly when significant stiffness variations of the vertical elements are observed. Thus, because in Y direction one column (C6) has a flexural stiffness significantly higher than the others, the base shear increases significantly, contrary to what is observed in X direction (Figure 8). The increase in strength in the model with stiff slab can go up to 20% in comparison with the one with no slab.
Figure 8: Capacity curves with different slab modeling in X (left) and Y (right) direction.
In the same fashion, the presence of infill panels within the RC frames will significantly increase the stiffness of the frames. However, because the panels were placed only at the ex-ternal frames, the response of the building will be mainly controlled by the slab properties, rather than the infills, as illustrated in Figure 9.
0 50 100 150 200 250 300 0 0.02 0.04 0.06 0.08 0.1 0.12 0.14 0.16 Bas e s h ear (k N ) Top displacement (m)
w/o Acc. Ecc. Acc Ecc. 1 Acc Ecc. 2 0 50 100 150 200 250 300 350 0 0.05 0.1 0.15 Bas e s h ear (k N ) Top displacement (m) 0 50 100 150 200 250 300 350 0 0.05 0.1 0.15 Bas e s h ear (k N ) Top displacement (m) No slab Trusses Rigid diaph.
Figure 9: Capacity curves considering infilled structure with and without in-plan stiff slab.
The reason behind this peculiar behavior is the fact that without an in-plan stiff slab, the inner frame is free to deform independently from the edge ones, whilst in presence of a stiff slab the edge frames “attract” more loads and, consequently, change the overall response of the structure.
4.4.4. Mass modelling
Since no remarkable differences were observed between the different load distributions, in order to present the results in a clearer manner, only the results obtained for the main distribu-tions (modal, uniform and adaptive) are going to be presented.
Lookong at the results presented in Figure 10, the definition of the mass as concentrated (darker color) yields slightly lower values of base shear when compared with the model with distributed mass (light color). These conservative results are, however, more noticeable in adaptive and modal distributions. This fact indicates that the results obtained with different mass approaches are affected, mainly due to variations in the modal properties of the struc-tures, rather than different lateral load distribution.
Figure 10: Capacity curves considering concentrated mass (darker color) and distributed mass (lighter color) for three different load distributions.
0 200 400 600 800 1000 1200 0 0.05 0.1 0.15 Bas e s h ear (k N ) Top displacement (m) No infills Infills / no slab Infills / rigid diaph
0 50 100 150 200 250 300 0 0.05 0.1 0.15 Bas e s h ear (k N ) Top displacement (m) Modal Uniform Adaptive
4.4.5. Elements meshing
Finally, the behaviour of the structure considering the simplified beam-element is evaluat-ed. Note that, as explained in Chapter 3, this comparison is made between models with con-centrated mass in order to provide consistent results. It seems clear, according to Figure 11, that implementing simplified beams has negligible influence in the global capacity of the building. This indicates, as expected, that the beams seismic response of the beams is gov-erned by the end-section properties.
Figure 11: Capacity curves considering real beam sections (darker color) and simplified beam section (lighter color) for three different load distributions.
4.5 Local Assessment
In the previous section, the performance of the building was assessed in a global level, comparing the results obtained by both nonlinear static and dynamic analyses. In this chapter, the building performance is evaluated at the element level, and more specifically in terms of elements chord rotations. For this purpose, the performance point (PP) estimated for each of the three Limit States (LS) prescribed by EC8 (Damage Limitation (DL), Significant Damage (SD), Near Collapse (NC)) is evaluated for each capacity curve. The nonlinear static proce-dure (NSP) employed for this purpose was the N2 method [11], also recommended by EC8.
Because the main goal of this work is to assess the influence of different parameters and provide recommendations on how the modification in some structural and modelling aspects will affect the response of the structures, the results are presented not in terms of code com-pliance (capacity verification) but, instead, through a direct comparison between the chord rotations obtained from different models.
Thus, for each PP, the chord rotations for both beams and columns were evaluated and plotted as a fraction between the parameters that are being evaluated. The results close to unit indicate that no significant differences were observed between different approaches. In the following paragraphs, the results plotted from left to right, as the elements are located from the bottom to the top of the building. For simplicity, only representative plots are presented.
4.5.1. Influence of accidental eccentricity (θoriginl / θw/acc. ecc.)
The results observed in terms of chord rotation are in line with the ones observed at the global level, indicating that no significant differences are observed when accidental
eccen-0 50 100 150 200 250 300 0 0.05 0.1 0.15 Bas e s h ear (k N ) Top displacement (m) Modal Uniform Adaptive
tricity is considered. Further analyses on different structures should be performed in order to evaluate the need of considering this additional eccentricity.
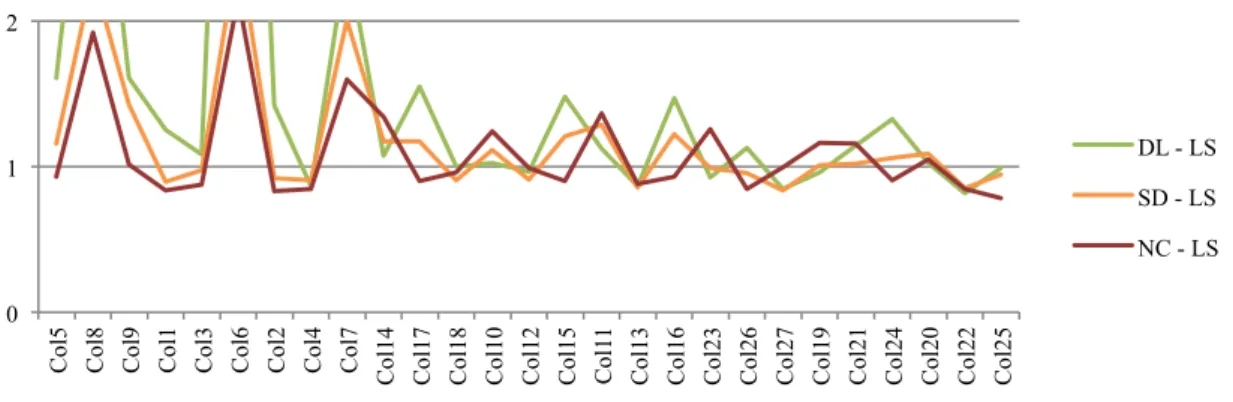
Figure 12: Beam and columns chord rotations with and without accidental eccentricity. 4.5.2. Slab modelling (θrig. diaph / θno slab)
The introduction of an in-plan stiffness slab will provide an additional axial compression force in the beam increasing, this way, its deformation capacity. At the same time, as the beams stiffness was “artificially” increased, the columns are thus forced to deform more in comparison with the configuration without slab. In this particular case, this effect is more evi-dent at the first storey because the building exhibits a soft-storey mechanism at the ground floor. 0 1 2 DL - LS SD - LS NC - LS 0 1 2 Col 5 Col 8 Col 9 Col 1 Col 3 Col 6 Col 2 Col 4 Col 7 Col 14 Col 17 Col 18 Col 10 Col 12 Col 15 Col 11 Col 13 Col 16 Col 23 Col 26 Col 27 Col 19 Col 21 Col 24 Col 20 Col 22 Col 25 DL - LS SD - LS NC - LS 0 1 2 DL - LS SD - LS NC - LS
Figure 13: Beam and columns chord rotations with rigid diaphragm and without slab. 4.5.3. Mass modelling (θconcentrated / θdistributed)
The major consequence of concentrating the mass at the beam-column joints is that no gravity moments will develop along the beams. Consequently, as seismic loads impose mo-ments of opposite signs the both beam-ends, the deformations will also be different at each edge. Therefor, lower values of chord rotations are expected at the beam-end that has different moments signs in static and seismic load. On the other hand, in the opposite end, the results might be conspicuously non-conservative, especially in longer beams, where higher gravity moments are developed. Despite it is not possible to identify a clear trend in the columns re-sults, it seams clear that for higher seismic intensity (NC-LS) the differences becomes less significant, indicating that, as the seismic moments are getting more relevant with respect to static ones, the outcoming variation decreases.
0 1 2 Col 5 Col 8 Col 9 Col 1 Col 3 Col 6 Col 2 Col 4 Col 7 Col 14 Col 17 Col 18 Col 10 Col 12 Col 15 Col 11 Col 13 Col 16 Col 23 Col 26 Col 27 Col 19 Col 21 Col 24 Col 20 Col 22 Col 25 DL - LS SD - LS NC - LS 0 1 2 DL - LS SD - LS NC - LS 0 1 2 DL - LS SD - LS NC - LS
Figure 14: Beam and columns chord rotations with concentrated and distributed mass. 4.5.4. Elements meshing (θsimp. beam / θreal beam)
Finally, the substitution of the real beams with simplified elements with the same section throughout the entire element was evaluated. The results reveal show that no differences are observed between the two approaches. This means that, in general, no loss of accuracy is ob-served in terms of elements chord rotations. The only exceptions, represented as spike in Fig-ure 15, are corresponding to indirectly supported beams, in which the absence of bottom reinforcement induces a significant change in the members’ deformation capacity. Therefor this approach is not suitable for cases where indirect beam supports need to be modelled.
Figure 15: Beam and columns chord rotations with real beam sections and simplified beam section. 5 CONCLUSIONS
Based on the results presented in this work, the following conclusions can be made:
0 1 2 Col 5 Col 8 Col 9 Col 1 Col 3 Col 6 Col 2 Col 4 Col 7 Col 14 Col 17 Col 18 Col 10 Col 12 Col 15 Col 11 Col 13 Col 16 Col 23 Col 26 Col 27 Col 19 Col 21 Col 24 Col 20 Col 22 Col 25 DL - LS SD - LS NC - LS 0 1 2 DL - LS SD - LS NC - LS 0 1 2 Col 5 Col 8 Col 9 Col 1 Col 3 Col 6 Col 2 Col 4 Col 7 Col 14 Col 17 Col 18 Col 10 Col 12 Col 15 Col 11 Col 13 Col 16 Col 23 Col 26 Col 27 Col 19 Col 21 Col 24 Col 20 Col 22 Col 25 DL - LS SD - LS NC - LS
• The results extracted during this study indicate that nonlinear static analyses are able to accurately predict the behaviour of the buildings, even considering in-plan irregular structures.
• Between the five different load distributions used in pushover analyses, no significant differences were observed. Typically, the results obtained with adaptive distribution lie between the traditional extreme ones (modal and uniform) and seem to reproduce better the structural behaviour, especially in the post-peak branch.
• The consideration of an accidental eccentricity in the assessment of existing buildings, as prescribed by EC8, appears to have residual influence in the results obtained in both global and local analyses.
• Special attention should be addressed in the modelling of the structures slab. The results clearly indicate that both global and local behaviour of the building can be controlled by this parameter, especially because it might impose an artificial strengthening of the beams.
• The presence of infill panels significantly transforms the response of the building. The presence of these elements greatly increases the initial stiffness and strength of the struc-ture and might attract higher seismic loads. Because infill panels loose most of its capaci-ty after the first cycles, in order to properly capture behaviour of infilled RC structures, nonlinear dynamic analysis, rather than nonlinear static analysis should be performed in order to take into account the cyclic effects on the infill panels. Additional studies should be addressed to this topic.
• Especially when long beams are modelled, the consideration of an equivalent concentrat-ed mass at the beam-column joints might overestimate the capacity of the elements. This issue might be bypassed if the equivalent point forces/moments obtained from gravity load are computed and applied at the joints before performing the seismic analysis. How-ever, if this procedure is followed, the advantage (time consuming) of employing this simplification is lost.
• Finally, it was demonstrated that, in general, beams could be modelled as one equivalent element with the same section over its length. Nevertheless, this approximation is valid only if concentrated mass is implemented. Thus, because the latter approach may provide unrealistic results, the use of an equivalent beam element is not recommended.
REFERENCES
[1] T. Panagiotakos, M. Fardis, Seimic response of infilled RC frames structures, Eleventh
World Conference on Earthquake Engineering, Acapulco, Mexico, June 23-28 1996.
[2] F.J. Crisafulli, Seismic Behaviour of Reinforced Concrete Structures with Masonry
In-fills, PhD Thesis, University of Canterbury, New Zealand, [1997].
[3] CEN (2004), Eurocode 8: Design of structures for earthquake resistance. Part 1:
gen-eral rules, seismic actions and rules for buildings. EN 1998-1:2004 Comité Européen
de Normalisation, Brussels, Belgium.
[4] Decreto Ministeriale 14/01/2008, NTC – 08 Norme Tecniche per le Costruzioni (in Ital-ian)
[5] V. Mpampatsikos, A critical review of the RC frame existing building assessment
pro-cedure according to Eurocode 8 and Italian seismic code, MSc Thesis, Rose School,
Pavia, Italy, 2008.
[6] E. Mola, P. Negro, Full scale PsD testing of the torsionally unbalanced SPEAR
struc-ture in the ‘as-built’ and retrofitted configurations, Proceeding of the International
Workshop, Ispra, 4-5 April 2005.
[7] SeismoSoft, SeismoStruct - A Computer Program for Static and Dynamic Nonlinear
Analysis of Framed Structures, Available from URL: www.seismosoft.com.
[8] I. Lanese, R. Nascimbene, A. Pavese, R. Pinho, Numerical simulations of an infilled 3D
frame in support of a shaking-table testing campaign, Proceedings of the RELUIS
Con-ference on Assessment and Mitigation of Seismic Vulnerability of Existing Reinforced Concrete Structures, Rome, Italy, 2008.
[9] J.J. Bommer, A. Martinez-Pereira, The effective duration of earthquake strong motion, Journal of Earthquake Engineering, Vol. 3, No. 2, 127–172, 1999.
[10] SeismoSoft, Seismosignal - A computer program for derivation of elastic and costant
ductility inelastic response spectra, Available from URL: www.seismosoft.com.
[11] P. Fajfar, M, Fischinger, N2 – A method for non-linear seismic analysis of regular
buildings, Proc., 9th World Conference on Earthquake Engineering, Tokyo, Kyoto,