outubro de 2013
Rosa Mariana Macedo Tinoco da Silva
Judging Time-to-Passage of looming sounds
Universidade do Minho
Dissertação de Mestrado
Mestrado Integrado em Psicologia
Área de Especialização em Psicologia Clínica e da Saúde
Trabalho efetuado sob orientação do
Professor Doutor Jorge A. Santos
e do
Professor Doutor Yann Coello
outubro de 2013
Rosa Mariana Macedo Tinoco da Silva
Judging Time-to-Passage of looming sounds
Universidade do Minho
DECLARAÇÃO
Nome: Rosa Mariana Macedo Tinoco da Silva
Endereço eletrónico: mariana.macedo.silva@gmail.com
Número do Bilhete de Identidade: 13796851
Título da tese: Judging Time-to-Passage of looming sounds
Orientadoras: Professor Doutor Jorge A. Santos; Professor Doutor Yann Coello Ano de conclusão: 2012/2013
Designação do Mestrado: Mestrado Integrado em Psicologia, Área de Especialização em Psicologia Clínica e da Saúde
É AUTORIZADA A REPRODUÇÃO INTEGRAL DESTA DISSERTAÇÃO
APENAS PARA EFEITOS DE INVESTIGAÇÃO, MEDIANTE
DECLARAÇÃO ESCRITA DO INTERESSADO, QUE A TAL SE COMPROMETE;
Universidade do Minho, 18/10/2013
II Table of Contents
1. Introduction ... 7
2. Estimation of auditory Time-To-Passage ... 10
2.1. Pre-test 1 ... 10
2.1.1. Purpose of the study ... 10
2.1.2. Participants ... 11
2.1.3. Stimuli and materials ... 11
2.1.4. Procedure ... 12
2.1.5. Analysis ... 12
2.1.6. Results and discussion ... 13
2.2. Experiment 1 ... 14
2.2.1. Purpose of the study ... 14
2.2.2. Participants ... 14
2.2.3. Stimuli and materials ... 14
2.2.4. Analysis ... 15
2.2.5. Procedure ... 15
2.2.6. Results and discussion ... 15
3. Estimation of auditory Time-To-Passage with occlusion... 18
3.1. Control study – Discrete auditory localization task ... 18
3.1.1. Purpose of the study ... 18
3.1.2. Participants ... 18
3.1.3. Stimuli and materials ... 18
3.1.4. Procedure ... 19
3.1.5. Results and discussion ... 19
3.2. Pre-test 2 – Modality of the temporal marker ... 21
3.2.1. Purpose of the study ... 21
3.2.2. Participants ... 21
3.2.3. Stimuli and materials ... 21
3.2.4. Procedure ... 22
3.2.5. Results and discussion ... 22
III
3.3.1. Purpose of the study ... 23
3.3.2. Participants ... 23
3.3.3. Stimuli and materials ... 24
3.3.4. Analysis ... 25
3.3.5. Procedure ... 25
3.3.6. Results and discussion ... 26
4. General Discussion ... 30
5. Conclusion ... 32
IV Agradecimentos
Esta tese de mestrado resulta da colaboração de toda a equipa do Laboratório de Visualização e Percepção. Como tal, gostaría de agradecer a todos os que dele fazem parte.
Em primeiro lugar, gostaria de agradecer aos meus orientadores. Ao Professor Jorge A. Santos, pelo impacto que teve na minha inserção no mundo da investigação, por ter fomentado a discussão e reflexão do trabalho e ter propiciado que tudo se pudesse realizar.
To Professor Yann Coello, that accepted me in URECA lab in Lille 3, I have to thank the given opportunity. I take the chance not only to mention the inspirational scientific discussions, but also to say that I felt very welcoming during my stay in Lille.
À Sandra, um especial agradecimento por todos os ensinamentos, pela paciência e pelo encorajamento que meu deu ao longo deste trabalho. O teu acompanhamento fez-me crescer um pouco mais no mundo da investigação.
Aos meus colegas, não só pela participação que tiveram neste trabalho, mas também pelas viagens entre Braga e Guimarães no carro do soninho, que tornam um dia de trabalho muito mais agradável. À Lili, João e Carlos, obrigada pelos vossos “radares”.
Aos meus participantes, que voluntariamente passaram muito tempo às escuras.
Aos meus amigos, Nocas, Guida, Júlia, Marcelo e Nuno, companheiros do curso e companheiros para a vida, a importância da vossa presença foi inquestionável durante todo este percurso. É um prazer acompanhar-vos. A todos os outros que tornam os almoços em conjunto muito mais apetecíveis.
À minha família, com especial ênfase aos meus pais e irmão, por toda a paciência e pela compreensão da minha ausência, obrigada por acreditarem em mim.
V Mestrado Integrado em Psicologia da Universidade do Minho
Área de especialização em Psicologia Clínica e da Saúde Julgar Tempo-de-Passagem de sons em aproximação
Rosa Mariana Silva Jorge A. Santos
Yann Coello
A interação humana diária envolve um grande número de capacidades percetivas. Por exemplo, a estimativa de tempo até um objecto contatar ou passar por nós é informação essencial para iniciar e realizar uma ação ou para evitar um objeto. Estudos anteriores demonstraram que os participantes tendem a antecipar o tempo de passagem de estímulos em aproximação (Mouta, Santos, & López-Moliner, 2012; Neuhoff, 2001). Contudo, pouco se sabe acerca do tempo de passagem de estímulos auditivos. Neste estudo testámos o desempenho dos participantes em duas experiências principais. Primeiramente, examinamos se os participantes são capazes de julgar se sons em aproximação passam pelo plano do ouvido ou não. Em segundo lugar, queríamos avaliar se era possível estimar passagem de um som que não é interamente apresentado. Resultados demonstram que os participantes mantêm o mesmo nível de desempenho, para além da quantidade de informação disponível. A exigência da tarefa leva a uma mudança da estratégia usada, que previne a deterioração do desempenho.
VI Integrated Master in Psychology of University of Minho
Specialty of Clinical and Health Psychology Judging Time-to-Passage of looming sounds
Rosa Mariana Silva Jorge A. Santos
Yann Coello
Daily human interactions involve a great deal of perceptual abilities. For instance, estimation of the time remaining for an object to contact or pass us is essential information to initiate and perform an action or avoid an object. Previous studies have already demonstrated that participants tend to anticipate the time of passage of approaching stimuli (Mouta et al., 2012; Neuhoff, 2001). However, little is known about time to passage of auditory stimuli. In this study we tested participants’ performance in two major tasks. Firstly, we examined if participants were able to judge whether looming sounds passed by their ear plane or not. Secondly, we wanted to evaluate if it is possible to estimate passage of a sound that was not entirely presented. Our findings show that participants maintained the same level of performance, despite the amount of information available. The requirements of the task lead to a change of the perceptual strategy used, which prevented the deterioration of performance.
7 1. Introduction
In everyday life, our perception and interaction with the surrounding environment are temporally influenced by the sensorial system. For instance, when perceiving cars getting closer on a busy road, we usually make judgments of how long it would take for the vehicles to pass us, and when it would be safe to cross the street (e.g. Winer, 1980 in Rosenblum, Wuestefeld, & Saldana, 1993). Athletes also have to perform temporal estimations, for instance: considering a ball’s trajectory, they must decide when to start moving in order to catch it or step aside to avoid it.
Most looming studies have been centered in the visual modality (López-Moliner, Brenner, & Smeets, 2007; Mouta et al., 2012), and subsequently the body of literature in the acoustic modality is scarce (Rosenblum et al., 1993; Schiff & Oldak, 1990). Neuhoff (1998) studied the perception of auditory stimuli with rising and falling intensities, reporting that sounds increasing in intensity are usually perceived as louder than they physically are. Interestingly, this perceptual bias only occurs for stimuli increasing in loudness, not for the opposite. Furthermore, this phenomenon is stronger for higher intensity sounds, suggesting that this could be more evident when the sound is perceived as closer to the observer (Neuhoff, 1998, 2001; Teghtsoonian, Teghtsoonian, & Canévet, 2005). This phenomenon of overestimation of looming sounds has been studied in a wide range of tasks, from discrete measures of loudness change (Neuhoff, 2001) and the amount of dynamic change (Teghtsoonian et al., 2005) to Time-to-Arrival (TTA) (Rosenblum et al., 1993). In the acoustic community, the term overestimation is used when a stimulus rising in intensity is perceived as changing more in loudness than a compared stimulus.
This phenomenon could be interpreted not as an error the subject made but, according to the psychoacoustic ecological perspective, as an adaptive response given in order to ensure a safety time margin to act (Poper, & Fay, 1997 in Neuhoff, 2001). Regardless of why, the auditory system does not seem to provide exact estimates of the sound’s loudness or location, but rather information that could improve the subjects’ survival chances. This could be viewed as an auditory warning mechanism that prepares and gives the listener time to act (Guski, 1992).
It should be noted that in these studies, intensity magnitude of the auditory stimuli was the main variable manipulated, mostly because it is regarded as the dominant variable
8 for perceiving motion in acoustic signals (Bach, Neuhoff, Perrig, & Seifritz, 2009). Several studies have shown that increased intensity is the most prominent cue for perceiving an approaching sound source (Rosenblum, Carello, & Pastore, 1987 in Bach
et al., 2009; Schaw, McGowan, & Turvey, 1991 in Guski, 1992). Notwithstanding,
time-varying variables, such as position, velocity, and other temporal variables are also important for a more reliable representation and detection of auditory motion. This empirical evidence corroborates what Gibson (1966) termed high order variables and their contribution to the modeling of the environment (Jenison, 1997).
Looming sounds have also been studied within temporal estimation tasks, although in a lesser extent than visual looming. Essentially, these studies are concerned with knowing whether participants are able to anticipate the moment of contact or collision of the object moving towards them, given the information included in the stimulus. The time-to-contact or Time-to-collision (TTC) theory was adapted from Lee (1976) concept of optical tau. The tau (Ƭ) was first conceptualized as a function of the simplest form of visual information available in the environment that is important for the subject to start a behavior of collision avoidance, like a driver starting to brake if a certain object is moving towards him (Jenison, 1997; Lee, 1976). This hypothesis aimed to explain how observers could extract the TTC information from moving object(s) and how this would be relevant for estimating contact and engaging in avoidant behavior. In his practical example, a driver could extract the tau from the dilatation of the retinal image of the approaching car, since it informs us about its spatial proximity and velocity. The relation between these variables could designate the tau as the inverse of the rate of expansion. If the observer computes these variables correctly, he will be able to temporally estimate the moment to start braking in order to avoid a collision. However, it has been shown that observers may not always use the tau in TTC tasks, but rather other variable combinations (DeLucia, Kaiser, Bush, Meyer, & Sweet, 2003; López-Moliner & Bonnet, 2002; Wann, 1996 in Mouta et al., 2012; Tresilian, 1999). This could be related with the instruction given in the experiment. For instance, for TTC judgments, participants are usually instructed to answer when they estimate that the stimulus contacts their front, whereas in Time-to-Passage (TTP) they are asked to judge if the stimulus has passed by a plane defined by the subject. In this line, as TTC is related to the rate of expansion in vision studies, TTP is more straightforwardly linked to variables extracted from binocular vision and angular velocity (Bootsma & Craig, 2002; Lee, Georgopoulos, Clark, Craig, & Port, 2001 in Mouta et al., 2012; Regan, 2002).
9 Schiff and Oldak (1990) were the first to adjust Ƭ to the auditory modality, and to psychophysically test the acoustic tau (Ƭa). These authors aimed to investigate if listeners could estimate passage regarding looming sounds. Stimuli presentation was interrupted from 1.5 to 6.5 seconds (occlusion period). Subjects were instructed to press a key when they estimated the sound source would reach them, thus judging TTA. These authors demonstrated that sighted listeners could perform the audio TTA task, although overestimating the sounds’ proximity 40 to 77% of the times (Schiff, & Oldak, 1992 in Guski, 1992). Interestingly, blind participants were as accurate estimating TTA with acoustic stimuli as sighted participants were with visual information (Schiff & Oldak, 1990). In the same research line, Rosenblum et al. (1993) wanted to investigate the amount of information that listeners needed in order to accurately estimate the looming sounds’ arrival. They were interested in the duration of the occluded period, the duration of the audio signal, and whether hearing the passage would improve performance. Participants were instructed to indicate when a recording of a car sound would reach them, assuming that it remained at constant speed. Results indicated that participants underestimated TTA in 84% of trials, meaning that they judged the sound as arriving sooner than it actually did. Additionally, the longer the occluded period was, the greater the amount of underestimations. Furthermore, hearing the time of passage did not seem to have an effect on accuracy. In conclusion, it appears that participants judge arrival with an anticipatory tendency, which does not differ from previous studies in the visual modality (see McLeod & Ross, 1987).
Guski (1992) compared the Ƭ functions of vision and hearing regarding the information needed for the computation of the acoustic tau. The tau is conceptualized as the relation between traveled distance and velocity. Although in vision this could be related to the rate of expansion, the closest approach in hearing could be the rate of intensity or loudness growth (Shaw, McGowan, & Turvey, 1991). However, as mentioned above, the rate of intensity growth seems an incomplete way of perceiving TTC, since participants may be judging absolute loudness to determine the source’s position. In this sense, as a way of preventing subjects from estimating distance instead of TTC, another variable is needed to more reliably estimate the temporal moment of contact. As Guski (1992) mentions, in an everyday life situation, subjects do not rely solely on one sensory modality, but on all they can use for the specified situation. In accordance, Schiff and Oldak (1990) showed that, performance-wise, there seems to be no advantage in estimating arrival of auditory stimuli in comparison with the visual modality. However,
10 the simple reaction times for auditory information are usually lower than for visual. Despite the fact that hearing does not bring benefits to the estimation of contact, it seems that the auditory system is prepared for an early action behavior. Indeed, a clear answer is still needed to the question of whether precise estimations of TTC are necessary when the main issue is to move away or to intercept an object.
From the above introduction we can see that detection of a moving sound source, its perception of approach towards the observer, as well as the time estimate for that source to arrive to the observer have been addressed in previous studies. In this sense, the aim of this study is to understand how listeners perceive passage of looming sounds. Our first goal is to understand whether participants are able to judge the passage of an approaching sound source. Based on the tau literature on audiovisual studies and auditory TTA, we assume that participants should be able to judge passage, even though an anticipation of passage is expected, in congruence with the overestimation loudness change of looming sounds (Neuhoff, 1998, 2001) and the anticipation of arrival time (Rosenblum et al., 1993). If we achieve consistent TTP judgments, we intend to investigate if participants are able to estimate passage when the stimulus is not completely presented, by inserting an occlusion period. We expect to find a deterioration pattern on performance as the occlusion period increases. We are also interested in understanding what the most relevant variables for estimation of passage of looming sounds are.
2. Estimation of auditory Time-To-Passage 2.1. Pre-test 1
2.1.1. Purpose of the study
This experiment aims to explore if participants are able to accurately estimate passage of an approaching object in a fronto-parallel plane. Several studies have been conducted with visual stimuli (López-Moliner et al., 2007; Mouta et al., 2012), but none reported the use of auditory stimuli within a TTP task. In this pre-test we intend to verify if people rely on acoustic information to perceive passage of objects or even other people. The term overestimation of looming sounds has been mainly used for intensity change. In this study we will refer to this phenomenon as an anticipation of passage.
11
2.1.2. Participants
Four participants (one male and three females, one of whom left-handed) between 22 and 29 years old (Mean = 25.75, SD = 2.87), with normal hearing took part in the experiment. Only one was familiarized with this type of task. All participants gave informed consent to take part in this experiment.
2.1.3. Stimuli and materials
The stimulus consisted of a binaural white noise (frequency rate = 44,1 KHz; intensity from 77 to 89 dB) processed in free-field that allowed a good representation of the perceived sound, given the stimulus’ trajectory and the participant’s position. White noise is a type of noise with a randomized signal over time with constant power along the spectrum. Accordingly, this wave holds all frequencies in the spectrum at equal amplitude. For these reasons, the broadband sound wave is considered to be the most parsimonious form of presentation, since it is not possible for the observer to relate it to a familiar frequency, amplitude or pitch, or even to identify a repetition of a pattern or cycle. Stimuli were generated in Matlab® using the MIT HRTF (head related transfer function) database (http://sound.media.mit.edu/resources/KEMAR.html). HRTF is a filter applied to the anechoic sound that represents its transformation from the source position until it reaches the eardrum. HRTF takes into account the acoustic filtering of the head, torso and pinnae structures, which makes it possible to simulate a sound coming from a known position in space without compromising its related features. This database has a full set of recordings of Impulse Responses (IR) – responses obtained at a fixed position emitted from a static loudspeaker - in a wide range of azimuth and elevation coordinates in an anechoic chamber. More specifically, an impulse sound that directly arrives from the source position was recorded in both ears to obtain this HRTF. We divide it in several portions along the trajectory and convolve it with the corresponding HRTF for each position, obtaining a dynamic sound. This convolution of the HRTF with white-noise maintains the Interaural-time-delay (ITD), temporally updated in order to correspond to a new spatial location (Cheng & Wakefield, 1999) and Interaural-level-difference (ILD). The distance at which the sound is presented to the observer is also an important matter. As reported in the literature, there seems to be an effect of the sound source’s distance in binaural cues, affecting therefore the spatial position at which that sound source is perceived. For farther distances there seems to be no deformation of these cues, although as the sound source approaches the participant, mainly below 1m, there
12 appears to occur a distortion of the ILD for the corresponding spatial position (Huopaniemi & Riederer, 1998).
Stimuli were generated at 0° elevation, allowing the observer to perceive the sound at their height (defined by the projection’s configuration). The trajectory was orthogonally disposed 0.40m from participants’ shoulder. Stimuli were processed by a Realtec Intel 8280 IBA sound card and presented through a set of Etymotic ER-4P MicroPro in-ear headphones.
In order to test if subjects were able to judge Time-to-Passage (TTP) of audio looming stimuli, we used the five intermediate distances and speed values already used in visual TTP studies (Gray & Regan, 2006; López-Moliner et al., 2007; Mouta et al., 2012). We combined these five initial distances – 0.85, 0.93, 1.00, 1.09, 1.18m – and the five constant speeds – 0.83, 0.91, 1.00, 1.10, 1.20 m/s –into 25 levels of TTP, 12 that passed the observer before the 1s mark, one at 1s and 12 that passed after. TTP values ranged from 0.59s to 1.69s. TTP is derived from the TTA equation (cf. Equation 1), which is the relation between distance and its time derivative, velocity (Jenison, 1997; Shaw et al., 1991).
Equation 1 - Ratio derived from the distance coordinates relative to their respective velocities.
In the auditory modality, 𝜏 is related to the inverse of the relative intensity (I) change.
2.1.4. Procedure
Participants were seated in a dark room with their head on a chin-rest to prevent movements. They were instructed to judge if the sound had passed by them or not by pressing one of two response buttons (2 alternative forced-choice task – 2AFCT). Participants were asked to answer as soon as the stimulus finished, and to take their right ear as a referential of sound passage. All stimuli lasted 1s and had an inter-stimulus interval (ISI) of 0.75s. The experiment was divided into 2 blocks of 10 repetitions each, totaling 9 minutes.
2.1.5. Analysis
Cumulative Gaussian curves were fitted in order to provide distributions of the proportion of trials in which auditory stimuli had “not passed” the participant’s plane
13 during the stimulus’ presentation. We derived two parameters, point of subjective simultaneity (PSS) and standard deviation (SD). PSS is defined as the point at which the TTP value reaches the 50% of “not passed” responses. A PSS larger than 1s (curves shifted to the right) means that the stimulus appeared to arrive earlier than what was simulated, i.e. an anticipation of passage. SD is inversely related to the slope of the function. We derived these two parameters both from single individual data and from pooled data for all participants. The goodness of the fit was tested using the Deviance Statistic, which follows a Chi-square distribution with degrees of freedom equal to the number of data points minus the number of parameters on the model. Larger p-values (>0.05) indicate that the model is a good descriptor of the data. Akaike Information Criterion (AIC) is presented along with Deviance Statistic as a criteria for decision for the preferred model (Moscatelli, Mezzetti, & Lacquaniti, 2012). The minimum value of AIC is considered a good indicator of the model’s best fit.
2.1.6. Results and discussion
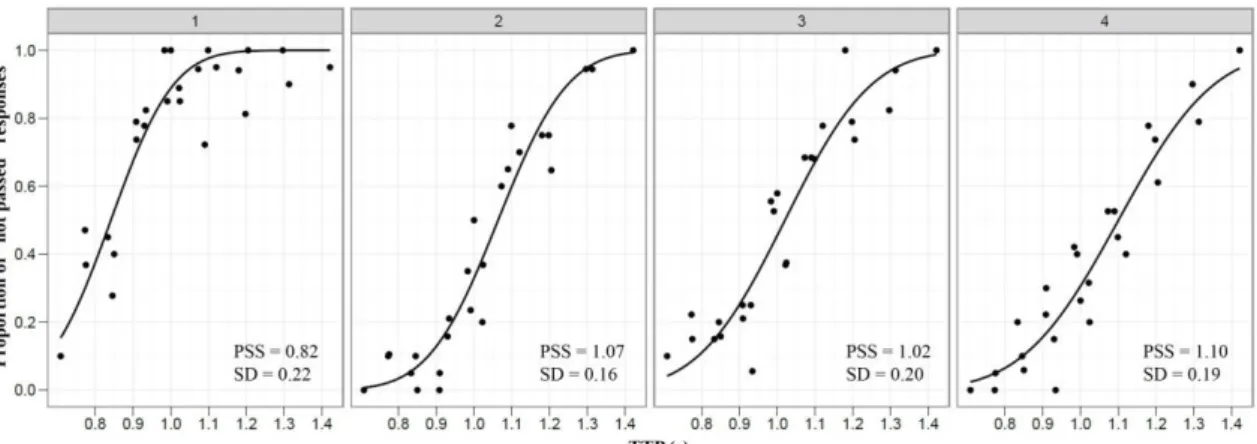
Results demonstrated that participants were able to judge TTP. Participants were considerably accurate (PSS = 1.01s) judging passage of auditory stimuli, although less precise (SD = 0.21) when compared with visual TTP studies for rigid objects (Mouta et
al., 2012). However, we could not find consistent patterns for individual results. More
specifically, P2 and P4 anticipated passage, while P1 presented an opposite pattern of results. P3 was relatively accurate (PSS = 1.02s). Precision did not vary significantly along participants.
Figure 1 - Cumulative Gaussian curves fitted to the proportion of trials in which participants
judged the stimulus has having "not passed" by them, as a function of TTP. Individual parameters of PSS and SD are presented for each participant.
14 Overall, participants were able to judge passage of looming sounds with this kind of task. Therefore, we decided to increase the range of TTP values to evaluate if, with a wider range of TTP values and participants, the anticipation of looming sounds would emerge.
2.2. Experiment 1
2.2.1. Purpose of the study
Once participants were able to judge passage of looming sounds, we conducted the same experiment with 49 TTP values. In accordance with the reported phenomenon of overestimation of looming sounds, we expected that this perceptive bias would also be evident with this kind of task. According to this hypothesis, we expect a shifting of the psychophysical curve to the right, meaning that subjects would be judging stimuli that had not passed their ear plane as having already passed. Furthermore, we would like to analyze the role of different variables in the estimation of passage with auditory stimuli.
2.2.2. Participants
Six participants (three males and three females, one of whom left-handed) between 22 and 33 years old (Mean = 27, SD = 3.90), with normal hearing participated in the experiment. Only one was familiarized with this type of task. All participants gave informed consent to take part in this experiment.
2.2.3. Stimuli and materials
49 looming sounds were generated in Matlab® with the same features as in the previous pre-test. Seven simulated initial distances – 0.78, 0.85, 0.93, 1, 1.09, 1.18, 1.29 m – were combined with seven simulated constant velocities – 0.76, 0.83, 0.91, 1, 1.1, 1.2, 1.32 m/s – resulting in 49 total TTP, 24 that passed the subject before 1s, one at 1s and 24 that passed after 1s. The shortest TTP value was 0.59s, which passed by the observer, and the longest was 1.70s, which did not. As in the pre-test, all stimuli had the same duration of 1s, with this being considered the point of physical simultaneity.
We used Etymotic ER-4S MicroPro in-ear headphones, which compensate for high frequencies, thus providing a more accurate reproduction of the dynamic sounds.
15
2.2.4. Analysis
We followed the same data analysis procedure described in section 2.1.5. We plotted data as a function of the theoretical initial TTP (TTPt) provided by the physical stimuli (directly computed from initial distance and velocity), final TTP (TTPf) at the end of the auditory presentation, initial distance (iDist), final distance (fDist) and speed.
2.2.5. Procedure
Stimuli were pseudo-randomly presented with the same fixed duration of 1s. The same procedure of the pre-test was implemented. The experiment was divided in 2 blocks of 10 trials each, with a duration of approximately 15 minutes per session. Prior to the experiment, each participant underwent a training session with 14 stimuli, the extreme values of TTP from each velocity and initial distance.
2.2.6. Results and discussion
By looking at Figure 2A, which depicts the proportion of “not passed” responses as a function of TTPt, we can report that participants were able to judge Time-to-Passage of looming sounds. However, we did not find a clear pattern of anticipation among participants, and consequently our hypothesis was not supported. As in the pre-test, not all participants anticipated the passage, and therefore we have PSS values both below and above the 1s mark. On the one hand, P1, P5 and P6 slightly anticipated the passage of the approaching sounds, meaning that they judged sounds that had not passed by them as having already passed, and thus shifting the psychophysical curve to the right. P3, on the other hand, seemed to be judging stimuli that “passed” as having not passed by his ear plane. P2 and P4 were the most accurate (PSS closer to 1s) and P3 and P4 the most precise (lower SD values).
16
Figure 2 - Individual Cumulative Gaussian curves fitted to the proportion of "not passed"
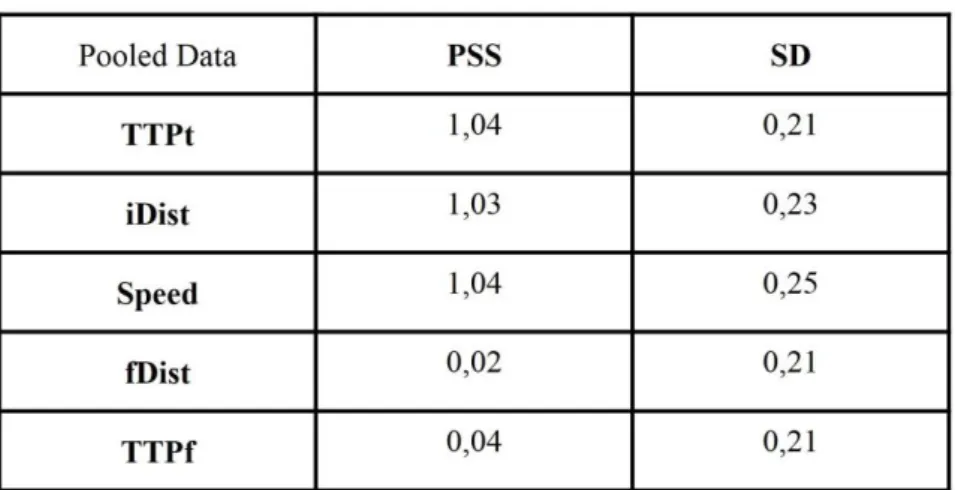
17 We further analyzed the best predictors of the TTP judgment by using the goodness of fit as a function of each variable. As can be seen by Figure 2B and 2C, the goodness of fit is lower when we plot the proportion of “not passed” responses as a function of iDist (Deviance=0.002, p=1, AIC = -29.98) and Speed (Deviance= 0.001, p=1, AIC=-33.92). It seems that participants consider fDist (Deviance = 0.382, p=1, AIC = -69.33), TTPt (Deviance = 0.544, p=1, AIC = -75.47) and TTPf (Deviance = 0.544, p=1, AIC = -75.47) as the most relevant cues for judgment. Therefore, we can say that for these variables, the model that fits the data explains a great deal of the performance’s variability. Additionally, participants were more precise when relying on these cues (lower SD values, see Table 1). We ran a repeated-measures ANOVA and compared SD values extracted from fits as function of each independent variable. A significant effect of variable on SD was found, F(4, 25) = 3.47, p<.005. Tukey’s post-hoc comparisons with 95% confidence intervals showed that SD as a function of Speed was significantly different from SD as a function of fDist (p<.005), TTPt (p<.005) and TTPf (p<.005).
We conclude that, although participants did not demonstrate tendency towards anticipation, each individual seems to use a consistent strategy to perform the task. Despite the fact that our main hypothesis was not verified we can say that firstly, participants were able to judge TTP; and secondly, the most relevant cues for judging auditory TTP are common to all participants. In this sense, since we obtained better adjustments for fDist, TTPt and TTPf for every participant, we will attend to these variables in greater detail from now on.
Table 1 - Estimated parameters (PSS and SD) for each variable, extracted from the pooled data
18 3. Estimation of auditory Time-To-Passage with occlusion
3.1. Control study – Discrete auditory localization task
3.1.1. Purpose of the study
We aimed to understand if the lack of a consistent pattern of results between participants in the TTP task would be better explained by a sound localization difficulty inherent to them. More specifically, we wanted to understand if the variation of the PSS was due to poor performance in an auditory localization task.
3.1.2. Participants
Seven participants took part in this experiment (four males and three females), with ages between 24 and 33 years old (Mean = 28.5, SD = 6.37). All had normal hearing and gave informed consent to participate in this experiments.
3.1.3. Stimuli and materials
Stimuli were binaural white noise sounds (frequency rate = 44.1 KHz) auralized in free-field. We kept azimuth and elevation parameters as in the previous experiments, as well as the distance of the sound source from participants shoulder.
We defined the first static position at 0° azimuth and varied the angle in 10° increments until we reached the nearest and farthest distances used in the previous experiments. Therefore, as can be seen from Figure 3, we obtained seven static sounds 1m to the right of participants’ shoulder along the orthogonally displaced trajectory: four sounds in front of the participants’ ear plane (0.84, 0.58, 0.36, 0.18m), one at exactly the ear plane (0m) and two behind the participants’ ear plane (-0.18 and -0.36m).
A touchscreen Touch 10 SAW (HR) (800x600 resolution, 10.4’’ screen size and 10ms delay time) was used with the participants’ head representation and a line drawn at the right side with the seven positions marked.
19
Figure 3 - Schematic representation of the touchscreen display for the audio localization task.
The simulated position of each sound burst, represented in boxes, was placed as it was presented 1m from participants’ shoulder.
3.1.4. Procedure
Participants were seated in a dark room with the head positioned in a chin rest to prevent head movements and with the touchscreen at a comfortable distance in front of them. The experiment was composed of two stages. In the first stage, participants heard the stimuli four times ordered by approaching distance, from 0.84 until -0.36m. In the second stage, participants performed the sound localization task. Stimuli were pseudo-randomized and presented in one block of 10 trials. Participants had to listen to the stimulus for 3s and then had 2s (ISI) to press one of the seven positions in the screen. The experiment lasted for approximately 6min.
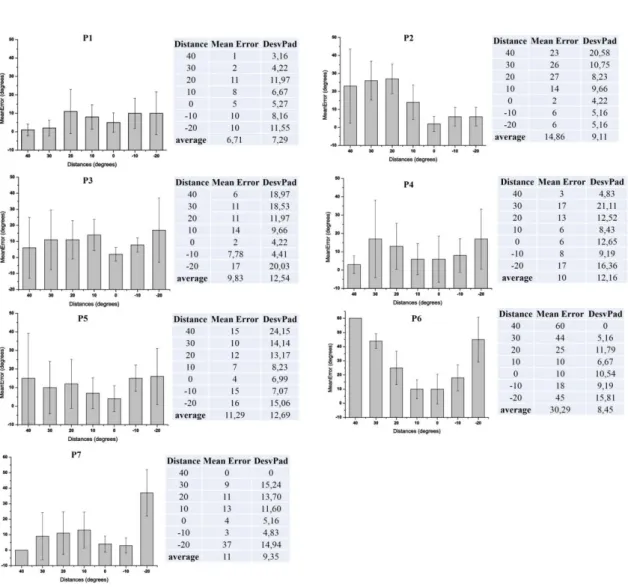
3.1.5. Results and discussion
We plotted the mean error of the localization discrimination as a function of distance (see Figure 4). Individual data is presented, since we intended to achieve good
20 performance levels in the localization task for each participant before running the TTP experiments.
Figure 4 - Mean Error as a function of distance, both in degrees, are presented for each participant.
40° corresponds to the 0.84m position, while -20° refers to -0.36m. Error bars represent the SD regarding each distance.
Overall, participants were accurate, according to the literature, although not so much precise. Brungart, Durlach, and Rabinowitz (1999) used the same kind of stimuli generated by the MIT HRTF database and demonstrated localization errors in the azimuth axis between 13.3 and 13.7° with 0° elevation. Although our mean error increased at certain angles, especially at those behind the participant, participants were fairly accurate localizing bursts of noise in the horizontal plane. It should also be taken into account that several studies exclude front-back confusions from analysis (Middlebrooks & Green, 1991). Therefore, the reported error in these studies could be inferior to the one obtained
21 in other works. Furthermore, participants are usually trained in these kinds of tasks until they reach a certain level of performance accuracy. In our study we did not have a training session, for we wanted to understand their baseline performance.
Other studies, with 0° elevation and 1m distance from the observer, demonstrated that, when participants are not submitted to previous training in sound localization, there is a greater error in discriminating the positions around 40 and 60° (corresponding to our distances of 0.84 and 0.58m, respectively). Subjects usually misperceive the location of the sound source in about 20-30° (Mendonça et al., 2010). This was clearly the case of Participant 2 (maximum Mean Error = 26°). We excluded Participant 6 from the next study due to his great variability of response and lower accuracy (maximum Mean Error = 60°).
3.2. Pre-test 2 – Modality of the temporal marker
3.2.1. Purpose of the study
In Experiment 2 an occlusion period was presented between the stimuli presentation and the judgment stage. The purpose of this pre-test was to evaluate the best modality in which to present the temporal marker that signals the moment at which participants had to respond. We intended to select the modality that caused less interference with the judgment task. We used two criteria to verify the modality’s effect on performance: reaction time and performance accuracy (PSS, SD).
3.2.2. Participants
Two participants from the previous TTP experiment (one male and one female) took part in this pre-test.
3.2.3. Stimuli and materials
Stimuli were generated as described in previous sections. The same 49 levels of TTP were used in this experiment, but were not presented in their entirety. Stimuli were presented for 0.9s and the remaining 0.1s were silence.
The auditory marker consisted of a non-auralized binaural beep (frequency rate = 44.1 KHz) with a 0.75s duration. The visual marker was a flash lasting for 0.75s presented in a screen placed 1m from the participants’ shoulder at their right side.
22 The same materials from Experiment 1 were also used in this pre-test (see section
2.2.3.).
3.2.4. Procedure
Stimuli were divided by 2 blocks, one for the auditory marker and the other for the visual marker. Participants were instructed to listen to an approaching sound that followed a linear trajectory 1m from their shoulder, at their right side. They were also told that the stimuli were not going to be completely presented, and therefore they would have to estimate, considering that the stimulus remained in the same trajectory and at a constant speed, whether the sound had passed by their ear plane at the temporal marker. They answered by pressing one of two response buttons (2AFCT). Each participant performed 4 sessions, 2 for the beep and 2 for the flash, with 5 trials each, lasting a total of approximately 16min. Before the experimental session participants underwent a training session.
3.2.5. Results and discussion
Results showed that participants made equivalent judgments with markers from both modalities. We found that the use of the flash leads to a slight anticipation in comparison with the beep (see Figure 5).
P1 estimated passage more accurately with the flash (PSS = 1.00), although he was less precise (SD = 0.28). In comparison, with the beep there was a slight shift of the curve to the left (PSS = 0.96), although precision improved (SD = 0.24). P2 showed a greater anticipation of passage with the flash (PSS = 1.17) in comparison with the beep (PSS = 1.14), although the uncertainty was higher for the flash (SD = 0.22), than for the beep (SD = 0.18). Considering that the SD is slightly lower for the auditory beep in comparison with the flash, we considered the former as the appropriate modality for the marker in the second study. Likewise, by opting for the beep, we maintain the experiment within the same perceptual modality, ensuring that no mediation processes could be influencing the judgment estimation of participants. Furthermore, an auditory marker seems to be a more efficient temporal reference when compared with a visual one (Welch, DutionHurt, & Warren, 1986).
23 3.3. Experiment 2 – Estimation of Time-to-Passage with stimulus occlusion
3.3.1. Purpose of the study
The aim of this experiment was to investigate whether participants could still estimate passage with the deterioration of the stimuli. In order to evaluate this, we interrupted the presentation of the stimuli and inserted a silence gap until the moment of the TTP judgment. Therefore, we expected to find a deterioration pattern as the amount of occlusion increased. More specifically, we expected to find higher anticipation (greater values of PSS and thus, curve shifted to the right) for the maximum amount of occlusion and a tendency towards a less precise estimation (higher SD) as the amount of occlusion increased.
3.3.2. Participants
Six participants (four males and two females, one of whom left-handed) with ages ranging from 24 to 33 years old (Mean = 27.17, SD = 3.13) took part in the experiment. Four had already participated in the first TTP experiment (P2, P3, P4 and P6) and all had participated in the control study of auditory localization. All subjects had normal hearing and gave informed consent to take part in this experiment.
Figure 5 - Proportion of "not passed" responses as a function of TTP plotted for each participant.
24
3.3.3. Stimuli and materials
Stimuli were generated as described in sections 2.1.3. and 2.2.3.
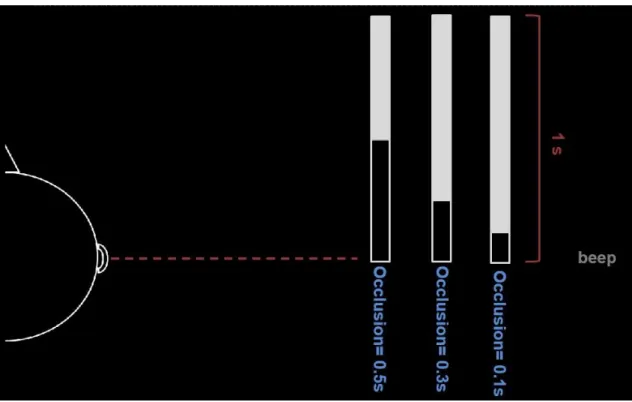
All 49 levels of TTP were used in this experiment. Stimuli were blocked according to the amount of occlusion. All stimuli lasted for 1s and differed only in the amount of occlusion. The minimum was 0.1s when stimulus presentation was 0.9s (10%), the intermediate was 0.3s when stimulus presentation was 0.7s (30%), and the maximum amount was 0.5s when stimulus had the same presentation (50%) (see Figure 6).
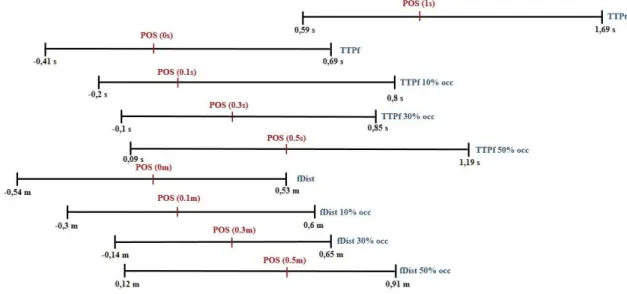
TTPt values were the same as described in section 2.1.3. TTPf values for the 10% occlusion varied from -0.2 to 0.8s, from -0.1 to 0.85s for the 30% occlusion, and from 0.09 to 1.19s for the 50% occlusion (see Figure 7). Negative values of TTPf mean that the stimulus had already passed the participants’ ear plane. This experiment consisted of a total of 147 stimuli. Participants answered by pressing one of two response buttons (2AFCT).
Figure 6 - Schematic representation of the stimuli's presentation with the insertion of the
25
3.3.4. Analysis
We followed the same data analysis procedure described in the previous experiment. We used the parametric bootstrap method (Efron & Tibshirani, 1993) to obtain the 95% Confidence Intervals of the two parameters of the cumulative Gaussian functions for each occlusion condition.
3.3.5. Procedure
Stimuli were pseudo-randomized by block and counterbalanced by participant. The same procedure from the previous pre-test was implemented. Although stimuli had different presentation times, the temporal marker was always presented 1s after the beginning of the stimuli’s presentation (see Figure 6).
Before each block, subjects were submitted to a presentation of six stimuli with TTPs ordered by approaching distance and a training session with the same TTPs randomized, to ensure that participants understood the task. Responses from the training session were discarded. Each participant performed 12 sessions with four trials each. Each session lasted 6min. This experiment had a total duration of approximately 50 minutes per participant.
Figure 7 - Range of values of the variables used in Experiments 1 and 2 with the representation
of the Point of Objective Simultaneity (POS). Negative values indicate that the stimulus passed the participants’ ear plane.
26
3.3.6. Results and discussion
As was previously done, we plotted the proportion of “not passed” responses as a function of the TTPt, for each amount of occlusion.
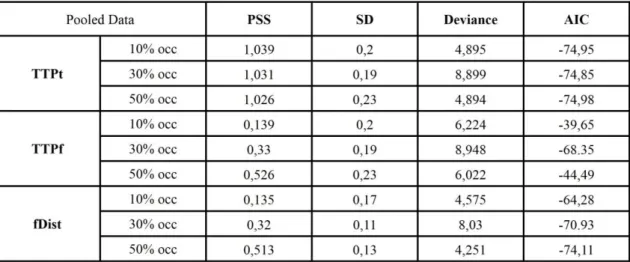
Pooled data demonstrated no significant differences in the goodness of fit for the three conditions regarding the estimation of passage of looming sounds (see Table 2). TTPt was equally predictive of the judgment for all occlusions (see Figure 8A) as was TTPf (see Figure 8B). Data was also explained by the use of fDist with the increase in the amount of occlusion (see Figure 8C).
Table 2 - Estimated parameters (PSS and SD) extracted from pooled data for each occlusion
27
Figure 8 - Proportion of "not passed" responses as a function of the informative variables selected
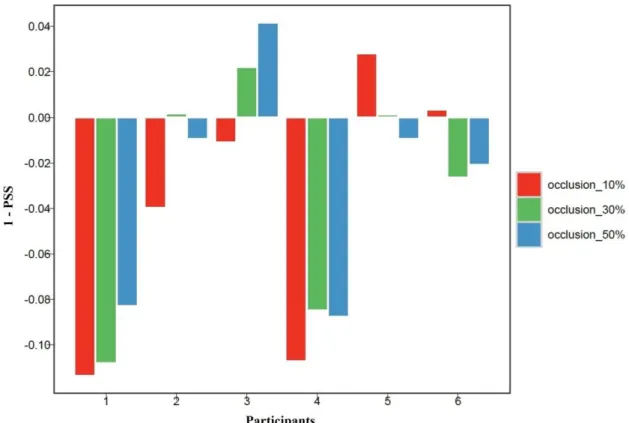
28 Overall, participants were able to estimate passage regardless of the amount of occlusion. By looking at the shift from the expected point of simultaneity (1s) we can see that there is no consistent bias on passage estimation among participants (see Figure 9).
Negative values mean that participants obtained higher values of PSS, indicating anticipation of passage, whereas positive values mean that participants obtained lower values of PSS, indicating that they perceived the stimulus as passing sooner than it actually did. On the one hand, P1 and P4 showed a decrease of the anticipation as the amount of occlusion increased, going in the opposite direction of our hypothesis. On the other hand, P2, P3, P5 and P6 showed a greater variability of judgment. We did not find significant effect of the amount of occlusion on accuracy. After bootstrapping the PSS parameter, we obtained the following values with 95% CI [1.017, 1.060] for 10% occlusion, [1.011, 1.050] for 30% occlusion and [1.003, 1.050] for 50% occlusion.
Additionally, we plotted the SD extracted from the individual fits as a function of the TTPt for the different occlusions. Significant differences between the occlusions were not found. Bootstrap with 95% CI revealed the values [0.173, 0.223] for 10% occlusion, [0.163, 0.216] for 30% of occlusion and [0.201, 0.262] for 50% of occlusion.
Figure 9 - Variation of the PSS parameter (extracted from individual fits as a function of TTPt)
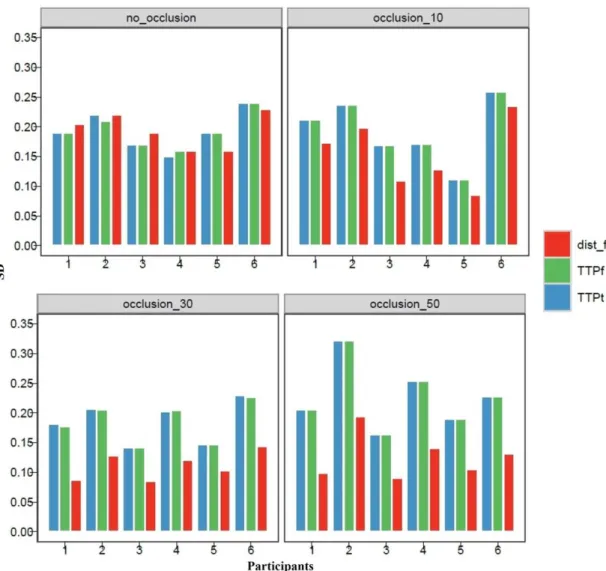
29 By looking at each of the SD values individually (see Figure 10), we can see that both TTPt and TTPf seem to be more difficult to compute as the amount of occlusion increases (greater SD values), whereas fDist appears to reduce the uncertainty of the judgment (smaller SD values). This tendency is constant among participants.
An effect of the amount of occlusion on SD was found as a function of fDist. Bootstrap revealed the following values with 95% CI [0.148, 0.196] for 10% of occlusion, [0.097, 0.131] for 30% of occlusion and [0.116, 0.144] for 50% occlusion.
Overall, our hypothesis was not empirically verified, since performance did not deteriorate with the amount of occlusion. Although we could not find a consistent trend in terms of accuracy for all participants, precision results were quite consistent among them. We stress that SD values for fDist are lower when stimuli were presented with 30%
Figure 10 - SD values (extracted from fit as a function of TTPt, TTPf and fDist) presented for
30 of occlusion or more. This indicates that participants seem to rely more on final distance as an informative cue at this level of occlusion. Therefore, accuracy did not decrease with increasing uncertainty, because participants relied on different cues to supply the stimuli’s deterioration. Additionally, as shown in Table 2, the SD for TTPt and TTPf increases with the amount of occlusion, whereas the opposite tendency is true for fDist. We can state that participants change their strategy (the usage of the informative variable) as the amount of occlusion varies.
4. General Discussion
This work stemmed from the need to understand how accurate and precise participants were in perceiving approaching sounds. Indeed, both experiments demonstrate evidence of how the perceptual system is able to extract information from an auditory event. Firstly, we showed that participants were able to judge passage of looming sounds. Secondly, we showed that, although there was an interruption in the sound’s presentation, participants were still able to estimate passage at the fixed time.
Despite the fact that we could not verify an anticipatory tendency for all participants, as previous experiments on auditory TTA and TTP have shown (Schiff & Oldak, 1990; Rosenblum et al., 1993), we consider we have congruent results. We did not find differences on accuracy in the judgment of TTP between participants, suggesting that performance was not biased by an under or overestimation of sound. The accuracy of participants in the estimation of the time remaining for the sound source to pass their ear plane was the first intriguing finding of this study. We were expecting that, as the amount of information available decreased, the uncertainty of the task lead to a greater anticipation of sounds’ passage. Surprisingly, participants maintained the same level of accuracy along experiments, rulling out the explanatory hypothesis of an adaptation process. If participants were to answer based on safety, the greater the amount of occlusion, the greater the tendency to anticipate the estimate of passage would be. Instead, participants seemed to mantain the same performance level, while changing their perceptual strategy.
Another relevant result was that of TTP not being the only information computed by participants, as had been expected. In Experiment 1, TTPt, TTPf and fDist were predictive of the judgment of passage among all participants. Moreover, in Experiment 2, as the amount of information provided by the stimuli was reduced, TTPt and TTPf lost
31 predictive strength, while the use of fDist increased the precision of the estimation of passage. These results seem to indicate a change in the perceptual strategy as a function of the available information. Indeed, when stimuli were completely presented, TTPt and TTPf were equaly predictive of performance along with fDist. This indicates that it is possible to compute the tau variable when all the information is available. However, when the task is more demanding and consequently leads to more uncertainty, participants seem not to be able to compute the information provided by complex variables (such as TTP) and rely on more simple ones that can be directly extracted (such as fDist). In visual studies with rigid stimuli (Mouta et al., 2012), TTP continued to be predictive of subjects’ performance, despite the amount of occlusion (SD = 0.14s). Although for auditory TTP participants do not use the same variable for different amounts of occlusion, they are able to maintain the same level of precision (SD = 0.14s) with the use of different cues.
In this line, our data seems to demonstrate that participants do not act with a strategy to ensure safety or according to an adaptative perspective, as previously stated in the ecological approach of psychoacoustics (Guski, 1992; Neuhoff, 2001; 2004). We should also note that in the present study we did not intend to simulate a naturalistic sound source. Our main purpose was to create the simplest sound that could give a baseline understanding of looming sounds judgment. It is important to stress that some parameters do not allow a direct comparison among studies. For instance, Rosenblum and colleagues (1993) had stimuli with 2.1s and an occlusion period of 2.5s, while Schiff and Oldak (1990) presented 6s stimuli with 80 ms of occlusion. For this reason, there is a possiblity that cognitive processes could be biasing judgments. In this sense, the anticipation of arrival and passage time could be due to a long ISI instead of the dynamic features of the stimuli. Natural or ecological features of stimuli like vehicles (Rosenblum, 1993) could also contribute for a conservative performance, in the sense of anticipating arrival. In our work, we presented white noise with no contextual information: in future work we might consider increasing the complexity and contextual features of stimuli.
The tau hypothesis is a matter of great debate in the scientific community (Tresilian, 1999). We verifed that participants computed TTP for auditory looming sounds, independently of its components (initial or final distance and velocity), at least with this type of task.
32 5. Conclusion
Although this is a preliminary study, we have provided empirical evidence of performance within a TTP task in the auditory modality. Therefore, we have a preliminary understanding of looming sounds estimations. For future consideration, we would like to explore the role of auditory and visual modalities combined in the same task.
6. References
Bach, D. R., Neuhoff, J. G., Perrig, W., & Seifritz, E. (2009). Looming sounds as warning signals: The function of motion cues. International Journal of Psychophysiology,
74(1), 28-33. doi: http://dx.doi.org/10.1016/j.ijpsycho.2009.06.004.
Bootsma, R. J., & Craig, C. M. (2002). Global and local contributions to the optical specification of time to contact: Observer sensitivity to composite tau. Perception,
31(8), 901-924.
Brungart, D. S., Durlach, N. I., & Rabinowitz, W. M. (1999). Auditory localization of nearby sources. II. Localization of a broadband source. The Journal of the
Acoustical Society of America, 106, 1956. doi:
http://dx.doi.org/10.1121/1.427943.
Cheng, C. I., & Wakefield, G. H. (1999). Introduction to head-related transfer functions
(HRTFs): Representations of HRTFs in time, frequency, and space. Paper
presented at the Audio Engineering Society Convention 107, Ann Arbor, MI 48109, USA.
DeLucia, P., Kaiser, M., Bush, J., Meyer, L., & Sweet, B. (2003). Information integration in judgements of time to contact. The Quarterly Journal of Experimental
Psychology, 56(7), 1165-1189. doi: 10.1080/02724980343000053.
Efron, B., & Tibshirani, R. (1993). An Introduction to the Bootstrap. Gibson, J. J. (1966). The senses considered as perceptual systems.
Gray, R., & Regan, D. M. (2006). Unconfounding the direction of motion in depth, time to passage and rotation rate of an approaching object. Vision Research, 46(15), 2388-2402. doi: http://dx.doi.org/10.1016/j.visres.2006.02.005.
Guski, R. (1992). Acoustic tau: An easy analogue to visual tau? Ecological Psychology,
33 Huopaniemi, J., & Riederer, K. A. (1998). Measuring and modeling the effect of source
distance in head-related transfer functions. Paper presented at the International
Congress on Acoustics.
Jenison, R. L. (1997). On acoustic information for motion. Ecological Psychology, 9(2), 131-151. doi: 10.1207/s15326969eco0902_2.
Lee, D. N. (1976). A theory of visual control of braking based on information about time-to-collision. Perception, 5(4), 437-459. doi: 10.1068/p050437.
López-Moliner, J., & Bonnet, C. (2002). Speed of response initiation in a time-to-contact discrimination task reflects the use of< i> η</i>. Vision Research, 42(21), 2419-2430. doi: http://dx.doi.org/10.1016/S0042-6989(02)00257-2.
López-Moliner, J., Brenner, E., & Smeets, J. B. (2007). Effects of texture and shape on perceived time to passage: Knowing “what” influences judging “when”.
Perception & psychophysics, 69(6), 887-894. doi: 10.3758/BF03193925.
Mendonça, C., Santos, J., Campos, G., Dias, P., Vieira, J., & Ferreira, J. (2010, 2010). On
the Improvement of Auditory Accuracy with Non-Indivisualized HRTF-Based Sounds. Paper presented at the Audio Engineering Society Convention 129, San
Franscisco, CA, USA.
Middlebrooks, J. C., & Green, D. M. (1991). Sound localization by human listeners.
Annual review of psychology, 42(1), 135-159. doi: 10.1146/annurev.ps.42.020191.001031.
Moscatelli, A., Mezzetti, M., & Lacquaniti, F. (2012). Modeling psychophysical data at the population-level: The generalized linear mixed model. Journal of Vision,
12(11). doi: 10.1167/12.11.26.
Mouta, S., Santos, J. A., & López-Moliner, J. (2012). The time to passage of biological and complex motion. Journal of Vision, 12(2). doi: 10.1167/12.2.21.
Neuhoff, J. G. (1998). Perceptual bias for rising tones. Nature, 395(6698), 123-124. doi: 10.1038/25862.
Neuhoff, J. G. (2001). An adaptive bias in the perception of looming auditory motion.
Ecological Psychology, 13(2), 87-110. doi: 10.1207/S15326969ECO1302_2.
Regan, D. (2002). Binocular information about time to collision and time to passage.
Vision Research, 42(22), 2479-2484. doi: http://dx.doi.org/10.1016/S0042-6989(02)00086-X.
Rosenblum, L. D., Wuestefeld, A. P., & Saldana, H. M. (1993). Auditory looming perception: Influences on anticipatory judgments. Perception, 22, 1467-1467.
34 Schiff, W., & Oldak, R. (1990). Accuracy of judging time to arrival: effects of modality, trajectory, and gender. Journal of Experimental Psychology: Human Perception
and Performance, 16(2), 303 - 316. doi: 10.1037/0096-1523.16.2.303.
Shaw, B. K., McGowan, R. S., & Turvey, M. (1991). An acoustic variable specifying time-to-contact. Ecological Psychology, 3(3), 253-261. doi: 10.1207/s15326969eco0303_4.
Teghtsoonian, R., Teghtsoonian, M., & Canévet, G. (2005). Sweep-induced acceleration in loudness change and the “bias for rising intensities”. Perception &
psychophysics, 67(4), 699-712. doi: 10.3758/BF03193526.
Tresilian, J. R. (1999). Visually timed action: time-out for ‘tau’? Trends in cognitive
sciences, 3(8), 301-310. doi: http://dx.doi.org/10.1016/S1364-6613(99)01352-2.
Welch, R. B., DutionHurt, L. D., & Warren, D. H. (1986). Contributions of audition and vision to temporal rate perception. Perception & psychophysics, 39(4), 294-300. doi: 10.3758/BF03204939.