DOI: 10.4025/actasciagron.v33i1.11698
Comparison of multiallelic distances for the quantification of
genetic diversity in the papaya
Helaine Christine Cancela Ramos1, Messias Gonzaga Pereira1, Leandro Simões Azeredo Gonçalves1*, Antonio Teixeira do Amaral Júnior1 and Carlos Alberto Scapim2
1
Laboratório de Melhoramento Genético Vegetal, Centro de Ciências Tecnológicas Agropecuária, Universidade Estadual do Norte Fluminense “Darcy Ribeiro”, Av. Alberto Lamego, 2000, 28013-600, Campos dos Goytacazes, Rio de Janeiro, Brazil. 2Departamento de Agronomia, Centro de Ciências Agrárias, Universidade Estadual de Maringá, Maringá, Paraná, Brazil.
*Author for correspondence. E-mail: [email protected]
ABSTRACT. This study aimed to compare multiallelic distances to quantify genetic diversity in papaya. We evaluated forty-three individuals in the S2 generation, from the backcross between F1 (Cariflora x SS783) and Cariflora, and four accessions from the UENF/Caliman Germplasm Bank. Genetic distances used were Smouse and Peakall (1999), Kosman and Leonard (2005) and weighted index. Clustering among genotypes was performed using the hierarchical unweighted pair-group method with arithmetic mean analysis (UPGMA) and projection of the distance on the bidimensional plan. A high correlation between genetic distances was observed; however, through UPGMA group analysis, the distance determined by the weighted index provided the complete separation of 52BC1S2-08, 52BC1S2-29 and 52BC1S2-34 inbred lines. Through projection of distances in the plan, Kosman and Leonard (2005) coefficients and weighted allowed the differentiation of individuals in the S2 generation (52BC1S2-08, 52BC1S2-29 and 52BC1S2-34), the progenitor (‘Cariflora’ and ‘SS783’), and the four germplasm bank accessions in a different manner than the Smouse and Peakall (1999) index, which did not provide this discrimination among the accessed genotypes. We conclude that the Kosman and Leonard (2005) coefficient and weighted index are more efficient than the Smouse and Peakall (1999) algorithm on the disposition of the accessed genotypes in dendrograms and in the Cartesian axis displaying genetic similarity.
Keywords: Carica papaya L., microsatellite markers, cultivar characterization, cluster analysis.
RESUMO. Comparação de distâncias multi-alélicas sobre a quantificação da diversidade genética em mamão. O presente trabalho visou à comparação de distâncias multi-alélicas sobre a quantificação da diversidade genética em mamão. Para tanto, foram avaliados 43 indivíduos da geração S2, oriunda do retrocruzamento entre F1 dos (‘Cariflora’ x ‘SS783’) e ‘Cariflora’, e quatro acessos do Banco de Germoplasma da UENF/Caliman. As distâncias genéticas utilizadas foram: Smouse e Peakall (1999), Kosman e Leonard (2005) e índice ponderado. Posteriormente foi realizado o agrupamento entre os genótipos utilizando unweighted pair-group method with arithmetic means analysis (UPGMA) e projeção de distância no plano bi-dimensional. Observou-se elevada correlação entre as distâncias genéticas, entretanto, pela análise de agrupamento UPGMA, a distância utilizando o índice ponderado proporcionou a completa separação das linhagens 52RC1S2-08, 52RC1S2-29 e 52RC1S2-34. Pela projeção das distâncias no plano, os coeficientes Kosman e Leonard (2005) e índice ponderado permitiram a separação dos indivíduos da geração S2 (52RC1S2-08, 52RC1S2-29 e 52RC1S2-34) para com os progenitores (‘Cariflora’ e ‘SS783’) e em relação aos quatro acessos do banco de germoplasma, diferentemente do índice de Smouse e Peakall (1999), que não proporcionou essa distinção entre os genótipos avaliados. Conclui-se, pois, que o coeficiente Kosman e Leonard (2005) e o índice ponderado foram mais eficientes que o algoritmo de Smouse e Peakall (1999) na disposição dos genótipos avaliados em dendrogramas e eixos cartesianos representativos da similaridade genética.
Palavras-chave: Carica papaya L., marcador microssatélite, caracterização de cultivares, análise de agrupamento.
Introduction
The analysis of variance for DNA sequences is of great importance to genetic analysis in plants. Molecular markers are considered important tools to
sequence repeats (SSRs), random amplified polymorphic DNA (RAPD), sequence tagged sites (STS), expressed sequence tags (EST), sequence characterized amplified regions (SCAR), inter simple sequence repeats (ISSR), amplified fragment length polymorphism (AFLP), and single nucleotide polymorphisms (SNPs) (SCHLÖTTERER, 2004; SHULMAN, 2007; LEAL et al., 2010).
SSRs, or microsatellites, as molecular markers for plant genome analysis are gaining importance and replacing other markers in genetic studies, mainly due to reproducibility, multiallelic traits, codominant inheritance, relative abundance, and wide genome coverage (SQUIRREL et al., 2003; VARSHNEY et al., 2005; ZANE et al., 2002). In genetic breeding programs, SSRs have been used for different purposes, such as assisted selection, genetic variance characterization, linkage disequilibrium analysis, and quantitative trait loci (QTLs) mapping (BERNARDO, 2008; EATHINGNTON et al., 2007; JENA; MACKILL, 2008; SCHULMAN, 2007).
In order to quantify genetic variance among individuals, different similarity and dissimilarity coefficients were described, aiming at building a similarity or dissimilarity matrix from all the possible pairs of genotype combinations in order to trace the population structure based on the affinities of each individual in the set of individuals tested (GONÇALVES et al., 2008, 2009; KOSMAN; LEONARD, 2005). According to Reif et al. (2005), the choice of a coefficient will depend on some factors, such as the properties of molecular markers used (whether codominant or dominant), germplasm genealogy (estimated through covariance among related individuals), operational taxonomic unity (OTU) (e.g., open-pollinated populations, inbred lines, hybrids, and other genetic structures), the objective of the study (e.g., genetic diversity quantification, QTL identification) and adequacy of studies using multivariate analysis.
For codominant markers, coefficients that quantify genetic variance among individuals inside each locus (KOSMAN; LEONARD, 2005; PEAKALL et al., 1995; SMOUSE; PEAKALL, 1999) become favorable for dichotomous coefficients (e.g., Jaccard, Sorense-Dice and Simple Matching) due to lack of violation of the independence among loci in addition to preventing the loss of information, primarily if there is high heterozygosity, which is more commonly found in some allogamous species (KOSMAN; LEONARD, 2005; LAURENTIN, 2009).
Kosman and Leonard (2005) validated this inadequacy of dichotomous coefficients using a
locus composed of four alleles (A, B, C and D), where there is a specific band, in that 0 and 1 correspond to absence and presence of a band, respectively as follows: A= (1000), B = (0100), C = (0010), and D = (0001). Through this reasoning, the dissimilarities between the genetic states AA and AB are equally distant to AB and AC, with respect to different coefficients. Using the Jaccard or Sorense-Dice algorithms, for instance, the distance between AA and AB is 0.50 and 0.67 and the distances between AB and AC is0.33 and 0.50, respectively.
We aim to compare the different algorithms in the composition of divergent groups of papaya. Forty three individuals of the S2 generation, from a backcrossing between F1 (Cariflora x SS783) and Cariflora, were evaluated with four accessions from the UENF Germplasm Bank in order to verify the genetic diversity of selections of S2 as to the parents, as well as to quantify the genetic diversity of the bank accessions of the parent ‘Cariflora’ using microsatellite molecular markers.
Material and methods
Plant materials and DNA extraction
Forty-three hermaphroditic genotypes of the S2 generation, corresponding to 17, 14 and 12 genotypes from the families 52BC1S2-34, 52BC1S2 -29II and 52BC1S2-08, respectively, originating from the plant number 52 from the first backcross (BC1) between an F1 plant and the recurrent Cariflora parent, were evaluated. In addition to the parents and the S2 generation, four accessions from the germplasm bank (BAG’s 1, 2, 3 ad 4) were also evaluated. These materials were obtained from the experiment conducted at Caliman Agrícola S.A. Company (Linhares, Espírito Santo State, Brazil) and carried out at the UENF Vegetal Genetic Breeding Laboratory, where the DNA extraction and molecular analysis were performed.
Total DNA cellular was extracted from young leaves of inbred lines using the CTAB method (DOYLE; DOYLE, 1990), with some modifications suggested by Daher et al. (2002). After DNA extraction, DNA was quantified via agarose gel analysis (0.8%) with the High DNA Mass Ladder (Invitrogen, USA). The gel was stained with ethidium bromide, and the image was captured using the Eagle-Eye II photo documentation system.
SSR analysis
Data analysis for molecular characterization 61
(www.genbank.atlanta.org.edu). Clones containing DNA sequences that flank the microsatellite region were used to design primer pairs (Forward and Reverse) using the sequence analysis programs Genamics Expression version 1.0.0.0 and Oligo version 6.68. In order to obtain a greater primer specificity, a few criteria for primer design were established, such as the minimum primer size (> 14 bp) and Tm’s (“melting temperatures (Tm) ranging from 35 to 45°C. Besides these criteria, sequences with high G and C content at their extremities (mainly at the 3-OH end) were avoided to prevent nonspecific amplification.
DNA from the parents (‘Cariflora’ and ‘SS783’) was initially used to optimize the reaction and screen 77 synthesized primers. Amplifications were performed with a final reaction volume of 20 μL, containing 10 ng of DNA, 10 mM Tris-HCl (pH 8.3), 50 mM KCl, 2 mM of MgCl2, 100 μM dNTP,
2 μM of each primer, and 1 U of Taq DNA
polymerase. Amplifications to optimize annealing temperature were performed on a Eppendorf gradient thermal cycler, according to the following program: denaturation for 4 min. at 94ºC, followed by 32 cycles of 94ºC for 30 sec, 53ºC for 1 min., and 72ºC for 1 min.). After 32 cycles, a final extension of 7 min. at 72ºC was performed. Amplification products were separated on a non-denatured 8%
polyacrylamide gel, stained with ethidium bromide, and imaged using the Eagle-Eye II system. After optimizing the reaction conditions, 17 primers were selected due to greater complementarity, reproducibility, and presence of polymorphisms among parents (Table 1).
Data analysis
Data obtained from the amplification of microsatellite markers were converted to a number code for each allele in the locus. For example, if the locus presented three alleles, the representation was 11, 22 and 33 to homozygous forms (A1A1, A2A2 and A3A3) and 12, 13 and 23 to heterozygous forms (A1A2, A1A3, and A2A3). Genetic distances among genotypes were estimated using the Smouse and Peakall (1999), Kosman and Leonard (2005) and weighted index (CRUZ, 2008) coefficients. The grouping among genotypes was performed through the Hierarchical Unweighted Pair-group Method with Arithmetic Means Analysis (UPGMA) and through the projection of the distance in the bidimensional plane (CRUZ; VIANNA, 1994). All analyses were processed through the GENALEX 6 (PEAKALL; SMOUSE, 2006), GENES (CRUZ, 2008) and R (www.r-project.org) software programs.
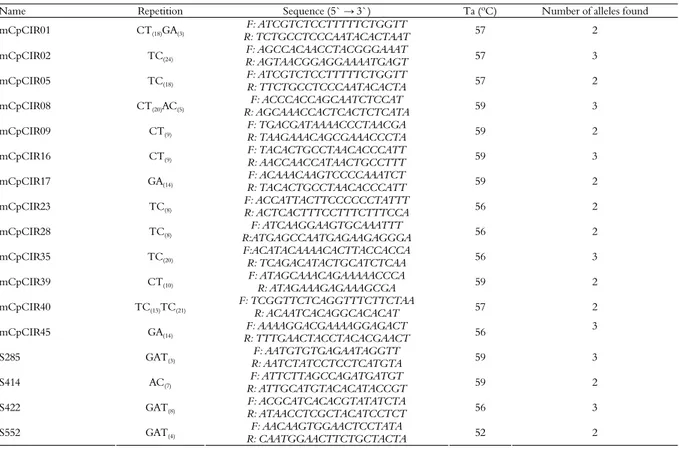
Table 1. Microsatellite primers used in the molecular analysis of the 49 genotypes and the number of alleles found per primer.
Name Repetition Sequence (5` → 3`) Ta (ºC) Number of alleles found
F: ATCGTCTCCTTTTTCTGGTT
mCpCIR01 CT(18)GA(3) R: TCTGCCTCCCAATACACTAAT 57 2
F: AGCCACAACCTACGGGAAAT
mCpCIR02 TC(24) R: AGTAACGGAGGAAAATGAGT 57 3
F: ATCGTCTCCTTTTTCTGGTT
mCpCIR05 TC(18) R: TTCTGCCTCCCAATACACTA 57 2
F: ACCCACCAGCAATCTCCAT
mCpCIR08 CT(20)AC(5) R: AGCAAACCACTCACTCTCATA 59 3
F: TGACGATAAAACCCTAACGA
mCpCIR09 CT(9) R: TAAGAAACAGCGAAACCCTA 59 2
F: TACACTGCCTAACACCCATT
mCpCIR16 CT(9) R: AACCAACCATAACTGCCTTT 59 3
F: ACAAACAAGTCCCCAAATCT
mCpCIR17 GA(14) R: TACACTGCCTAACACCCATT 59 2
F: ACCATTACTTCCCCCCTATTT
mCpCIR23 TC(8) R: ACTCACTTTCCTTTCTTTCCA 56 2
F: ATCAAGGAAGTGCAAATTT
mCpCIR28 TC(8) R:ATGAGCCAATGAGAAGAGGGA 56 2
F:ACATACAAAACACTTACCACCA
mCpCIR35 TC(20) R: TCAGACATACTGCATCTCAA 56 3
F: ATAGCAAACAGAAAAACCCA
mCpCIR39 CT(10) R: ATAGAAAGAGAAAGCGA 59 2
F: TCGGTTCTCAGGTTTCTTCTAA
mCpCIR40 TC(13)TC(21) R: ACAATCACAGGCACACAT 57 2
F: AAAAGGACGAAAAGGAGACT
mCpCIR45 GA(14) R: TTTGAACTACCTACACGAACT 56
3
F: AATGTGTGAGAATAGGTT
S285 GAT(3) R: AATCTATCCTCCTCATGTA 59 3
F: ATTCTTAGCCAGATGATGT
S414 AC(7) R: ATTGCATGTACACATACCGT 59 2
F: ACGCATCACACGTATATCTA
S422 GAT(8) R: ATAACCTCGCTACATCCTCT 56 3
F: AACAAGTGGAACTCCTATA
S552 GAT(4) R: CAATGGAACTTCTGCTACTA 52 2
Results and discussion
Thirty nine alleles were detected and related to 16 analyzed loci among genotypes composed of a minimum of two and a maximum of three alleles per locus, providing an average of 2.4 alleles per locus (Table 1). However, when only the S2 population was analyzed, this number was reduced to one to two alleles per locus, providing an average of 1.7 alleles per locus. This low polymorphism level in S2 is derived from autogamy and favors allele fixation, despite the fact that S2 generation individuals are derived from a single BC1 plant. Nevertheless, the frequency of this allele is in accordance with the expected value to the backcrossed progeny, due to the heterozygous character of the recurrent progenitor used in this work.
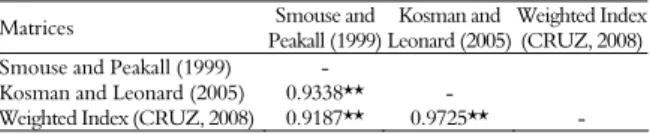
Analysis of distant correlation estimates, obtained through Smouse and Peakall (1999) and Kosman and Leonard (2005) coefficients and weighted index (CRUZ, 2008), showed high association among genetic distance estimates (Table 2), probably due to the low number of alleles per locus verified in this work. Simulation results based on the increase of the number of alleles for a locus showed that the correlation between the Kosman and Leonard (2005) distance and the Smouse and Peakall (1999) weighted index corresponded to the equation ŷ = 1.0426 – 0.0278x, where R2 = 0.9638 (p < 0.01), which indicated a decrease in Pearson correlation estimates for nearly 2.78% for each allele added to the locus.
Table 2. Correlation among matrices of distances from the Smouse and Peakall (1999), Kosman and Leonard (2005) coefficients and Weighted Index (CRUZ, 2008).
Matrices Smouse and
Peakall (1999)
Kosman and Leonard (2005)
Weighted Index (CRUZ, 2008)
Smouse and Peakall (1999) -
Kosman and Leonard (2005) 0.9338** -
Weighted Index (CRUZ, 2008) 0.9187** 0.9725** -
**Significant correlation at 1% probability, using the Mantel test, with 1000 permutations.
Using these results, it is possible to validate that in a population composed of high variability and a great number of alleles per locus, the correlation among the Kosman and Leonard (2005) coefficient and the Smouse and Peakall (1999) weighted index will tend not to reveal a high magnitude of association.
The high correlation among the Kosman and Leonard (2005) and the weighted index are mainly due to the coefficient traits because Kosman and Leonard (2005) assert that the total number of alleles that are common in each combination of individuals divided by the number of evaluated loci. Thus, if a locus is composed of three alleles (A, B and C) and
the five possible combinations of diploid individuals (AA, AB, BB, BC and CC), there will be 100% identity and a value 0 for the distance between AA and AA, or between AB and AB. Additionally, between AA and AB or AB and AC, there will be 50% identity, exhibiting a ½ value of distance. Finally, between the AA and AB individuals, there will be 0% identity and distance will have a value of 1. Weighted index presents the same characteristics on the Kosman and Leonard (2005) coefficient; however, it shows an average number of alleles in each evaluated locus in the population. In this work, the low frequencies of alleles per locus explain the high estimates of correlations.
Kosman and Leonard (2005) report that the Smouse and Peakall (1999) proposal to evaluate dissimilarities with respect to a single locus of multiallelic diploid genotypes is rather mechanistic (geometric) and does not possess a strong genetic relationship.
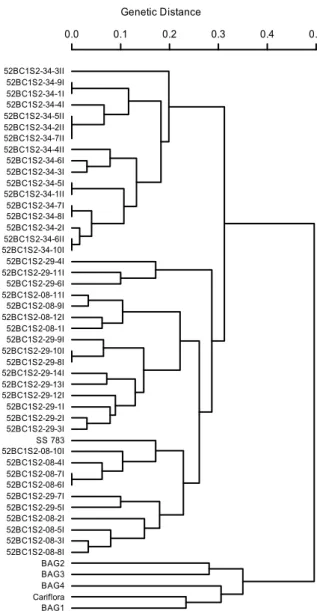
Through UPGMA group analysis, using the Smouse and Peakall (1999) and Kosman and Leonard (2005) coefficients as well as the weighted index, all dendrograms differentiated the germplasm bank accessions (BAG1, BAG2, BAG3 and BAG4) as well as the ‘Cariflora’ genotype from the other inbred lines (52BC1S2-08, 52BC1S2-29 and 52BC1S2-34) and from the ‘SS783’ parent (Figures 1, 2 and 3, respectively).
However, in the BC1 population derived from the crossing between contrasting inbred lines, the expectation is that an average of 75% of the progeny genome can be derived from the recurrent ‘Cariflora’ parent. When observing the dendrograms, it is possible to verify a greater similarity of inbred lines with respect to the ‘SS783’ parent. This observation is mainly due to the selection of plants carried out for the first backcrossing generation, which was based only in phenotypic observations. Therefore, quantitative traits favor the similarity of the BC1 descent with the donor parent.
Data analysis for molecular characterization 63
that these four genotypes were grouped next to the ‘Cariflora’ parent.
BAG1 BAG4 BAG3 Cariflora BAG2 52BC1S2-34-4II 52BC1S2-34-6I 52BC1S2-34-3I 52BC1S2-34-9I 52BC1S2-34-1I 52BC1S2-34-5I 52BC1S2-34-1II 52BC1S2-34-7I 52BC1S2-34-8I 52BC1S2-34-2I 52BC1S2-34-6II 52BC1S2-34-10I 52BC1S2-34-3II 52BC1S2-34-4I 52BC1S2-34-5II 52BC1S2-34-2II 52BC1S2-34-7II SS 783 52BC1S2-08-10I 52BC1S2-08-4I 52BC1S2-08-7I 52BC1S2-08-6I 52BC1S2-08-12I 52BC1S2-08-1I 52BC1S2-29-7I 52BC1S2-29-5I 52BC1S2-08-2I 52BC1S2-08-5I 52BC1S2-08-3I 52BC1S2-08-8I 52BC1S2-29-4I 52BC1S2-29-11I 52BC1S2-29-6I 52BC1S2-29-9I 52BC1S2-29-10I 52BC1S2-29-8I 52BC1S2-29-14I 52BC1S2-29-13I 52BC1S2-08-11I 52BC1S2-08-9I 52BC1S2-29-12I 52BC1S2-29-1I 52BC1S2-29-2I 52BC1S2-29-3I
0.0 0.5 1.0 1.5
Genetic Distance
Figure 1. UPGMA dendrogram based on the analysis of 49
papaya genotypes using the Smouse and Peakall (1999) distance. (Co-phenetic correlation = 0.73).
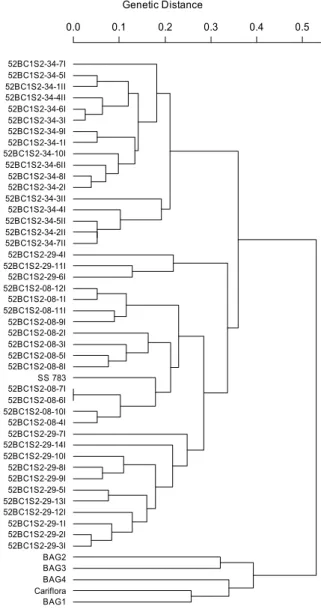
Comparing dendrograms obtained from the Smouse and Peakall (1999), Kosman and Leonard (2005) coefficients and weighted index, it was verified that the last coefficient provided the complete separation of inbred lines 52BC1S2-08, 52BC1S2-29 and 52BC1S2-34. Furthermore, the Smouse and Peakall (1999) and Kosman and Leonard (2005) coefficients provided dendrograms with some disturbances between 52BC1S2-08 and 52BC1S2-29. Concerning the cophenetic correlation, which estimates the association between matrices obtained through grouping and the distance matrix, values of 0.85, 0.83 and 0.73 were observed for the weighted index, the Kosman and
Leonard (2005) and the Smouse and Pekall (1999) coefficients, respectively, with respect to the UPGMA grouping. These results show greater consistency with the weighted index and the Kosman and Leonard (2005) coefficient for quantification of genetic diversity in this study.
52BC1S2-34-3II 52BC1S2-34-9I 52BC1S2-34-1I 52BC1S2-34-4I 52BC1S2-34-5II 52BC1S2-34-2II 52BC1S2-34-7II 52BC1S2-34-4II 52BC1S2-34-6I 52BC1S2-34-3I 52BC1S2-34-5I 52BC1S2-34-1II 52BC1S2-34-7I 52BC1S2-34-8I 52BC1S2-34-2I 52BC1S2-34-6II 52BC1S2-34-10I 52BC1S2-29-4I 52BC1S2-29-11I 52BC1S2-29-6I 52BC1S2-08-11I 52BC1S2-08-9I 52BC1S2-08-12I 52BC1S2-08-1I 52BC1S2-29-9I 52BC1S2-29-10I 52BC1S2-29-8I 52BC1S2-29-14I 52BC1S2-29-13I 52BC1S2-29-12I 52BC1S2-29-1I 52BC1S2-29-2I 52BC1S2-29-3I SS 783 52BC1S2-08-10I 52BC1S2-08-4I 52BC1S2-08-7I 52BC1S2-08-6I 52BC1S2-29-7I 52BC1S2-29-5I 52BC1S2-08-2I 52BC1S2-08-5I 52BC1S2-08-3I 52BC1S2-08-8I BAG2 BAG3 BAG4 Cariflora BAG1
0.0 0.1 0.2 0.3 0.4 0.5
Genetic Distance
Figure 2. UPGMA dendrogram based on the analysis of 49
papaya genotypes using the Kosman and Leonard (2005) distance. (Co-phenetic correlation = 0.83).
lowest value of stress and deviations when compared with the Smouse and Pekall (1999) index. Furthermore, these algorithms allowed the separation of individuals in the S2 generation (52BC1S2-08, 52BC1S2-29 and 52BC1S2-34) as to progenitors (Cariflora and SS783) as well as the four germplasm bank accessions (Figure 4) in a different manner from the Smouse and Peakall (1999) index, which did not provide this differentiation among the evaluated genotypes (Figure 4). We can conclude, therefore, that the Kosman and Leonard (2005) coefficient and weighted index were more efficient than the Smouse and Peakall (1999) algorithm on displaying the evaluated genotypes in dendrograms and Cartesian axis representing the genetic similarity.
52BC1S2-34-7I 52BC1S2-34-5I 52BC1S2-34-1II 52BC1S2-34-4II 52BC1S2-34-6I 52BC1S2-34-3I 52BC1S2-34-9I 52BC1S2-34-1I 52BC1S2-34-10I 52BC1S2-34-6II 52BC1S2-34-8I 52BC1S2-34-2I 52BC1S2-34-3II 52BC1S2-34-4I 52BC1S2-34-5II 52BC1S2-34-2II 52BC1S2-34-7II 52BC1S2-29-4I 52BC1S2-29-11I 52BC1S2-29-6I 52BC1S2-08-12I 52BC1S2-08-1I 52BC1S2-08-11I 52BC1S2-08-9I 52BC1S2-08-2I 52BC1S2-08-3I 52BC1S2-08-5I 52BC1S2-08-8I SS 783 52BC1S2-08-7I 52BC1S2-08-6I 52BC1S2-08-10I 52BC1S2-08-4I 52BC1S2-29-7I 52BC1S2-29-14I 52BC1S2-29-10I 52BC1S2-29-8I 52BC1S2-29-9I 52BC1S2-29-5I 52BC1S2-29-13I 52BC1S2-29-12I 52BC1S2-29-1I 52BC1S2-29-2I 52BC1S2-29-3I BAG2 BAG3 BAG4 Cariflora BAG1
0.0 0.1 0.2 0.3 0.4 0.5
Genetic Distance
Figure 3. UPGMA dendrogram based on the analysis of 49
papaya genotypes using the Weighted index (CRUZ, 2008) (Co-phenetic correlation = 0.85).
Dim 1
0 1 2 3 4
Di m 2 -1.0 -0.5 0.0 0.5 1.0 1.5 2.0 Cariflora SS 783 52BC1S2-34
52BC1S2-29
52BC1S2-08
BAG'S
Correlation: 0.7367
Stress (%): 36.10
Distortion (%): 29.93
Smouse and Peakall (1999)
Dim 1
0.0 0.2 0.4 0.6 0.8 1.0 1.2 1.4
Di m 2 -0.4 -0.2 0.0 0.2 0.4 0.6
Correlation: 0.8114
Stress (%): 33.81
Distortion (%): 24.12
Kosman and Leonard (2005)
Cariflora SS 783 52BC1S2-34
52BC1S2-29
52BC1S2-08
BAG'S
Dim 1
0.0 0.2 0.4 0.6 0.8 1.0 1.2 1.4
Di m 2 -0.4 -0.2 0.0 0.2 0.4 0.6 Cariflora SS 783 52BC1S2-34
52BC1S2-29
52BC1S2-08
BAG'S
Correlation: 0.8229
Stress (%): 31.32
Distortion: 13.03
Weighted Index
Figure 4. Projection of distances in the plane, considering 49 papaya genotypes using the Smouse and Pekall (1999) dissimilarity coefficient, the Kosman and Leonard (2005) dissimilarity coefficient ad the Weighted Index (CRUZ, 2008).
Data analysis for molecular characterization 65
Cariflora, but also to provide the selection of segregant genotypes exhibiting desirable agronomic qualities aimed at the short or medium period of attainment of superior endogamic inbred lines.
Conclusion
Kosman and Leonard (2005) coefficient and the weighted index were more efficient than the Smouse and Peakall (1999) algorithm for the disposition of the accessed genotypes in dendrograms and the Cartesian axis for genetic similarity.
Acknowledgments
We would like to thank Coordenação de Pessoal de Nível Superior (Capes) for the research fellowship. For financial and material support, we thank Financiadora de Estudos e Projetos (Finep) and Empresa Calimam S.A. (Caliman).
References
BERNARDO R. Molecular markers and selection for complex traits in plants: learning from the last 20 years. Crop Science, v. 48, n. 5, p. 1649-1664, 2008.
CRUZ, C. D. Programa GENES: diversidade genética. Viçosa: UFV, 2008.
CRUZ, C. D.; VIANA, J. M. S. A methodology of genetic divergence analysis based on sample unit projection on two-dimensional space. Revista Brasileira de Genética, v. 17, n. 1, p. 69-73, 1994.
DAHER, R. F.; PEREIRA, M. G.; TUPINAMBA, E. A.; AMARAL JÚNIOR, A. T.; ARAGÃO, W. N.; RIBEIRO, F. E.; OLIVEIRA, L. O.; SAKIYAMA, N. S. Assessment of coconut tree genetic divergence by compound sample RAPD marker analysis. Crop Breeding and Applied Biotechnology, v. 2, n. 3, p. 431-438, 2002.
DOYLE, J. J.; DOYLE, J. L. Isolation of plant DNA from fresh tissue. Focus, v. 12, n. 27, p. 13-15, 1990.
EATHINGTON, S. R.; CROSBIE, T. M.; EDWARDS, M. D.; REITER, R. S.; BULL, J. K. Molecular markers in a commercial breeding program. Crop Science, v. 47, n. 3, p. 154-163, 2007.
GONÇALVES, L. S. A.; RODRIGUES, R.; AMARAL JÚNIOR, A. T.; KARASAWA, M.; SUDRÉ, C. P. Comparison of multivariate statistical algorithms to cluster tomato heirloom accessions. Genetics and Molecular Research, v. 7, n. 4, p. 1289-1297, 2008.
GONÇALVES, L. S. A.; RODRIGUES, R.; AMARAL JÚNIOR, A. T.; KARASAWA, M.; SUDRÉ, C. P. Heirloom tomato gene bank: assessing genetic divergence based on morphological, agronomic and molecular data using a Ward-modified location model. Genetics and Molecular Research, v. 8, n. 1, p. 364-374, 2009. JENA, K. K.; MACKILL, D. J. Molecular markers and their use in marker-assisted selection in rice. Crop Science, v. 48, n. 4, p. 1266-1276, 2008.
KOSMAN, E.; LEONARD, K. J. Similarity coefficients for molecular markers in studies of genetic relationships between individuals for haploid, diploid, and polyploidy species. Molecular Ecology, v. 14, n. 2, p. 415-424, 2005.
LAURENTIN, H. Data analysis for molecular characterization of plant genetic resources. Genetic Resource and Crop Evolution, v. 56, n. 2, p. 277-292, 2009.
LEAL, A. A.; MANGOLIN, C. A.; AMARAL JÚNIOR, A. T.; GONÇALVES, L. S. A.; SCAPIM, C. A.; MOTT, A. S.; ELOI, I. B. O.; CORDOVÉS, V.; SILVA, M. F. P. Efficiency of RAPD versus SSR markers for determining genetic diversity among popcorn lines. Genetics and Molecular Research, v. 9, n. 1, p. 9-18, 2010.
OLIVEIRA, E. C.; AMARAL JÚNIOR, A. T.; GONÇALVES, L. S. A.; PENA, G. F.; FREITAS JÚNIOR, S. P.; RIBEIRO, R. M.; PEREIRA, M. G. Optimizing the efficiency of the touchdown technique for detecting inter-simple sequence repeat markers in corn (Zea mays). Genetics and Molecular Research, v. 9, n. 2, p. 835-842, 2010.
PEAKALL, R.; SMOUSE, P. E.; HUFF, D. R. Evolutionary implications of allozyme and RAPD variation in diploid populations of Buffalograss (Buchloë dactyloides (Nutt.) Engelm.). Molecular Ecology, v. 4, n. 2, p. 135-147, 1995.
PEAKALL, R.; SMOUSE, P. E. GENALEX 6: genetic analysis in Excel. Population genetic software for teaching and research. Molecular Ecology Notes, v. 6, n. 1, p. 288-295, 2006.
PÉREZ, O. J.; DAMBIER, D.; OLLITRAULT, P.; COPPENS, D. G.; BROTTIER, P.; FROELICHER, Y.; RISTERUCCI, A. M. Sequências de clones com região microssatélite. Available from: <http://www.ncbi.nlm.nih.gov>. Access on: 20 Jan. 2006. REIF, J. C.; MELCHINGER, A. E.; FRISCH, M. Genetical and mathematical properties of similarity and dissimilarity coefficients applied in plant breeding and seed bank management. Crop Science, v. 45, n. 1, p. 1-7, 2005.
SANTOS, S. C.; RUGGIERO, C.; SILVA, C. L. S. P.; LEMOS, G. M. A microsatellite library for Carica papaya
L. cv Sunrise Solo. Revista Brasileira de Fruticultura, v. 25, n. 2, p. 263-267, 2003.
SCHLÖTTERER, C. The evolution of molecular markers – just a matter of fashion? Nature Reviews,n. 5, v. 1, p. 63-69, 2004.
SCHULMAN, A. H. Molecular markers to assess genetic diversity. Euphytica, v. 158, n. 3, p. 313-321, 2007. SMOUSE, P. E.; PEAKALL, R. Spatial autocorrelation analysis of individual multiallele and multilocus genetic structure. Heredity, v. 82, n. 5, p. 561-573, 1999.
VARSHNEY, R. K.; GRANER, A.; SORRELL, M. E. Genic microsatellite markers in plants: features and applications. Trends in Biotechnology, v. 23, n. 1, p. 48-55, 2005.
ZANE, L.; BARGELLONI, L.; PATARNELLO, T. Strategies for microsatellite isolation: a review. Molecular Ecology, v. 11, n. 1, p. 1-16, 2002.
Received on November 15, 2010. Accepted on November 29, 2010.