Vol. 53, n. 1: pp.19-26, January-February 2010
ISSN 1516-8913 Printed in Brazil BRAZILIAN ARCHIVES OF
BIOLOGY AND TECHNOLOGY
A N I N T E R N A T I O N A L J O U R N A L
Effects of Wastewater from a Cassava Industry on Soil
Chemistry and Crop Yield of Lopsided Oats (Avena strigosa
Schreb.)
Juarez Rogério Cabral
1, Paulo Sérgio Lourenço Freitas
2*, Altair Bertonha
2andAntônio
Saraiva Muniz
21Departamento de Engenharia Agrícola; Universidade Estadual de Maringá; Cidade Gaúcha - PR - Brasil. 2
Departamento de Agronomia; Universidade Estadual de Maringá; Av. Colombo, 5790; Maringá - PR - Brasil
ABSTRACT
This experiment was carried out in the Arenito soil of the Cidade Gaúcha county, Northwest Paraná in Brazil, in which 0, 150, 300, 450 and 600 m3 ha-1 of wastewater were applied onto soil and the crop yield and soil chemistry were investigated for lopsided oat (Avena strigosa Schreb.) plants. The crop yield from the control was 2818 kg ha-1 contrasting 3629 kg ha-1 when 300 m3 ha-1 of cassava wastewater were applied, and potassium, after haversting, was the only nutrient found in a higher concentration in the soil profile.
Key words: Effluents, wastewaters, irrigation, fertirrigation
* Author for correspondence: pslfreitas@uem.br
INTRODUCTION
Data from the FAO (2004) show that the world production of cassava tuberous roots has increased, especially in the African countries, where the crop is the main energy source for a large part of the population. In 1970, cassava tuberous root production was 96.9 million tons and in 2002, it reached 184.7 million tons, with a 90.6% increase in the 32 year period in the World. In Brazil, the total production of cassava roots in the 2004/2005 was 27.66 million tons in an area of 1.94 million hectares, with an average yield of 14.25 t ha-1 Paraná State presented a production of
4.18 million tons in an area of 205 thousand hectares with an average yield of 20.37 t ha-1
(Sangrilo et al., 2006) being the highest index in Brazil. This is still low considering the cassava productivity potential (Sagrilo et al., 2002). The
idea is not new of using industrial effluents as a complementary source of water and nutrients for fertirrigation, and the study of alternatives of using nutrients derived from effluents.
Freitas et al. (2004) assessed the effect of applying four depths of wastewater from swine activities in the production of corn for silage.
The treatments consisted of applying depths proportional to the evotranspiration of the reference crop (ET0) 0.5, 1.0, 1.5 and 2.0. Wastewater application resulted in a 51% yield increase compared to the control. It was observed that the potassium concentration increased after the application.
Paula et al. (1999) assessed vinasse as potassium source for a pineapple crop and its effect on the chemical characteristics of the soil. The treatments consisted of four levels of vinasse 0, 100, 200 and
concentration was detected in the 0.00-0.20m and 0.20-0.40m layers.
The objective of this study was to assess the influence of applying different levels of wastewater from a cassava industry on lopsided oat production, and its residual effect on the soil chemical properties.
MATERIAL AND METHODS
The experiment was carried out on the Campus do Arenito – Maringá State University, Cidade Gaúcha county, latitude 23°22'30'' South, longitude 52°56'00'' West and average altitude of 404m. The soil is classified as Dystrophic Red Latosol, derived from Caiuã sandstone.
Soil fertility analysis
To assess the soil fertility, samples of soil were removed before sowing and after cutting from four depths, 0.00-0.05m; 0.05-0.10m; 0.10-0.20m and 0.20-0.40m in a total of 160 samples.
The soil was sampled after harvest to assess the residual effect of applying wastewater from a cassava industry on the soil fertility.
The lopsided oats were cut and soil samples were collected, as carried out in the first cut before applying the wastewater.
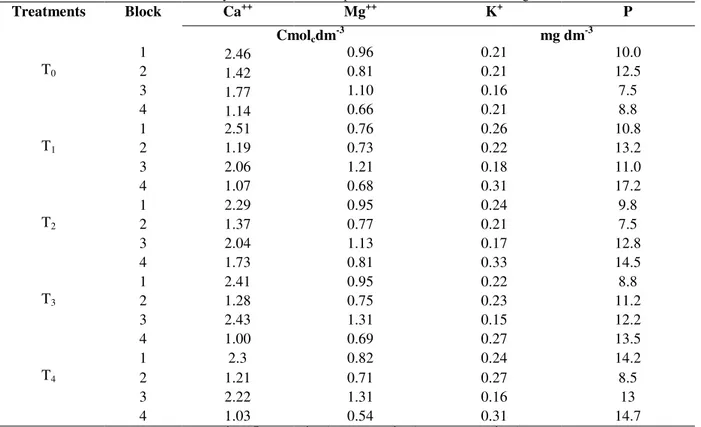
Table 1 shows the results of the chemical analysis of the soil obtained before sowing the lopsided oat crop. Statistical analysis was made of the data of the elements to detect whether the differences among the quantities of these nutrients among the treatments presented statistical differences by the Tukey test at the level of 5%.
Table 1 - Results of the chemical analysis of soil of the experimental units before sowing.
Ca++ Mg++ K+ P
Treatments Block
Cmolcdm-3 mg dm-3
1 2.46 0.96 0.21 10.0
2 1.42 0.81 0.21 12.5
3 1.77 1.10 0.16 7.5
T0
4 1.14 0.66 0.21 8.8
1 2.51 0.76 0.26 10.8
2 1.19 0.73 0.22 13.2
3 2.06 1.21 0.18 11.0
T1
4 1.07 0.68 0.31 17.2
1 2.29 0.95 0.24 9.8
2 1.37 0.77 0.21 7.5
3 2.04 1.13 0.17 12.8
T2
4 1.73 0.81 0.33 14.5
1 2.41 0.95 0.22 8.8
2 1.28 0.75 0.23 11.2
3 2.43 1.31 0.15 12.2
T3
4 1.00 0.69 0.27 13.5
1 2.3 0.82 0.24 14.2
2 1.21 0.71 0.27 8.5
3 2.22 1.31 0.16 13
T4
4 1.03 0.54 0.31 14.7
Treatments T0 = Control (water) and T1 = 150 m3 ha-1, T2 = 300 m3 ha-1 , T3 = 450 m3 ha-1 and T4 = 600 m3 ha-1 (Cassava industry wastewater).
Crop installation
The conventional soil preparation system was used to install the lopsided oat crop, using a plow with a disk plow, plowing grid and grader.
The lopsided oat crop was sown by hand in 2m x
Fertilizer was applied at the quantity of 100 kg.ha-1
NPK (N – P2O5 – K2O) using the formula 4-20-20
when the lopsided oats were sown.
four replications. The treatments with defined as
follows: T0 – Control and cassava industry
wastewater application on the other treatments with the following quantities: T1 – 150 m3 ha-1, T2
-300 m3 ha-1, T3-450 m3 ha-1 and T4- 600 m3 ha-1.
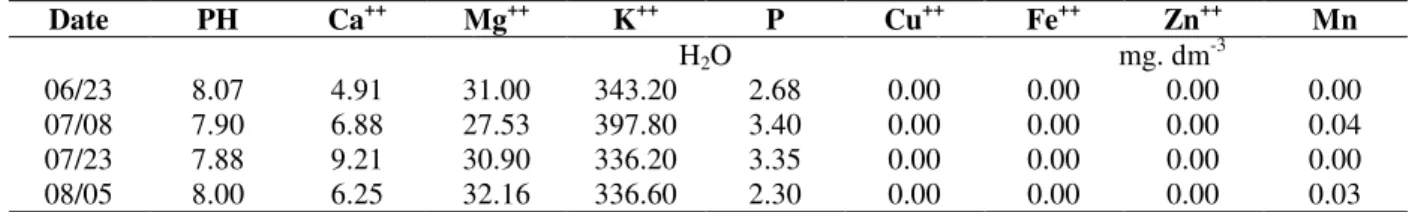
Table 2 shows results of the analysis and nutrients present in the applied wastewater. Chemical analysis was performed for each application of wastewater in the experimental plots.
The wastewater used was from the last stabilization lake of the treatment system used by the cassava industry. The treatment system consisted of six stabilization lakes.
In first application, 60 liters of wastewater were applied to each plot (150 m3 ha-1). The same
quantity of water was applied in the control T0. It
was observed that it was not possible to apply the wastewater in a single application because of the low infiltration capacity of the soil and therefore, 10 liters were applied to each plot to the end of all the blocks. The process was the repeated starting at the first plot and the whole application was made on the same day.
In the second application, sixty liters of wastewater were applied to each plot. In the control T0 and in the treatment T1, the same
quantity of water was applied and after the application; there was 47.4mm precipitation. In the third application, sixty liters of wastewater were applied to each plot, except for treatments T0,
T1 and T2, where the same quantity of water was
applied.
In the fourth level, sixty liters from the sixth treatment lake were applied to each plot, except for the treatments T0, T1, T2 e T3, to which the
same quantity of water was applied. In this period, the soil moisture was low according to the soil water balance. It was decided to anticipate application and end the water deficit in the soil. The green matter was collected 74 days after sowing from 1m2 of the central area of each plot
and weighed. The sides were discounted, because they were considered borders. The plants were then dried in the sun and later taken to dry in a forced air circulation chamber at 65°C to obtain the dry matter.
Table 2 - Wastewater analysis.
Date PH Ca++ Mg++ K++ P Cu++ Fe++ Zn++ Mn
H2O mg. dm-3
06/23 8.07 4.91 31.00 343.20 2.68 0.00 0.00 0.00 0.00
07/08 7.90 6.88 27.53 397.80 3.40 0.00 0.00 0.00 0.04
07/23 7.88 9.21 30.90 336.20 3.35 0.00 0.00 0.00 0.00
08/05 8.00 6.25 32.16 336.60 2.30 0.00 0.00 0.00 0.03
RESULTS AND DISCUSSION
Yield
Wastewater application caused increases in the yield of lopsided oats, whose data fitted a quadratic regression, with significance by the F test at a level of 1% for quadratic regression. (Fig. 1).
Given the fitted regression equation, the maximum yield value occurred for the 376 m3 ha-1 level that resulted in a maximum yield of 3795 kg ha-1, a
value much below the productive potential.
The addition of nutrients from wastewater application in the plots did not present increase in great nutrient quantities in soil, except for the element potassium where the addition was up to a maximum of 212 kg ha-1 dry matter.
Soil nutrients
Calcium
The calcium concentration in the cassava industry wastewater was 6.8 mg dm-3 in the soluble form.
This element is not considered pollutant or toxic from the environmental point of view. Monitored only by its real importance, it belongs to the group of the macronutrients from the agronomic point of view.
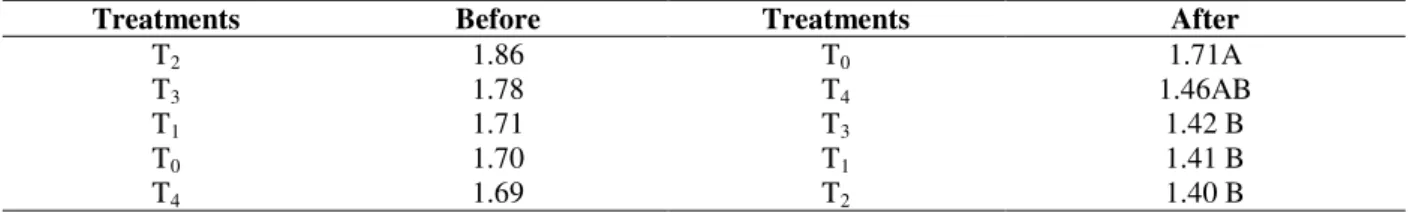
present in the soil and, before sowing the lopsided oats, the calcium values detected in the soil were not different statistically by the Tukey test at the level of 5% probability. The greatest value detected was 1.86 cmolc dm-3 in the T2 treatment
plot while the smallest value, 1.69 cmolc dm-3 was
detected in the T4 treatment. The difference was
0.7 cmolc dm-3.
Regarding the values shown in Table 3, after cutting the lopsided oats, statistical differences were detected at the level of 5% probability by the Tukey test in the T0 and T3 treatments compared to
the other treatments. The T2 treatment presented
highest yield value (Fig. 1) and treatment T0 the
smallest value. The calcium values detected in the soil after the harvest, and the smallest and highest calcium values, respectively, were observed in the T0 and T2 plots, because there were reductions in
the calcium level in all the treatments after harvesting the lopsided oats.
Table 4 shows reduction in the calcium values in all the depths analyzed, comparison before sowing and after harvest.
DM= 2890,25 + 5,003 X - 0,0064 X2 R2 = 0,95
2000 2500 3000 3500 4000
0 100 200 300 400 500 600
Wastewater applied (m3 ha-1 )
D
M
(k
g
ha
-1 )
Figure 1 - Average dry matter yield values obtained in the field and estimated.
Table 3 - Calcium content (Cmolc dm-3) in the soil before sowing and after harvesting in the different treatments.
Treatments Before Treatments After
T2 1.86 T0 1.71A
T3 1.78 T4 1.46AB
T1 1.71 T3 1.42 B
T0 1.70 T1 1.41 B
T4 1.69 T2 1.40 B
Table 4 - Calcium content (Cmolc dm-3) in the soil.
Depth (m) Before After
0.05 – 0.10 1.96 A 1.61 A
0.00 – 0.05 1.90 A 1.60 A
0.10 – 0.20 1.75 A 1.55 A
0.20 – 0.40 1.38B 1.16B
Potassium
A high concentration of potassium was observed in the cassava industry wastewater of 353.45 mg dm-3. For the 150, 300, 450 and 600 m3 ha-1 levels,
applications of 53.02, 106.04, 159.06 and 212.07
Table 5 - Potassium contents in the soil (Cmolc dm-3).
Treatments Before Treatments After
T1 0.24 A T3 0.25 A
T4 0.24 A T4 0.25 A
T2 0.23 A T2 0.23 AB
T3 0.22 AB T1 0.22 AB
T0 0.19 B T0 0.19 B
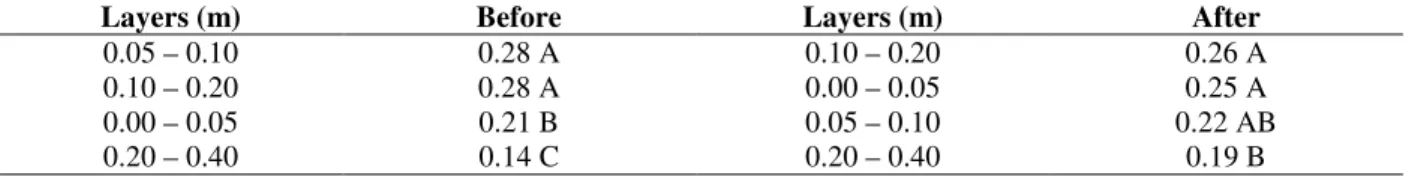
Table 6 - Potassium contents in the soil (Cmolc dm-3).
Layers (m) Before Layers (m) After
0.05 – 0.10 0.28 A 0.10 – 0.20 0.26 A
0.10 – 0.20 0.28 A 0.00 – 0.05 0.25 A
0.00 – 0.05 0.21 B 0.05 – 0.10 0.22 AB
0.20 – 0.40 0.14 C 0.20 – 0.40 0.19 B
From the environmental point of view, CONAMA, according to CETESB (1990) and CONAMA (2005) did not report potassium as a pollutant element or parameter, even for the special class and others. Thus, the conditioning of the maximum limit was not observed for use for disposal, and its variation, fluctuation and especially concentration were not assessed.
Table 7 shows the average values of potassium contents (Cmolc dm-3) in the soil after sowing and
after harvest of lopsided oats in the 20 to 40 cm layer in the treatments.
Statistical analysis of the difference of potassium in the soil showed significance at the level of 5% by the Tukey test for depths.
Table 7 showed that there were increases in all the plots, with potassium lixiviation in the 0.20-0.40m layer.
The increase in the potassium contents was an indication of potassium movement that was expected in the soil because it had low CEC. Regarding the other elements, there was alteration in function of the addition that was because their contents were low in the water (Table 2). This was also observed by Freitas et al. (2004), Paula et al. (1999) and Silva (2003).
Phosphorus
Regarding phosphorus, Feigin et al. (1991) stated that the phosphorus present substances such as fertilizer, organic corrective and effluents, when
applied or thrown on the soil, soon became an integrated part of the soil phosphorus. Yaron et al. (1996) also stated that the application of phosphorus to the soil, such as in fertilizers, organic matter or effluents, resulted in immediate increase in the level of soluble phosphorus in water in the soil, probably because of its low mobility.
The analysis of the wastewater showed that it was very poor in phosphorus (2.93 mg L-1). The 0.44;
0.88; 1.31 and 1.80 kg ha-1 levels applied of
wastewater and formula addition resulted in a 20 kg ha-1 phosphorus concentration.
From the point to view of the environmental resolution in force (CETESB, 1990), there is no report in article 21 of parameter or substance that should present the maximum admissible value of the element phosphorus, phosphate or similar for release in a body of water. Excess phosphorus only becomes visible as a pollutant after lixiviation or removal in mud slides to the lakes, causing the eutrophism of these receptor bodies.The average values of phosphate contents in the soil before sowing and after harvest in the treatments are shown in Table 8.
Table 7 - Potassium contents (Cmolc dm-3) in the soil, before sowing and after harvest, in each treatments at the
0.20-0.40m depth.
Before After
T0 T1 T2 T3 T4 T0 T1 T2 T3 T4
Average 0.11 0.16 0.14 0.17 0.13 0.16 0.2 0.17 0.19 0.27
Table 8 - Phosphate contents (mg dm-3) in the soil.
Treatments Before Treatments After
T1 13.06 T1 11.63 A
T4 12.63 T0 11.13 AB
T3 11.44 T3 10.63 AB
T2 11.13 T4 9.56 AB
T0 9.69 T2 6.81 B
Table 9 - Phosphorous content (mg dm-3)of the soil.
Layers (m) Before After
0.00 – 0.05 14.95 A 13.60 A
0.05 – 0.10 14.85 A 13.15 A
0.10 – 0.20 11.20 B 8.70 B
0.20 – 0.40 5.35 C 4.35 C
Magnesium
Statistical difference was not obtained for the magnesium among the treatments before sowing the lopsided oat crop and it could be inferred that the difference in yield among the treatments could not be explained by the difference in the soil fertility in the experimental plots, in statistical analysis.
The magnesium is not reported as pollutant by the
environmental legislation in CONAMA
Resolution 357/2005, which is why it is exempted from the requirements for the waters, including class one or special, which are those destined for domestic supply, without prior or only simple
disinfectant and/or for preservation of the natural equilibrium of the aquatic communities.
Another important factor to be emphasized is that with the increase in pH magnesium remains in the insoluble form. Chan et al. (1979) showed that in the soils with pH dependency or variable load, magnesium was exchangeable when the pH value was below 6.0 and was not exchangeable with pH over 6.5.
Average values of the exchangeable magnesium in the soil at depth from 0-0.40 m and the exchangeable magnesium contents in the soil at the different depths before sowing and before sowing are shown in Tables 10 and 11.
Table 10 - Exchangeable magnesium contents (Cmolc dm-3).
Treatments Before Treatments After
T3 0.924 T0 0.844A
T2 0.914 T4 0.781AB
T0 0.881 T3 0.767AB
T1 0.844 T1 0.737B
T4 0.844 T2 0.689B
Table 11 - Exchangeable magnesium contents in the soil (Cmolc dm-3).
Layers (m) Before e Layers (m) After
0.05-0.10 0.948A 0.00-0.05 0.888A
0.00-0.05 0.930A 0.05-0.10 0.821A
The relationship between the lopsided oat crop yields and exchangeable magnesium present was analyzed for the treatments and no tendency was detected that related lopsided oat yield with the quantity of magnesium in the soil. For all the layers analyzed, 0.00-0.05 m, 0.05-010 m, 0.10-0.20 m and 0.10-0.20-0.40 m, the data dispersion did not allow inference on the influence of this element on lopsided oat yield.
pH
Regarding pH, Braile and Cavalcanti (1979) stated that the hydrogenionic concentration was an important parameter of industrial waste quality. The range of concentration suitable for life to exist
or for application on the soil, without harming the receptor medium, was very narrow and critical.
Wastes with unsuitable hydrogen ion
concentration are difficult to treat by biological methods. When reporting on the pH in the cassava industry wastewater, it was observed that it presented a basic characteristic and average of 7.96 pH.
PH values in water in the soil before sowing were not statistically different (p>0,05) for the treatments by the Tukey test (Table 12) and the mean value obtained showed that the pH in the soil remained close to 7.0. No statistical difference was observed for the pH when the depths were compared (Table 13).
Table 12- pH in water in the soil before sowing and after harvest in the different treatments.
Treatments Before Treatments After
T1 6.937A T0 6.869A
T4 6.937A T3 6.831A
T0 6.925A T4 6.819A
T3 6.831A T2 6.781A
T2 6.831A T1 6.750A
Table 13 - pH means in water in the soil before sowing and after harvest in the different collection layers.
Layers (m) Before Layers (m) After
0.10-0.20 6.910A 0.00-0.05 6.840A
0.05-0.10 6.875A 0.05-0.10 6.825A
0.20-0.40 6.865A 0.10-0.20 6.800A
0.00-0.05 6.860A 0.20-0.40 6.775A
Mean pH values in water in the soil after harvest in the different treatments are shown in Table 13.
Relationship between the lopsided oat crop yields and the pH in water in soil in the conditions studied. The minimum pH value was 6.3 and the maximum 7.6.
Statistical analysis for the soil pH values: No statistical difference was observed between the two collections, although the wastewater, as shown in Table 3, presented values highest than 7. Nevertheless, if the pH of the wastewater was alkaline, the quantities applied were not sufficient to interfere in the soil pH.
CONCLUSIONS
From the results, it was concluded that:
- Cassava industry wastewater application increased lopsided oat crop yield and a yield of
3629 kg ha-1 was obtained for the 300 m3 ha-1;
level;
- When the values of the elements found at the different depths were analyzed, only potassium presented increase along the soil profile while the others presented reduction.
RESUMO
município de Cidade Gaúcha, com a cultura da aveia preta, avaliando-se os efeitos dos níveis de água residuária (0, 150, 300, 450 e 600 m3ha-1)
como também os efeitos residuais da sua aplicação no solo. O objetivo deste trabalho foi o de avaliar a influência da aplicação de diferentes níveis de água residuária de fecularia de mandioca na produção de aveia preta, bem como seu efeito residual nas propriedades químicas do solo. a aplicação de água residuária de fecularia de mandioca, proporcionou acréscimos na produtividade da cultura da aveia, obtendo-se a produtividade de 3629 kg ha-1 para o nível de 300 m3 ha-1 e 2818 kg ha-1 na
testemunha quando se analisaram os valores dos elementos encontrados nas camadas, somente o potássio apresentou acréscimos nas camadas, sendo que os demais apresentaram redução.
REFERENCES
Braile, P. M.; Cavalcanti, J. E. W. A. Manual de tratamento de águas residuárias industriais. São Paulo: CETESB, 1979.
CONAMA (2005). Disponível em:< http://www.mma.gov.br/port/conama/res/res05/res 35705.pdf. Acesso em 20 de setembro de 2005. CETESB. Legislação estadual: Leis, decretos, etc. -
Controle de poluição ambiental - Estado de São Paulo (atualizado até julho, 1990) - Série Documentos, São Paulo, CETESB, 1990.
Chan, K. Y.; Davey, B. G.; Geering, H. R. (1979). Adsortion of magnesium and calcium by a soil with variable charge. Soil Sci. Soc. Am. J. Madison, ,43, 301-304.
FAO PRODUCTION YEARBOOK. Rome: FAO, 2004.
Feigin, A; Ravina, I; Shalhevet, J (1991). Irrigation with treated sewage effluent: management for environmental protection. Berlin: Springer-Verlag, 224p.
Freitas, W.S.; Oliveiras, R.A.; Pinto, F.A.; Cecon, P.R.; Galvão, J.C.C.(2004) Efeito da aplicação de águas residuárias de suinocultura sobre a produção do milho para silagem. Revista Brasileira de Engenharia Agrícola e Ambiental, Campina Grande, 8, 120-125.
Imhoff, K.; Imhoff, K. R. Manual de Tratamento de Águas Residuárias. Ed. Edgard Blucher Ltda. Brasil, 1986.
Paula, M.B.; Holanda, F.S.R.; Mesquita, H.A.; Caravalho, V.D. (1999), Uso da vinhaça no abacaxizeiro em solo de baixo potencial de produção. Pesq. Agropec. Bras. , 34, 1217-1222. Sagrilo, E.; Vidigal Filho, P. S.; Pequeno, M. G.;
Scapim, C. A.; Gonçalves-Vidigal, M. C.; Souza Diniz, P. S. S.; Modesto, E. C. and Kvitschal, M. V. Effect of Harvest Period on the Quality of storage roots and protein content of the leaves in five cassava cultivars (Manihot esculenta, Crantz). Brazilian Arch. Biol. Tech., 46 (2), 295-305. Sagrilo, E. ; Vidigal Filho, P. S.; Equeno, M. G.;
Vidigal, M. C. G.; Scapim, C. A.; Kvitschal, M. V.; Maia, R. R.; Rimoldi, F. Effect of harvest period on foliage production and dry matter distribution in five cassava cultivars during the second plant cycle. Braz. Arch. Biol. Tech., 49(6), 107-1018. Silva, F. F. da (2003). Impacto da aplicação de
efluente de fecularia de mandioca em solo e na cultura do sorgo (sorghum bicolor). Dissertação Mestrado, Universidade Estadual de Maringá, Maringá, Brazil.
Yaron, B.; A. Calvet, R.; Prost, R. Soil pollution – processes and dynamics. Springer – Verlag Berlin Heidelberg, Berlin, 1996.