Comparison of different criteria used to categorize technological quality of pork
Comparação de diferentes critérios utilizados para classificar a qualidade tecnológica da carne suína
Henrique Pereira CazedeyI Robledo de Almeida Torres FilhoII Paulo Rogério FontesIII
Alcinéia de Lemos Souza RamosI Eduardo Mendes RamosI* ISSN 1678-4596
ABSTRACT
Pork may be classified into quality categories according to its color, texture and exudation, though no international consensus criterion has been reached yet. Thus, the aim of the present paper was to examine the relation between important meat quality traits, evaluating pork quality classification of a same data by different criteria proposed in the literature. In 60 pork loins (Longissimus thoracis muscle), initial pH (pH45min)
and R-value were evaluated after 45min post mortem between the 9th and 10th ribs, and ultimate pH (pH
24h), objective color
and water-holding capacity were evaluated 24h post mortem in two 2.54cm thick steaks cut between the 9th and 11th ribs to be
classified into PSE (pale, soft and exudative), RSE (reddish-pink, soft and exudative), RFN (reddish-pink, firm and non-exudative) or DFD (dark, firm and dry) quality. Frequency distributions of quality categories differed (P<0.001) among criteria, which resulted in large variations: 3 to 68% PSE; 0 to 73% RSE; 5 to 68% RFN; 0 to 22% DFD; and 0 to 33% unclassified samples. A same sample may be classified into different quality categories according to the criterion utilized, which results in large variations in frequency distributions and also in quality attributes. Therefore, the classification of pork quality depends on the adopted criterion, which indicated the need for international standardization, so that pork quality can be determined efficiently and effectively.
Key words: PSE, DFD meat, color, exudation, pH.
RESUMO
A carne suína pode ser classificada em categorias de qualidade de acordo com sua cor, textura e exsudação, embora ainda não exista um critério internacional consensual. Desse modo, o objetivo do presente artigo foi verificar a relação entre importantes características de qualidade de carne, avaliando a classificação da qualidade da carne suína de um mesmo banco
de dados por diferentes critérios propostos na literatura. Em 60 lombos (músculo Longissimus thoracis), pH inicial (pH45min) e
Valor R, foram avaliados 45 minutos post mortem entre a 9a e a 10a
costelas, e pH final (pH24h), cor objetiva e capacidade de retenção
de água foram avaliados 24 horas post mortem, em dois bifes, com 2,54cm de espessura, cortados, entre a 9a e a 11a costelas,
para serem classificados como PSE (pálida, flácida e exsudativa), RSE rosada, flácida e exsudativa), RFN (vermelho-rosada, firme e não-exsudativa) ou DFD (escura, firme e seca). As distribuições de frequência das categorias de qualidade diferiram (P<0,001) entre os critérios, resultando em grandes variações: 3 a 68% PSE; 0 a 73% RSE; 5 a 68% RFN; 0 a 22% DFD; e 0 a 33% de amostras não classificadas. Uma mesma amostra pode ser classificada em diferentes categorias de qualidade, de acordo com o critério utilizado, o que resulta em grandes variações nas distribuições de frequência e também nos atributos de qualidade. Portanto, a classificação da qualidade da carne suína é dependente do critério adotado, evidenciando a necessidade de uma padronização internacional para a identificação eficiente e eficaz da qualidade da carne suína.
Palavras-chave: carne PSE e DFD, cor, exsudação, pH.
INTRODUCTION
Pork may be classified into different
quality categories according to its color, texture and exudation. Top-quality meat has a reddish-pink color,
firm texture and normal exudation (RFN), which is considered ideal for producers and consumers. Anomalous conditions may provide pale, soft and exudative (PSE), reddish-pink, soft and exudative
IDepartamento de Ciência dos Alimentos (DCA), Universidade Federal de Lavras (UFLA), PO Box 3037, 37200-000, Lavras, MG, Brasil.
E-mail: [email protected]. *Corresponding author.
IIInstituto de Ciências Exatas e Tecnológicas, Universidade Federal de Viçosa (UFV), Florestal, MG, Brasil.
IIIDepartamento de Tecnologia de Alimentos, Universidade Federal de Viçosa (UFV), Viçosa, MG, Brasil.
(RSE) or dark, firm and dry (DFD) meat, which present bad appearance for consumers and are unsuitable for processing (WARNER et al., 1993; RAMOS & GOMIDE, 2007; BARBUT et al., 2008). The PSE condition is one of the major problems faced by the meat industry, and because of its economic
importance and high occurrence, this phenomenon has
been studied for many years (WARRISS & BROWN, 1987; WARNER et al., 1993; WARNER et al., 1997; HUFF-LONERGAN & LONERGAN, 2005; TAO & PENG, 2014). Brazilian research studies have reported the incidence of 10.1% (SANTIAGO et al., 2012), 22.8% (MAGANHINI et al., 2007) and 46.4% (CULAU et al., 2002) of PSE in meat industries in the south of the country.
Although the pH at 45min post mortem
(pH45min) can be used as an indicator of the PSE
condition, its application is limited, because it
did not allow for the prediction of all quality categories (RAMOS & GOMIDE, 2007). Besides, low correlations between pH45min and subjectively
determined quality have been discouraging
(SOMERS et al., 1985; JOO et al., 2000). To classify the pork in different quality categories, several criteria have been proposed (HONIKEL & FISHER, 1977; BENDALL & SWATLAND, 1988; KAUFFMAN et al., 1993; WARNER et al., 1993; WARNER et al., 1997; MAGANHINI et al., 2007; FAUCITANO et al., 2010), but there is no international consensus on what criteria should be used.
The classification ability depends on the quality attributes utilized in the characterization of pork, which could explain the wide variation in the incidence of PSE reported in the literature. Many quality attributes have been utilized to classify pork,
e.g.: only pH45min (BENDALL and SWATLAND,
1988); pH45min and R-value (HONIKEL & FISHER,
1977); only lightness (L*) (MAGANHINI et al.,
2007); pHat 24h post mortem (pH24h), L* and
water-holding capacity (WHC), measured by percentage drip loss (PDL) (WARNER et al., 1997) or filter-paper wetness (FPW) (FAUCITANO et al., 2010); only L*
and PDL (KAUFFMAN et al., 1993); and only L*
and FPW (WARNER et al., 1993). Therefore, the aim of the present paper was to examine the relation between important meat quality traits, evaluating the pork quality classification of a same data by different
criteria proposed in the literature.
MATERIALS AND METHODS
Samples from 60 pigs (commercial cross Large White x Landrace) weighing 105±10kg were
obtained (from 11 to 21 March 2014) in an abattoir located in Lavras, MG, Brazil. After 45min post mortem, the initial pH (pH45min) and the R-value
were determined in the Longissimus thoracis
muscle between the 9th and 10th ribs. Carcasses were
identified and kept refrigerated (1±1°C) for 24h, when two 2.5 cm thick steaks between the 9th and
11th ribs were removed, packed and transferred to the
Laboratory of Meat and Meat Products (LabCarnes) at the Universidade Federal de Lavras for analysis of ultimate pH (pH24h), instrumental color (CIELAB)
and water-holding capacity (WHC).
The pH45min and pH24h were measured 45min and 24h post mortem, respectively, by a portable pH
meter HI99163 (Hanna Instruments) using a probe with stainless steel blade. The R-value was measured
45min post mortem, in triplicate, according to the
methodology described by HONIKEL & FISHER (1977). Meat color was evaluated 24h post mortem
using a spectrophotometer CM-700 (Konica Minolta) with 8-mm aperture size, specular component excluded (SCE), illuminant D65 and 10º angle of
observer. After blooming for 30min, the CIE L*a*b*
color coordinates were obtained from the average of five readings taken at different positions on the exposed meat surface (RAMOS & GOMIDE, 2007).
Pork water-holding capacity (WHC) was
evaluated 24h post mortem by percentage drip loss
(PDL) and filter-paper wetness (FPW) methods. The FPW test was performed according to the methodology described by KAUFFMAN et al. (1986), with some modifications. After 2.54cm thick steak was exposed to the environment at room temperature (~20ºC) for 30min (blooming), a preweighed qualitative filter paper (125mm in diameter, Whatman® Grade 1) was
placed on the meat surface for 3s and then weighed again. The FPW was expressed as the weight (mg) of the absorbed exudate. The PDL test was measured as the percentage of the weight loss of a standardized (about 40g) muscle sample during its suspension in a plastic pot for 48h at 4°C (HONIKEL et al., 1986).
Samples were classified into the following quality categories: PSE (pale, soft and exudative), RSE (red, soft and exudative), RFN (red, firm and non-exudative), or DFD (dark, firm and dry), according
to pH24h, L* and WHC (PDL or FPW) parameters
proposed by different criteria obtained from the literature (Table 1). Samples were also classified
based on: the pH45min, defined by BENDALL &
SWATLAND (1988) as PSE (pH45min<5.80) and RFN
(pH45min>5.80); and pH45min and R-value, described by
HONIKEL & FISHER (1977) as PSE (R-value>1.05
(R-value>1.05 and pH45min>5.95). Samples that
were not classified into any of these categories were identified as “unclassified” (UC).
The statistical analyses were performed on the software SAS 9.2 (SAS Institute Inc., Cary, NC, USA) at a significance level of 5%. The chi-square test (χ²) was applied to evaluate the frequency distributions of the pork quality categories among the evaluated criteria. For each criterion obtained in the literature, analysis of variance (ANOVA) and, when necessary, Tukey test were used to evaluate the differences of the quality attributes among the pork quality categories, excluding the unclassified samples. Pearson’s correlation analysis was also performed among the quality attributes, whose coefficients (r)
were tested by Student’s t-test.
RESULTS AND DISCUSSION
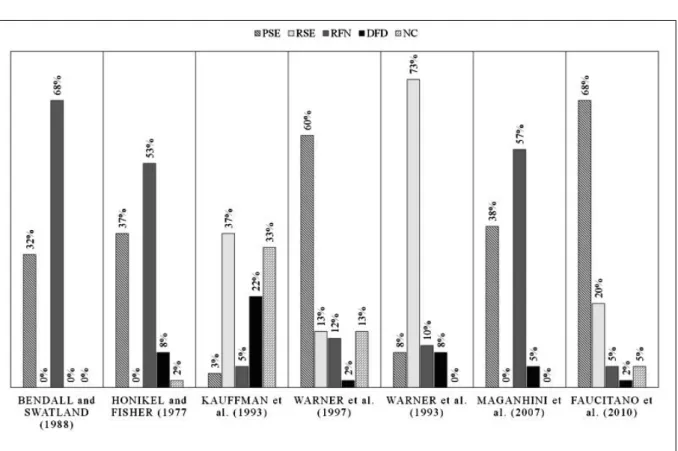
The frequency distributions of the pork quality categories differed (χ²=511.11; P<0.001)
among the evaluated criteria. Samples were classified into different categories according to the adopted criterion, which resulted in large variations in frequency distributions (Figure 1). Depending on the criterion adopted, 3 to 68% of the samples can be classified as PSE, whereas 5 to 68% of the samples can be classified as RFN. Among the criteria that contained RSE and DFD categories, up to 73% of the samples can be classified as RSE, whereas up to 22% of the samples can be classified as DFD.
WARNER et al. (1997) and FAUCITANO et al. (2010) suggested a classification based on pH24h,
L* and WHC (PDL or FPW), though it is hard for a
sample to meet, at the same time, the three parameters
of a same category. So, these two criteria were the most strict regarding the pork quality, classifying 60 to 68% of the samples as PSE and 73 to 88% of them as soft and exudative (PSE + RSE).
The pH and L* values is known to be strong
related to WHC, but the magnitude of correlation differs between studies (OTTO et al., 2004). In the
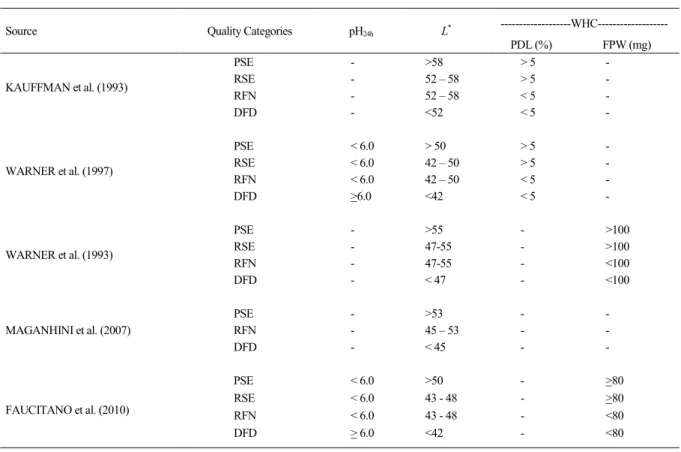
Table 1 -Classification of pork quality according to ultimate pH, lightness (L*) and water holding capacity (WHC) parameters proposed by criteria obtained from the literature.
---WHC---Source Quality Categories pH24h L*
PDL (%) FPW (mg)
PSE - >58 > 5
-RSE - 52 – 58 > 5
-RFN - 52 – 58 < 5
-KAUFFMAN et al. (1993)
DFD - <52 < 5
-PSE < 6.0 > 50 > 5
-RSE < 6.0 42 – 50 > 5
-RFN < 6.0 42 – 50 < 5
-WARNER et al. (1997)
DFD >6.0 <42 < 5
-PSE - >55 - >100
RSE - 47-55 - >100
RFN - 47-55 - <100
WARNER et al. (1993)
DFD - < 47 - <100
PSE - >53 -
-RFN - 45 – 53 -
-MAGANHINI et al. (2007)
DFD - < 45 -
-PSE < 6.0 >50 - >80
RSE < 6.0 43 - 48 - >80
RFN < 6.0 43 - 48 - <80
FAUCITANO et al. (2010)
DFD > 6.0 <42 - <80
present study, the highest correlations were (P<0.05)
observed between pH45min and WHC (-0.52 for PDL
and -0.53 for FPW) as well as between L*
values and
WHC (0.62 for PDL and 0.53 for FPW). Correlations of pH45min and WHC were higher to the values (r=-0.34
to -0.48) observed by DE VRIES et al. (1994), OTTO et al. (2004) and VAN OECKEL et al. (1999) when WHC was measured by PDL method, but similar to those values (r=-0.41 to -0.57) reported by DE VRIES et al. (1994) and VAN OECKEL et al. (1999) when FPW method was used. The correlations between L* values
and WHC were also higher than values (r=0.38 to 0.52) reported in the literature (DE VRIES et al., 1994; HUFF-LONERGAN et al., 2002; OTTO et al., 2004). These results confirmed that paler meat is
related to higher drip loss.
KAUFFMAN et al. (1993) and WARNER et al. (1993)’s criteria are based only on L*
and
WHC (by PDL or FPW method), not considering
pH24h. The criterion proposed by KAUFFMAN
et al. (1993) showed the highest frequency of
DFD (22%) and unclassified (33%) samples. The unclassified samples occurred because they had L*
values lower than 52 but with PDL higher than 5%. In contrast, the criterion proposed by WARNER et al. (1993) was able to classify all samples, wherein 73% of them were RSE. Lower values for the L* parameters proposed by these authors
in relation to those proposed by KAUFFMAN et al. (1993) caused the differences in the frequency distributions, because 82% of the samples met concurrently the WHC parameters of a same class for both criteria. Moreover, despite being different methods, PDL and FPW were moderately correlated (r=0.67; P<0.05).
Conversely, through the criteria based only on pH45min, on pH45min and R-value (HONIKEL
& FISHER, 1977) and only on L* (MAGANHINI
et al., 2007), most of the samples (53 to 68%) were classified as RFN, whereas a large part of them (32 to 38%) was classified as PSE. Inclusion of the R-value along with pH45min increased the categorization as Figure 1 - Frequency distributions of the pork quality categories according to the criteria obtained in the literature (n = 60). PSE = pale,
PSE by 5% and as DFD by 8%, thereby reducing the percentage of RFN, probably because 75% of the samples were classified in the same manner in both criteria. However, the frequency distribution according to the criterion of MAGANHINI et al. (2007) almost did not differ from these two previous criteria. Between pH45min and R-value were reported a
moderate correlation (r=-0.63; P<0.05), while none
(P>0.05) correlations were observed between L* and
pH45min or R-value.
Quality attributes were also evaluated among the quality categories for each criterion (Tables 2 and 3). A same sample may be classified into different quality categories according to the criterion utilized; and therefore, the criteria showed different responses, i.e., the quality attributes
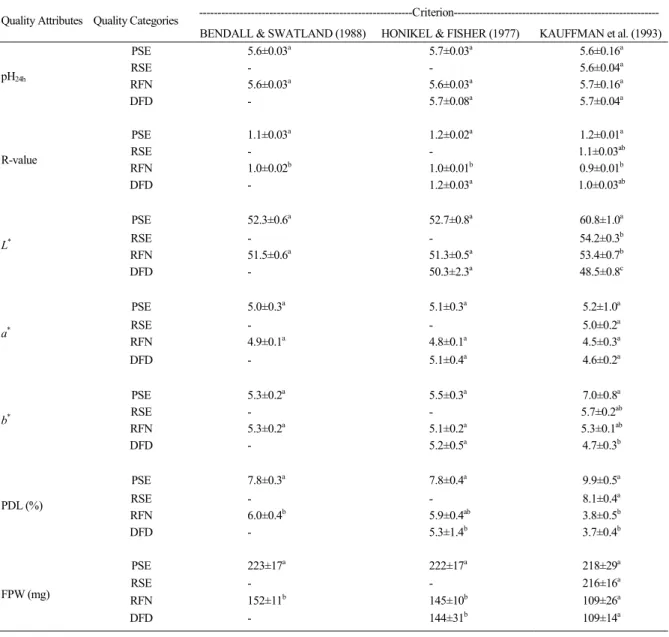
Table 2 -Quality attributes (mean ± standard error) of the pork quality categories for the criteria proposed by BENDALL & SWATLAND (1988),
HONIKEL & FISHER (1977), and KAUFFMAN et al. (1993)
---Criterion---Quality Attributes ---Criterion---Quality Categories
BENDALL & SWATLAND (1988) HONIKEL & FISHER (1977) KAUFFMAN et al. (1993)
PSE 5.6±0.03a 5.7±0.03a 5.6±0.16a
RSE - - 5.6±0.04a
RFN 5.6±0.03a 5.6±0.03a 5.7±0.16a
pH24h
DFD - 5.7±0.08a 5.7±0.04a
PSE 1.1±0.03a 1.2±0.02a 1.2±0.01a
RSE - - 1.1±0.03ab
RFN 1.0±0.02b 1.0±0.01b 0.9±0.01b
R-value
DFD - 1.2±0.03a 1.0±0.03ab
PSE 52.3±0.6a 52.7±0.8a 60.8±1.0a
RSE - - 54.2±0.3b
RFN 51.5±0.6a 51.3±0.5a 53.4±0.7b
L*
DFD - 50.3±2.3a 48.5±0.8c
PSE 5.0±0.3a 5.1±0.3a 5.2±1.0a
RSE - - 5.0±0.2a
RFN 4.9±0.1a 4.8±0.1a 4.5±0.3a
a*
DFD - 5.1±0.4a 4.6±0.2a
PSE 5.3±0.2a 5.5±0.3a 7.0±0.8a
RSE - - 5.7±0.2ab
RFN 5.3±0.2a 5.1±0.2a 5.3±0.1ab
b*
DFD - 5.2±0.5a 4.7±0.3b
PSE 7.8±0.3a 7.8±0.4a 9.9±0.5a
RSE - - 8.1±0.4a
RFN 6.0±0.4b 5.9±0.4ab 3.8±0.5b
PDL (%)
DFD - 5.3±1.4b 3.7±0.4b
PSE 223±17a 222±17a 218±29a
RSE - - 216±16a
RFN 152±11b 145±10b 109±26a
FPW (mg)
DFD - 144±31b 109±14a
PSE = pale, soft and exudative; RSE = reddish-pink, soft and exudative; RFN = reddish-pink, firm and non-exudative; DFD = dark, firm and dry. L* = lightness; a*
= redness; b*
= yellowness; PDL = percentage drip loss; and FPW = filter-paper wetness. a-c Values for each quality attribute, within a column, with different superscripts differ significantly at P
varied by pork quality categories depending on the adopted criterion.
The pH45min (BENDALL & SWATLAND,
1988) and pH45min and R-value (HONIKEL &
FISHER, 1977) criteria did not differentiate (P>0.05)
the pH24h between the quality categories. This can
be explained by the absence (P>0.05) of correlation
between pH45min and pH24h. In addition, the pH24h
was not used as a parameter in these criteria or even those proposed by KAUFFMAN et al. (1993)
and WARNER et al. (1993), which also did not differentiate (P>0.05) the pH
24h between the quality
categories. Still, the pH24h (5.9 to 6.0) of the DFD
category for the criteria proposed by WARNER et al. (1997) and MAGANHINI et al. (2007) was higher (P<0.05) than the other categories (5.4 to 5.7);
whereas by FAUCITANO et al. (2010)’s criterion, DFD had a higher (P<0.05) pH
24h than PSE and RSE
(mean of 5.6±0.02), while the pH24h of RFN was
similar (P>0.05) to the others.
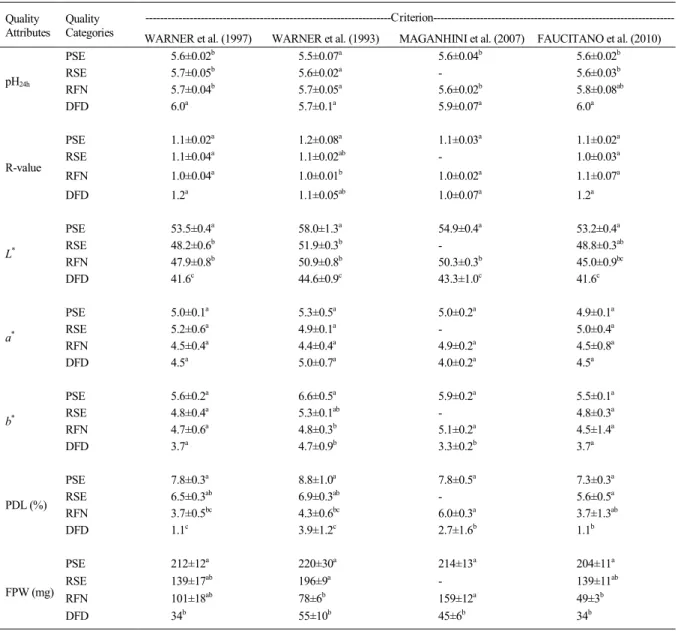
Table 3 - Quality attributes (mean ± standard error) of the pork quality categories for the criteria proposed by WARNER et al. (1993; 1997),
MAGANHINI et al. (2007) and FAUCITANO et al. (2010).
---Criterion---Quality
Attributes Quality
Categories WARNER et al. (1997) WARNER et al. (1993) MAGANHINI et al. (2007) FAUCITANO et al. (2010)
PSE 5.6±0.02b 5.5±0.07a 5.6±0.04b 5.6±0.02b
RSE 5.7±0.05b 5.6±0.02a - 5.6±0.03b
RFN 5.7±0.04b 5.7±0.05a 5.6±0.02b 5.8±0.08ab
pH24h
DFD 6.0a 5.7±0.1a 5.9±0.07a 6.0a
PSE 1.1±0.02a 1.2±0.08a 1.1±0.03a 1.1±0.02a
RSE 1.1±0.04a 1.1±0.02ab - 1.0±0.03a
RFN 1.0±0.04a 1.0±0.01b 1.0±0.02a 1.1±0.07a
R-value
DFD 1.2a 1.1±0.05ab 1.0±0.07a 1.2a
PSE 53.5±0.4a 58.0±1.3a 54.9±0.4a 53.2±0.4a
RSE 48.2±0.6b 51.9±0.3b - 48.8±0.3ab
RFN 47.9±0.8b 50.9±0.8b 50.3±0.3b 45.0±0.9bc
L*
DFD 41.6c 44.6±0.9c 43.3±1.0c 41.6c
PSE 5.0±0.1a 5.3±0.5a 5.0±0.2a 4.9±0.1a
RSE 5.2±0.6a 4.9±0.1a - 5.0±0.4a
RFN 4.5±0.4a 4.4±0.4a 4.9±0.2a 4.5±0.8a
a*
DFD 4.5a 5.0±0.7a 4.0±0.2a 4.5a
PSE 5.6±0.2a 6.6±0.5a 5.9±0.2a 5.5±0.1a
RSE 4.8±0.4a 5.3±0.1ab - 4.8±0.3a
RFN 4.7±0.6a 4.8±0.3b 5.1±0.2a 4.5±1.4a
b*
DFD 3.7a 4.7±0.9b 3.3±0.2b 3.7a
PSE 7.8±0.3a 8.8±1.0a 7.8±0.5a 7.3±0.3a
RSE 6.5±0.3ab 6.9±0.3ab - 5.6±0.5a
RFN 3.7±0.5bc 4.3±0.6bc 6.0±0.3a 3.7±1.3ab
PDL (%)
DFD 1.1c 3.9±1.2c 2.7±1.6b 1.1b
PSE 212±12a 220±30a 214±13a 204±11a
RSE 139±17ab 196±9a - 139±11ab
RFN 101±18ab 78±6b 159±12a 49±3b
FPW (mg)
DFD 34b 55±10b 45±6b 34b
PSE = pale, soft and exudative; RSE = reddish-pink, soft and exudative; RFN = reddish-pink, firm and non-exudative; DFD = dark, firm and dry. L*
= lightness; a*
= redness; b*
= yellowness; PDL = percentage drip loss; and FPW = filter-paper wetness.
Only WARNER et al. (1997) and FAUCITANO et al. (2010) utilized the pH24h as one
of their parameters to classify the pork quality, which, in addition of MAGANHINI et al. (2007)’s criterion,
separated the pH24h of the DFD category from the
others. Although the rate of initial pH decrease can allow the detection of PSE meat, the DFD category
is usually detected by the pH24h, wherein a higher
average value (>6.0) is observed in DFD meats than in the others categories (RAMOS & GOMIDE, 2007). However, none of these criteria could differentiate satisfactorily both initial and ultimate pH among the quality categories. KAUFFMAN et al. (1993) demonstrated that measurement of pH24h alone is not a
reliable indicator for predicting ultimate pork quality. As expected, RFN had a lower (P<0.05) R-value than PSE and DFD (mean of 1.2±0.02) by the criterion proposed by HONIKEL & FISHER (1977). According to these authors, RFN meats usually have a lower R-value than the others pork quality categories. However, for the KAUFFMAN et al. (1993) and WARNER et al. (1993)’s criteria, the R-value of RSE (1.1) and DFD (1.0 to 1.1) were similar (P>0.05) to those
of the other categories, while PSE (1.1 to 1.2) had a greater (P<0.05) R-value than RFN (0.9 to 1.0). In contrast, WARNER et al. (1997), MAGANHINI et al. (2007) and FAUCITANO et al. (2010)’s criteria did not differentiate (P>0.05) the R-value among the quality categories.
According to the criteria proposed by
KAUFFMAN et al. (1993), WARNER et al. (1997), WARNER et al. (1993) and MAGANHINI et al. (2007), DFD (41.6 to 48.5) had (P<0.05) lower L*
values than the meats with a red color (RFN and RSE; 47.9 to 54.2), which had (P<0.05) lower L* values
than PSE meat (53.5 to 60.8). This was expected since
all these criteria used L* values as one the parameters
to classify the pork quality. However, although the criterion proposed by FAUCITANO et al. (2010) was also able to determine differences of lightness (L*) among the quality categories (Table 3), it was
not able to distinguish the red meat from pale meat (RSE from PSE) and also the red meat from dark meat (RFN from DFD). For the criteria that do not
use L* as parameter of evaluation, the pH
45min alone
and pH45min and R-value did not distinguish (P>0.05)
the L* values between the quality categories (mean of
51.7±0.5), which may be explained by no correlation (P>0.05) observed between L*
and pH45min or R-value.
For redness (a* value), none of the criteria
differentiated (P>0.05) samples among the quality
categories, while for yellowness (b* value) only
KAUFFMAN et al. (1993), WARNER et al. (1993) and MAGANHINI et al. (2007)’s criteria were able to
differentiate them. By these criteria, DFD (3.3 to 4.7) showed (P<0.05) lower yellowness than PSE (5.3 to 7.0); whereas, RSE (5.3 to 5.7) was similar (P>0.05) to
both. The response shown by the RFN category varied according to the criterion; it was similar to DFD, to PSE, or both, depending on the adopted criterion.
The differentiation of WHC, which were measured by PDL or FPW methods, among the quality categories, was the most dependent on the criterion adopted. All criteria showed some distinction among the quality categories, except for that proposed by KAUFFMAN et al. (1993), which did not differentiate FPW. Overall, as expected, DFD showed (P<0.05) lower PDL (1.1 to 5.3) and FPW (34 to 144) than PSE (7.3 to 9.9 for PDL and 198 to 220 for FPW) meat. Nevertheless, the PDL and FPW of RFN and RSE meats varied with the criteria, whose values were similar to DFD, to PSE, to adjacent categories, or to both PSE and DFD, according to the criterion adopted. A likely explanation for this is that PDL and FPW were correlated (P<0.05) with each other (r=0.67) and with practically
all parameters of the evaluated criteria, except (P>0.05)
with pH24h. This would explain the wide variation in the
response shown by PDL and FPW among the quality categories for the evaluated criteria (Tables 2 and 3).
CONCLUSION
A same sample could be classified into different quality categories according to the criterion utilized, which results in large variations in the frequency distributions and quality attributes. Therefore, the classification of pork quality depends on the adopted criterion, which indicated the need for
international standardization so that the pork quality
can be determined efficiently and effectively.
ACKNOWLEDGEMENTS
The authors would like to thank the Conselho Nacional de Desenvolvimento Científico e Tecnológico (CNPq) for their financial support (MCT/CNPq 476355/2012-5) and the Conselho Nacional de Desenvolvimento Científico e Tecnológico (CNPq), Fundação de Amparo à Pesquisa do Estado de Minas Gerais (FAPEMIG) and Coordenação de Aperfeiçoamento de Pessoal de Nível Superior (CAPES) for the scholarship granted to the first (PIBIC/CNPq) and third (BPD-00398-13; post-doctoral PMPD II CAPES/FAPEMIG) authors.
REFERENCES
BARBUT, S. et al. Progress in reducing the pale, soft and exudative (PSE) problem in pork and poultry meat. Meat Science, v.79,
n.1, p.46-63, 2008. Available from: <http://dx.doi.org/10.1016/j.
BENDALL, J.R.; SWATLAND, H.J. A review of the relationships of pH with physical aspects of pork quality. Meat Science,v.24, n.2, p.85-126,
1988. Available from:
<http://dx.doi.org/10.1016/0309-1740(88)90052-6>. Accessed: Out. 02, 2015. doi:10.1016/0309-1740(88)90052-6.
CULAU, P.O.V. et al. Effect of the Halothane Gene on the Quality
of Pork. Revista Brasileira de Zootecnia, v.31, p.954-961, 2002.
DE VRIES, A.G. et al. Genetic parameters of pork quality and
production traits in Yorkshire populations. Livestock Production Science, v.40, n.3, p.277-289, 1994. Available from: <http://dx.doi.
org/10.1016/0301-6226(94)90095-7>. Accessed: Out. 04, 2015. doi: 10.1016/0301-6226(94)90095-7.
FAUCITANO, L. et al. Shelf life of pork from five different quality
classes. Meat Science, v.84, n.3, p.466-469, 2010. Available from:
<http://dx.doi.org/10.1016/j.meatsci.2009.09.017>. Accessed:
Out. 10, 2015. doi: 10.1016/j.meatsci.2009.09.017.
HONIKEL, K.O. et al. Sarcomere shortening of prerigor muscles and its influence on drip loss. Meat Science, v.16, n.4, p.267-282, 1986.
Available from:
<http://dx.doi.org/10.1016/0309-1740(86)90038-0>. Accessed: Out. 02, 2015. doi: 10.1016/0309-1740(86)90038-0.
HONIKEL, K.O.; FISHER, C.A. A rapid method for the detection
of PSE and DFD porcine muscles. Journal of Food Science, v.42,
n.7, p.1633-1636, 1977.
HUFF-LONERGAN, E. et al. Correlations among selected pork
quality traits. Journal of Animal Science, v.80, n.3, p.617-627, 2002.
HUFF-LONERGAN, E.; LONERGAN, S.M. Mechanisms of water-holding capacity of meat: The role of postmortem
biochemical and structural changes. Meat Science, v.71, n.1,
p.194-204, 2005. Available from: <http://dx.doi.org/10.1016/j.
meatsci.2005.04.022>. Accessed: Out. 02, 2015. doi: 10.1016/j. meatsci.2005.04.022.
JOO, S.T. et al. Objectively predicting ultimate quality of post-rigor pork musculature: I. Initial comparison of techniques. Asian-Australasian Journal of Animal Sciences, v.13, n.1, p.68-76,
2000. Available from: <http://dx.doi.org/10.5713/ajas.2000.68>.
Accessed: Out. 04, 2015. doi: 10.5713/ajas.2000.68.
KAUFFMAN, R.G. et al. A comparison of methods to estimate
water-holding capacity in post-rigor porcine muscle. Meat
Science, v.18, n.4, p.307-322, 1986. Available from: <http://dx.doi.
org/10.1016/0309-1740(86)90020-3>. Accessed: Out. 04, 2015. doi: 10.1016/0309-1740(86)90020-3.
KAUFFMAN, R.G. et al. The effectiveness of examining early
post-mortem musculature to predict ultimate pork quality. Meat Science, v.34, n.3, p.283-300, 1993. Available from: <http://dx.doi.
org/10.1016/0309-1740(93)90078-V>. Accessed: Nov. 01, 2015.
doi: 10.1016/0309-1740(93)90078-V.
MAGANHINI, M.B. et al. Meats PSE (Pale, Soft, Exudative) and DFD (Dark, Firm, Dry) of an industrial slaughterline for swine
loin. Ciência e Tecnologia de Alimentos, v.27, p.69-72, 2007.
OTTO, G. et al. Comparison of different methods for determination of drip loss and their relationships to meat quality
and carcass characteristics in pigs. Meat Science, v.68, n.3,
p.401-409, 2004. Available from: <http://dx.doi.org/10.1016/j.
meatsci.2004.04.007>. Accessed: Nov. 01, 2015. doi: 10.1016/j. meatsci.2004.04.007.
RAMOS, E.M.; GOMIDE, L.A.M. Avaliação da qualidade de
carnes: fundamentos e metodologias. Viçosa: UFV, 2007. 599p.
SANTIAGO, J.C. et al. Incidência da carne PSE (pale, soft, exsudative) em suínos em razão do tempo de descanso pré-abate e
sexo. Arquivo Brasileiro de Medicina Veterinária e Zootecnia, v.64, p.1739-1746, 2012.
SOMERS, C. et al. Evaluation of some objective methods for
measuring pork quality. Meat Science, v.15, n.2, p.63-76, 1985.
Available from:
<http://dx.doi.org/10.1016/0309-1740(85)90047-6>. Accessed: Out. 01, 2015. doi: 10.1016/0309-1740(85)90047-6.
TAO, F.; PENG, Y. A method for nondestructive prediction of pork meat quality and safety attributes by hyperspectral
imaging technique. Journal of Food Engineering, v.126, n.0,
p.98-106, 2014. Available from: <http://dx.doi.org/10.1016/j. jfoodeng.2013.11.006>. Accessed: Out. 01, 2015. doi: 10.1016/j. jfoodeng.2013.11.006.
VAN OECKEL, M.J. et al. Comparison of different methods for measuring water holding capacity and juiciness of pork versus
on-line screening methods. Meat Science, v.51, n.4,
p.313-320, 1999. Available from: <
http://dx.doi.org/1740(98)00123-5>. Accessed: Out. 02, 2015. doi: 10.1016/S0309-1740(98)00123-5.
WARNER, R.D. et al. Muscle protein changes post mortem in
relation to pork quality traits. Meat Science, v.45, n.3,
p.339-352, 1997. Available from: <
http://dx.doi.org/10.1016/S0309-1740(96)00116-7>. Accessed: Nov. 03, 2015. doi:
10.1016/S0309-1740(96)00116-7.
WARNER, R.D. et al. Quality attributes of major porcine muscles:
A comparison with the Longissimus Lumborum. Meat Science,
v.33, n.3, p.359-372, 1993. Available from: <http://dx.doi.
org/10.1016/0309-1740(93)90007-5>. Accessed: Out. 03, 2015. doi: 10.1016/0309-1740(93)90007-5.
WARRISS, P.D.; BROWN, S.N. The relationships between
initial pH, reflectance and exudation in pig muscle. Meat
Science, v.20, n.1, p.65-74, 1987. Available from: <http://dx.doi.
org/10.1016/0309-1740(87)90051-9>. Accessed: nov. 04, 2015.