Cláudia Catarina da Costa Ralo
Licenciatura em Ciências da Engenharia Química eBioquímica
Coupling Organic Substrate Removal to
Methane Production in a Fully
Biological Microbial Electrolysis Cell
Dissertação para obtenção do Grau de Mestre em Engenharia Química e Bioquímica
Orientador: Mauro Majone, Professor Associado,
Sapienza Univeristy of Rome
Co-orientador: Marianna Villano, Doutora, Sapienza
University of Rome
Júri:
Presidente: Prof. Doutora Isabel Maria Rola Coelhoso Arguente: Doutor Svetlozar Gueorguiev Velizarov
Vogais: Prof. Doutora Maria Ascensão Carvalho Fernandes Miranda Reis Prof. Doutor Mauro Majone
Copyright Cláudia Catarina da Costa Ralo, FCT-UNL, UNL
Os direitos de cópia da dissertação intitulada “Coupling Organic Substrate Removal to Methane Production in a Fully Microbial Electrolysis Cell” pertencem ao autor, à Faculdade de Ciências e Tecnologia e à Universidade Nova de Lisboa.
A Faculdade de Ciências e Tecnologia e a Universidade Nova de Lisboa têm o direito, perpétuo
e sem limites geográficos, de arquivar e publicar esta dissertação através de exemplares
impressos reproduzidos em papel ou de forma digital, ou por qualquer outro meio conhecido ou
que venha a ser inventado, e de a divulgar através de repositórios científicos e de admitir a sua
cópia e distribuição com objectivos educacionais ou de investigação, não comerciais, desde que
Aknowledgments
The accomplishment of this thesis would not be possible without the contributions of some
individuals, to whom I would like to thank.
I would like to express my deep gratitude to Professor Mauro Majone and Professor Maria
Ascensão Reis for the opportunity to have this experience abroad.
I would like to demonstrate my sincere appreciation to Doctor Marianna Villano and Professor
Mauro Majone, my supervisors, for the invaluable support, scientific guidance, and for always
have shared their knowledge and gave me the best advices. To Roberta Verdini and Stefano
Scardala for all the patience and attention. To all the members of Lab 026 for kindly integrated
me.
To Professor Mario Beccari, Professor Daniela Ferro and Professor Joaquim Vital, for the help
and advices on specific parts of this work.
To my family, for their understanding, endless patience and encouragement when it was most
required! A special thank you to my brother João.
To my friends for always being there. And a very special thank you to my university friends, for
Resumo
As células de electrólise microbiana (CEMs) são uma técnica inovadora e emergente
fundamentada na utilização de eléctrodos de estado sólido, que estimulam o metabolismo
microbiano para o tratamento de efluentes e produção paralela de produtos de valor
acrescentado (como o metano).
Neste trabalho estudou-se o desempenho de uma CEM composta por duas câmaras, onde no
ânodo ocorria a oxidação da matéria orgânica e no cátodo a produção de metano. O inóculo do
ânodo era composto por lamas activadas, enquanto o do cátodo consistia em lamas anaeróbicas
que continham microorganismos metanogénicos. Durante a operação, o bioânodo foi
alimentado continuamente, com soluções sintéticas em meio anaeróbico basal sendo a carga
orgânica de cerca de 1 g L-1 d-1, referente à Carência Química de Oxigénio (CQO). No início
(ensaio I), o alimento consistia principalmente em acetato sendo posteriormente substituído por
uma mistura mais complexa (ensaio II), que continha outros compostos orgânicos solúveis para
além deste. Para ambas as condições, o potencial do ânodo foi controlado a -0.1 V vs. eléctrodo padrão de hidrogénio, através de um potencióstato. Durante o ensaio I, mais de 80% do acetato
fornecido ao sistema foi anaerobicamente oxidado no ânodo, e a corrente eléctrica resultante foi
recuperada como metano no cátodo (obtendo uma eficiência de captura catódica (ECC) de cerca
de 115%). Nestas condições obteve-se cerca de 170 % de eficiência energética média do sistema
(i.e., a energia recuperada como metano relativamente à energia fornecida). No entanto, o
desempenho do reactor diminuiu no decorrer deste ensaio. Ao longo do ensaio II, observou-se
uma oxidação de substrato acima dos 60% (referente à CQO). A corrente eléctrica produzida
(com uma eficiência coulombica de 57%) foi também recuperada como metano, sendo a ECC
de 90%. Neste ensaio, a eficiência energética da CEM foi aproximadamente 170%. Durante
toda a experiência, observou-se um crescimento de biomassa muito reduzido no ânodo, por sua
vez o ião amónio foi transferido através da membrana catiónica e concentrou-se no cátodo. Com
o objectivo de obter uma visão mais aprofundada do desempenho do reactor, realizaram-se
provas com marcador e análises de microscopia electrónica de varrimento.
Em conclusão, este estudo sugere o enorme potencial da CEM no tratamento de águas residuais
de baixa carga orgânica, aliando uma elevada eficiência energética à baixa produção de lamas.
Termos-chave: Célula de Electrólise Microbiana, tratamento de águas residuais, oxidação de
Abstract
Microbial electrolysis cells (MECs) are an innovative and emerging technique based on the use
of solid-state electrodes to stimulate microbial metabolism for wastewater treatment and
simultaneous production of value-added compounds (such as methane).
This research studied the performance of a two-chamber MEC in terms of organic matter oxidation (at the anode) and methane production (at the cathode). MEC‟s anode had been previously inoculated with an activated sludge, whereas the cathode chamber inoculum was an
anaerobic sludge (containing methanogenic microorganisms). During the experimentation, the
bioanode was continuously fed with synthetic solutions in anaerobic basal medium, at an
organic load rate (OLR) of around 1 g L-1 d-1, referred to the chemical oxygen demand (COD).
At the beginning (Run I), the feeding solution contained acetate and subsequently (Run II) it
was replaced with a more complex solution containing soluble organic compounds other than
acetate. For both conditions, the anode potential was controlled at -0.1 V vs. standard hydrogen electrode, by means of a potentiostat. During Run I, over 80% of the influent acetate was
anaerobically oxidized at the anode, and the resulting electric current was recovered as methane
at the cathode (with a cathode capture efficiency, CCE, accounting around 115 %). The average
energy efficiency of the system (i.e., the energy captured into methane relative to the electrical
energy input) under these conditions was over 170%. However, reactor‟s performance decreased over time during this run. Throughout Run II, a substrate oxidation over 60% (on
COD basis) was observed. The electric current produced (57% of coulombic efficiency) was also recovered as methane, with a CCE of 90%. For this run the MEC‟s average energy efficiency accounted for almost 170 %. During all the experimentation, a very low biomass
growth was observed at the anode whereas ammonium was transferred through the cationic
membrane and concentrated at the cathode. Tracer experiments and scanning electron
microscopy analyses were also carried out to gain a deeper insight into the reactor performance
and also to investigate the possible reasons for partial loss of performance.
In conclusion, this research suggests the great potential of MEC to successfully treat
low-strength wastewaters, with high energy efficiency and very low sludge production.
Keywords: Microbial electrolysis cell, wastewater treatment, organic matter oxidation,
Table of Contents
1. Literature Review 1
1.1. Bioelectrochemical Systems 2
1.1.1. Microbial Fuel Cell – electricity generation 3
1.1.2. Microbial Electrolysis Cell – hydrogen generation 6 1.2. Coupling organic substrate removal to methane production 8
2. Research objectives 13
3. Materials and methods 15
3.1. Microbial electrolysis cell design and setup 15
3.2. Microbial electrolysis cell operation 17
3.3. Tracer experiment 19
3.4. Control and data acquisition 24
3.4.1. Potentiostatic system 24
3.5. Analytical measurements 25
3.5.1. Methane and hydrogen determination 25
3.5.2. Acetate determination 26
3.5.3. Ammonium ion determination 26
3.5.4. Suspended solid determination 27
3.5.5. Chemical Oxygen Demand determination 27
3.5.6. Bromide anion determination 28
3.5.7. Scanning electron microscopy analyses 28
3.6. Calculations 28
4. Results 31
4.1. Microbial electrolysis cell (MEC) 31
Run I: Performance of the MEC fed with a synthetic solution containing acetate as sole carbon source (bioanode potential controlled at -0.1 V vs. SHE) 31 Run II: Performance of the MEC fed with a synthetic solution containing soluble organic compounds other than acetate (bioanode potential controlled at -0.1 V vs. SHE) 38
4.2. Hydrodynamic characterization of the bioanode 46
4.3. Scanning Electron Microscopy (SEM) 49
5. Discussion 51
5.1. Effect of the anode potential on the MEC performance 51
5.2. Effect of different substrates on MEC performance 54
5.3. Fluidynamic analysis of the MEC 57
6. Conclusive remarks and future perspectives 61
List of Figures
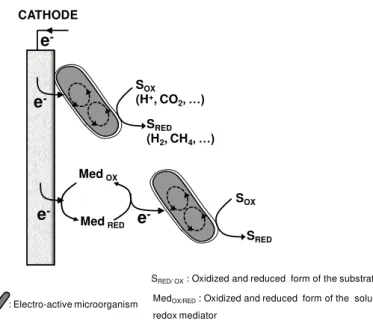
Figure 1.1 - Direct or mediated extracellular electron transfer mechanisms at the cathode of a
bioelectrochemical system. ... 2
Figure 1.2 - Schematics of a microbial fuel cell (MFC): at the anode, organic material from the wastewater is oxidized by electrochemically active microorganisms, which transfer the gained electrons to the electrode. Via an external circuit, the electrons are transported to the cathode, where are consumed for oxygen reduction... 4
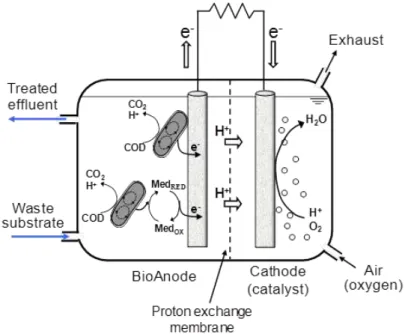
Figure 1.3 - Schematics of a microbial electrolysis cell (MEC): the electrons released at the anode from the oxidation of organic matter are exploited for proton reduction to hydrogen gas at the cathode. The cathodic reaction typically requires a catalyst to proceed... 7
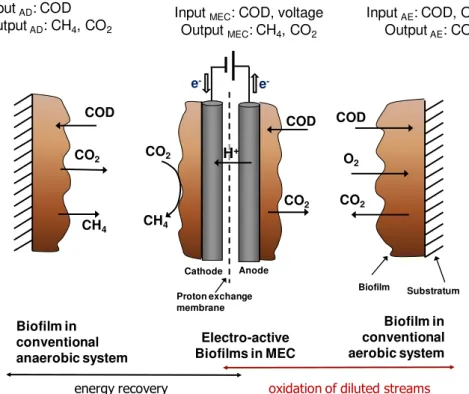
Figure 1.4 - Main features of conventional anaerobic and aerobic biofilm processes and electro-active biofilms in a methane-producing MEC (biomass growth was not considered in this simplified representation). ... 10
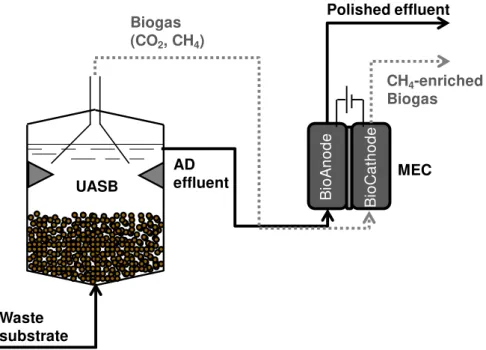
Figure 1.5 - Enhanced methane production and waste substrate removal through a coupled anaerobic digestion (AD) and methane-producing MEC: the AD liquid and gaseous effluents are further processed at the anode and the cathode of the MEC, respectively. ... 11
Figure 3.1 - Microbial electrolysis cell design. ... 15
Figure 3.2 - Structure of Nafion membrane. ... 15
Figure 3.3 - Schematic overview of the MEC anode compartment. ... 18
Figure 3.4 - Schematic overview of the MEC cathode compartment. ... 19
Figure 3.5 – Schematic representation of the theoretical model that had the better adjustment to the tracer experiment: combination of a PFR and a CSTR with stagnant zones. ... 20
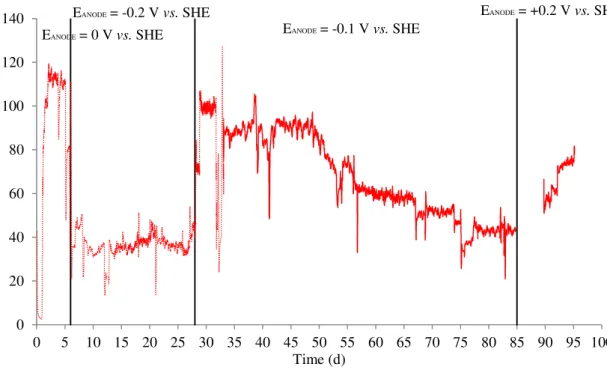
Figure 4.1 - Potential applied to the bioanode overtime. Run I of this experimentation started on day 33, when the bioanode potential was controlled at -0.1 V vs. SHE. ... 31
Figure 4.2 - Acetate concentration in the influent and effluent streams of MEC anode at different applied potentials (A). Percentage of acetate removal in the MEC at different applied potentials (B). The dashed line and the lighter points represent the data that is not reviewed in this study; the same succeed for the following graphics. ... 33
Figure 4.3 - Current generation by the activated sludge at different anode potentials. The dotted line represents the data collected on the first 33 days of the major run, and the continuous line represents the data referred to Run I. ... 34
Figure 4.4 - Coulombic efficiency over time at different studied potentials. ... 34
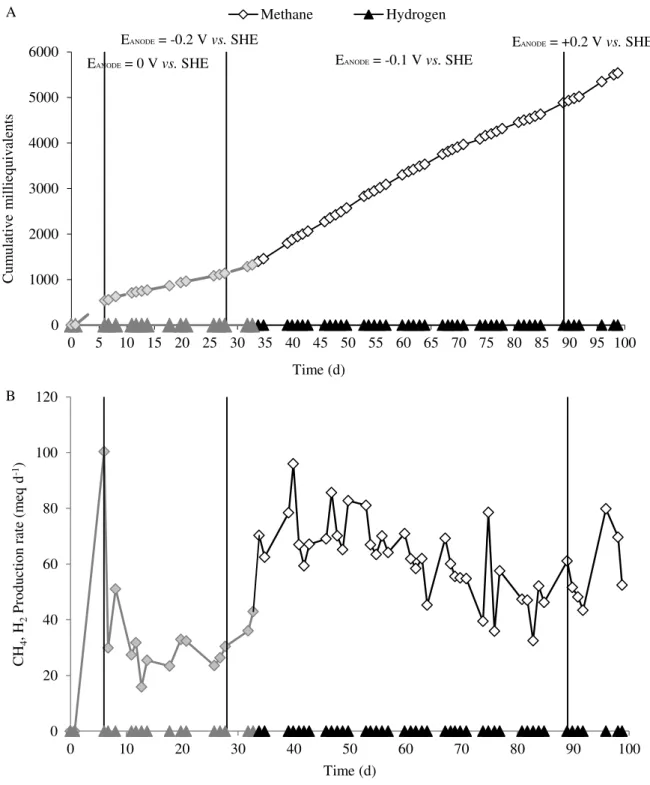
Figure 4.5 - Time course of cumulative methane and hydrogen production with the anode potential controlled at different values. In particular, Run I refers to the period that occurs from day 33 until day 85, when the anode potential was controlled at -0.1 V vs. SHE (A). Rate of methane and hydrogen production over time (B). ... 35
Figure 4.6 - Methane and hydrogen cathode capture efficiency during the MEC operation period... 36
Figure 4.8 - Current generation by the activated sludge at different anode potentials and OLR, before and during Run II. ... 39
Figure 4.9 - Acetate concentration in the influent and effluent streams of the MEC anode during Run II (A). Percentage of acetate removal in the reactor during Run 2 (B). ... 40
Figure 4.10 - COD concentration in the influent and effluent streams of the MEC anode during Run II (A). Percentage of COD removal in the reactor during Run II (B). ... 41
Figure 4.11 - Time course of anode's coulombic efficiency in the MEC, referred to the total COD depletion. ... 42
Figure 4.12 - Time course of the cumulative methane and hydrogen production throughout Run II (A). Rate of methane and hydrogen production over time (B). ... 43
Figure 4.13 - MEC cathode capture efficiency during the Run II. ... 44
Figure 4.14 - Ammonium nitrogen concentration at the anode (influent and effluent streams) and cathode chamber of the MEC, throughout Run II. ... 44
Figure 4.15 - Hydrodynamic response of the bioanode to tracer step-input as F(t) function at the end of Run I. The dashed curve represents the F(t) theoretical curve of the proposed
combination of ideal reactors. ... 47
Figure 4.16 - Hydrodynamic response of the bioanode to tracer step-input as F(t) function and normalized current generation after Run II. The dashed curve represents the F(t) theoretical curve of the proposed combination of ideal reactors. ... 48
Figure 4.17 - Scanning electron micrographs, near the inlet stream of the MEC: (A) unused graphite granule, (B) bacteria growing on a bioanode graphite granule, (C) bacteria growing on a biocathode graphite granule and (D) the anodic side of Nafion membrane. ... 50
Figure 4.18 - SEM images of graphite granules taken near the outlet of the MEC: (A) anode and (B) cathode. ... 50
Figure 5.1 - Performance of the MEC as a function of the set anode potential in terms of: generated electric current, acetate removal efficiency, and coulombic efficiency. ... 52
Figure 5.2 - Performance of the MEC as a function of the set anode potential in terms of average methane production rate and cathode capture efficiency. ... 53
Figure 5.3 - Performance of the MEC as a function of the set anode potential in terms of energy efficiency and acetate removal efficiency. ... 54
Figure 5.4 - Performance of the MEC anode with respect to the type of substrate. ... 55
Figure 5.5 - Performance of the MEC with respect to substrate type in terms of average methane production rate and cathode capture efficiency. ... 56
Figure 5.6 - Performance of the MEC with respect to substrate type in terms of energy
efficiency and acetate removal efficiency. ... 57
Figure 5.7 - Visible lack of graphite in the reactor chamber. ... 58
List of Tables
Table 3.1 - Anodic and cathodic reactions occuring in the MEC. ... 29
Table 4.1 - Steady-state nitrogen mass balance of the MEC. ... 37
Table 4.2 - Summary of the main parameters of the MEC operation throughout Run I and Run II. ... 45
Table 4.3 - Parameters estimated for the theoretical model adjusted to the first tracer
experiment. ... 46
Table 4.4 - Parameters estimated for the theoretical model adjusted to the second tracer
experiment. ... 48
List of Abbreviations
AD Anaerobic digestion
BES Bioelectrochemical systems
CCE Cathode capture efficiency (%)
CE Coulombic efficiency (%)
CEM Célula de electrólise microbiana
COD Chemical oxygen demand (g L-1 d-1)
CQO Carência química de oxigénio (g L-1 d-1)
CSTR Continuous-stirred tank reactor
ECC Eficiência de captura catódica (%)
FID Flame ionized detector
HRT Hydraulic retention time (h, d)
ISS Inert suspended solids (g L-1)
MDC Microbial desalination cell
MEC Microbial electrolysis cell
MFC Microbial fuel cell
MSC Microbial solar cell
OLR Organic load rate (kg COD m-3 d-1, gCOD L-1 d-1)
PEM Proton exchange membrane
PFR Plug-flow reactor
SEM Scanning electron microscopy
SHE Standard hydrogen electrode
TCD Thermal-conductivity detector
TSS Total suspended solids (g L-1)
VSS Volatile suspended solids (g L-1)
Nomenclature
Cross-sectional area (cm2)
C0 Initial concentration of the conservative tracer (g L
-1
)
C(t) Concentration of the tracer at time t (g L-1)
Concentration in the respective streams of the PFR/CSTR model (g L-1)
̅ Laplace transform of the outlet concentration of the PFR
̅ Laplace transform of the inlet concentration of the PFR
̅ Laplace transform of the concentration of the PFR Dispersion coefficient (cm2 s-1)
F Faraday constant (96 485 coulomb mole-1) Molar flow (mol s-1)
Current (ampere)
i(t) Current value at time t
imax Maximum value of current achieved
Distance (cm)
Cumulative charge (milliequivalents)
NAnode, in Quantity of nitrogen in the inlet stream of the anode (mgN d
-1
)
NAnode, out Quantity of nitrogen that comes out the reactor (mgN d
-1
)
NAnode→Cathode Quantity of nitrogen that flows from the anode to the cathode (mgN d-1)
Weight of the filter (mg)
Weight of the filter with sample (mg)
Weight of the filter with sample after treated (mg)
Electric charge (coulomb)
r CH4 Methane production rate (meq d
-1
, L L-1 d-1) Independent variable in the Laplace domain Time (s)
Linear flow rate (cm s-1) Volumetric flow rate (L s-1) Dimensionless distance
Greek Letters
Fraction of the CSTR volume Fraction of the stagnant zone volume Fraction of the flow rate
Gibbs free energy of methane oxidation (kJ mol-1)
Potential difference (V) Bed porosity
Energy efficiency (%) Dimensionless time Auxiliary variable Space time (s)
1.
Literature Review
A sustainable society requires an alternative to fossil fuels and lower levels of generated pollution. Currently the annual world‟s energy demand is estimated at 13 terawatts (TW), and an additional 10 TW are estimated to be needed by 2050, to meet the demands of projected
world population growth and lift the developing world out of poverty while also preserving the
current lifestyles of developed countries (Pant et al. 2011). Energy sources can be divided into
fossil sources (oil, coal and gas), nuclear power and renewable sources (e.g. sun, wind, biomass,
hydropower and geothermal power). The fossil sources provide approximately 80 % of the total
energy demand, nuclear energy 7 % and renewable sources around 13 % (Goldemberg &
Johansson 2004). Considering the energy sources used for electricity generation, 63 % of the
electricity is produced from the fossil sources (coal, oil and natural gas), 14 % from nuclear
energy, 16 % from the hydro renewable sources, and the remaining 7 % from the non-hydro
renewable sources (wind, biomass, solar, geothermal and marine) (IEA 2010). With the amount
of fossil resources becoming more limited and the need to control greenhouse gas effects due to
carbon dioxide emissions resulting from their usage, an intense research for sustainable and
carbon-free or carbon-neutral energy carriers1 is being driven worldwide (Schiermeier et al.
2008).
Notwithstanding, our societies are also producing an increasing quantity of organic waste, such
as industrial and agricultural wastewaters. The objective of traditional wastewater treatments
with biotechnological processes is the elimination of polluting compounds to generate a liquid,
gaseous or solid residue that can be released in a natural environment without negative
ecological effects. As these wastewaters contain high levels of easily degradable organic
material, they are ideal candidates for bioprocessing, switching the paradigm of these waste
streams from pollutant to raw material, as they can provide bioenergy or biochemicals (Agler et
al. 2011; Kleerebezem & van Loosdrecht 2007; Angenent et al. 2004). In the recent years,
innovative technologies have been developed with the goal of combining traditional elements
from environmental biotechnology for the treatment of waste streams, with industrial
biotechnology that is aiming for the generation of valuable products. Biotechnological processes
catalyzed by microorganisms have been intensively developed towards these objectives, and
bioelectrochemical systems (BESs) appear as a promising alternative for treating different types
of wastewater and simultaneously fit the demands of this growing energy society.
1
1.1. Bioelectrochemical Systems
Bioelectrochemical systems are an innovative and attractive technique that combines bacterial
metabolism and electrochemistry for wastewater treatment. According to the definition of conventional electrosynthesis, microbial electrosynthesis was defined as „the microbially catalyzed synthesis of chemical compounds in an electrochemical cell‟ (Rabaey & Rozendal 2010). BESs employ solid state electrodes to directly or indirectly stimulate and control
microbial metabolism. These systems consist of an anode, a cathode and, usually, a membrane
separating the two. At the anode, an oxidation reaction occurs, and the electrode works as
electron acceptor, whereas at the cathode the electrode serves as electron donor for the reduction
reaction. At least one of the anodic or cathodic reactions is microbially catalyzed. Those
electrodes are surrounded by an electrolyte – the fluid that contains the reactants and/or products – which is denominated as anolyte or catholyte attributed by the respective compartment.
The main characteristic of electro-active bacteria is their ability to transport electrons inside and
outside the cell; this process of electron transfer can be either direct or indirect (Figure 1.1). The
direct mechanism of electron transfer relies on physical contact between the bacterial cell and
the electrode. This interaction is established by cytochromes or other redox active components
(such as pili or nanowires) located on the outer membrane of the microorganisms (Lovley 2008;
Reguera et al. 2005). The indirect mechanism involves the redox cycling of electron shuttles,
which transport the electrons from the cell to the electrode. These electron shuttles can be
distinguished in exogenous or endogenous.
SOX
(H+, CO 2, …)
e
-e
-e
-MedOX
MedRED e
-SRED
(H2, CH4, …)
SOX
SRED
CATHODE
SRED/ OX: Oxidized and reduced form of the substrate
: Electro-active microorganism MedOX/RED: Oxidized and reduced form of the soluble
redox mediator
Exogenous mediators can be humic acids and sulfur species, that are naturally present in the
cells, or can be externally added, like viologens and quinones (Aulenta et al. 2007; Aulenta et al.
2010). Endogenous electron shuttles are produced as secondary metabolites by microorganisms,
such as flavins (Von Canstein et al. 2008) and phenazanines (Venkataraman et al. 2010; Rabaey
et al. 2005).
Extensive research has been done to elucidate both mechanisms, where iron-reducing bacteria
such as Shewanella spp. and Geobacter spp. are mainly used as model microorganism. Nevertheless, an increasing number of publications shows that a wide variety of bacteria (other
than iron reducers) can also participate in extracellular electron transfer processes. Indeed, the
analysis of mixed microbial communities in BESs revealed a high degree of diversity and
pointed at microbial interactions motivating the electron flow (Kiely et al. 2011; Logan 2009).
As an example, Kiely et al. have studied the community profiles of electro-active microbial
consortia in BESs fed with different fermentable substrates (e.g., ethanol, acetate, cellulose,
wastewater). The conclusions revealed the existence of syntrophic partnerships between
fermentative bacteria converting the organic substrates and electro-active bacteria (typically
Geobacter species) oxidizing fermentation end products, allowing the rapid and complete conversion of complex substrates (as wastewater streams) into valuable by-products.
Based on their mode of application and operation, BESs can be sub-divided into microbial fuel
cells (MFCs), microbial electrolysis cells (MECs), microbial desalination cells (MDCs) and
microbial solar cells (MSCs). In fact, the term MXC was recently created for these systems,
where the X stands for the different types and applications of the microbial cell (Harnisch &
Schröder 2010). The last two types are out of the scope of this research and have been described
in detail by Rosenbaum et al. 2010, and Mehanna et al. 2010 plus Jacobson et al. 2011,
respectively. Due to their versatility, high level of control over the biological reactions and
capacity to sustain a wide range of biochemical processes, BESs hold a great potential for
application in environmental biotechnology, and particularly for bioenergy generation (Villano,
Aulenta & Majone 2012).
1.1.1.
Microbial Fuel Cell
–
electricity generation
The most extensive studied BES is the microbial fuel cell, which is commonly considered as a
sustainable technology for electricity generation and simultaneous wastewater treatment (Logan
et al. 2006; Du et al. 2007). A typical MFC consists of an anodic chamber and a cathodic
chamber separated by an ion exchange membrane. At the anode, microorganisms catalyze the
electrons flow from the anode to the cathode through an external electric circuit containing a
resistor or a load (i.e., the device being powered). Generally, the electrons that reach the cathode
combine with protons, which diffuse from the anode through the membrane, and oxygen,
provided from air; hence, the resulting product of this reaction is water (Min & Logan 2004; H.
J. Kim et al. 2002) (Figure 1.2). The ideal performance of an MFC depends on the
electrochemical reactions that occur between the organic substrate at a low potential, such as
glucose, and the final electron acceptor with a high redox potential, such as oxygen (Rabaey &
Verstraete 2005). In addition, the high oxygen availability in the environment makes it the most
sustainable electron acceptor. However, to achieve a sufficiently high oxygen reduction rate at
the cathode, platinum-, cobalt- and iron-based materials are frequently used as catalysts (S.
Cheng et al. 2006; Zhao et al. 2005).
Figure 1.2 - Schematics of a microbial fuel cell (MFC): at the anode, organic material from the wastewater is oxidized by electrochemically active microorganisms, which transfer the gained electrons to the electrode. Via an external circuit, the electrons are transported to the cathode, where are consumed for oxygen reduction (Villano, Aulenta & Majone 2012).
In relation to the electron flow in the system, it is known that the movement of electrons to the
cathode must be compensated by transport of an equal amount of positive charge to the cathode
chamber, in order to sustain the electroneutrality of the system. Therefore, the proton exchange
membrane (PEM) is one of the most critical components in the MFC, as it physically separates
the anode and the cathode compartments while allowing protons to pass through to the cathode.
The Nafion 117 membrane (Dupont Co., USA) is one of the most frequently used PEMs in
MFCs. It consists of a hydrophobic fluorocarbon backbone to which hydrophilic sulfonate
groups (-SO3
can be explained from the high concentration of these negatively charged sulfonate groups in
the membrane ([-SO3
-] ≈ 1.13 mol L-1
) (Rozendal 2006). However a number of problems
associated with these membranes still exist, namely the oxygen leakage from cathode to anode,
substrate loss, cation transport and accumulation rather than protons, and biofouling (Chae et al.
2008).
Several substrates have been investigated as possible energy sources to generate electrical
power in MFCs. Among them are carbohydrates (e.g., glucose, sucrose, cellulose and starch),
volatile fatty acids (e.g., formate, acetate and butyrate), alcohols (e.g., ethanol and methanol),
amino acids, proteins and even inorganic components (J. R. Kim et al. 2007; Heilmann & Logan
2006; Logan et al. 2005; Liu, S. Cheng, et al. 2005). Furthermore, a wide range of more
complex feeds, containing a large variety of different readily and non-readily degradable
molecules such as domestic wastewaters, brewery wastewater or the effluent of anaerobic
digesters have also been demonstrated to sustain electrical power generation in MFCs (Pant et
al. 2010; Min et al. 2005; Liu et al. 2004). Nonetheless, the nature of the substrate affects both
the composition of the bacterial community and the MFC performance, which means the power
density and the coulombic efficiency (CE) of the system. From the perspective of energy
recovery as power in a MFC, high CE is desirable. Moreover, bacteria that produce high CEs
will have low biomass yields, as the electrons from the substrate are used to produce current.
CEs as high as 96.8 % have been reported, suggesting that only 3.2 % or less of the electrons
could have gone into biomass production (Bond & Lovley 2003).
In order to assess the practical viability of MFCs, their performance in terms of wastewater
treatment capacity (i.e., substrate conversion rate), and bioenergy generation potential (i.e.,
electrical power generation) can be compared to that of conventional anaerobic digestion
systems. For instance, high-rate anaerobic reactors can be operated at organic loading rates
(OLRs) as high as 25 kgCOD m-3 d-1; in a MFC the same substrate conversion rate would
correspond to a volumetric current density of around 3500 A m-3 (considering that 1 kgCOD can
be theoretically converted into approximately 12×106 Coulombs). So far, the highest current
density achieved is 595 A m-3 (Rabaey et al. 2010).
To calculate power generation of anaerobic digestion, it should be first considered that
approximately 1 kWh of usable electrical energy is obtained from the conversion of 1 kgCOD
into methane. During the conversion of biogas into electricity via cogeneration, up to other 3
kWh are typically recovered as heat, used to warm up the digester, or are lost (Pham et al.
2006). By considering a high-rate digester that operates at an OLR of 25 kgCOD m-3 d-1, the
resulting volumetric power density would be around 1 kW m-3. So far, in spite of the great
power densities of MFC typically stand around 0.1 kW m-3, largely due to various losses,
mainly deriving from mass transport and activation limitations, which limit the energy
efficiency of the system (Villano, Aulenta & Majone 2012).
Aside the existing limitations and the currently higher installation costs, the MFC technology
holds some specific advantages over anaerobic digestion, e.g. the applicability for the treatment
of dilute wastewater, the possibility to operate at low temperatures, no need for gas handling
and/or cleaning, and the greater control over biochemical conversion processes. All these
features make these systems attractive for specific application niches (Pham et al. 2006). The
power outputs of MFCs have improved rapidly over the last decade by varying the design, the
operating conditions, optimizing configurations and also the biocatalyst utilized. Nevertheless,
the electric power could not be the only valuable product obtained from MFCs. In reality,
electrons resulting from the organic carbon oxidation can potentially be exploited at the cathode
for the generation of reduced value-added products, like hydrogen, as it succeeds in microbial
electrolysis cells. The co-production of a chemical product, besides the electric power, would
provide considerably higher economic and environmental benefits, as stated by Foley et al.
(2010).
1.1.2.
Microbial Electrolysis Cell
–
hydrogen generation
Microbial electrolysis cells are a relatively new BES which exploits the catalytic activity of
microorganisms to convert the chemical energy of wastewater directly into hydrogen gas
(Rozendal et al. 2006; Liu, Grot, et al. 2005). Subsequently the purpose of these systems is
twofold: the efficient purification of wastewater and high yield hydrogen production (Sleutels et
al. 2009). Such devices are based on a similar approach to MFC, consisting of two
compartments separated by an ion exchange membrane: the anode, where the electro-active
microorganisms oxidize organic or inorganic substrates using the electrode as terminal electron
acceptor (Rabaey & Rozendal 2010); and the cathode, where the electrons (released at the
anode) reduce protons to H2 in the presence of a suitable catalyst (Figure 1.3). The anode
compartment design is similar for both MEC and MFC, but the main difference between these
bioelectrochemical systems is that the MEC has an anaerobic cathode, allowing the hydrogen
evolution reaction rather than electricity. Since the final product is hydrogen, the cathode
architecture must be modified to collect the produced gas (Villano, Aulenta & Majone 2012).
Nevertheless, the potential generated from microbial substrate oxidation requires to be boosted
with an external power supply. Being acetate used as a model compound for the biocatalyzed
overcome the thermodynamic barrier and to drive the cathodic reaction at high rates (Villano et
al. 2011).
In practice, due to microorganisms activity and other losses in the cell, larger voltages (0.2-1.0
V) must be applied (Rozendal et al. 2006). Still the required voltage is significantly lower than
the one needed for hydrogen production through water electrolysis (1.6-2.0 V) (Zeng & Zhang
2010).
The requirement of noble metal (e.g., Pt-based) catalysts to enhance the rate and efficiency of
the cathodic reaction is one of the disadvantages of MEC, since these catalysts are expensive
and susceptible to poisoning. Alternative low-cost cathodic catalysts, including carbon felt,
stainless steel and nickel alloys, have also been investigated, though they often exhibit
insufficient chemical stability and/or reactivity at neutral pH for efficient MEC operation (Call
et al. 2009; Selembo et al. 2009).
The requirement of cheaper and more sustainable cathodes has motivated the research into the
development of microbial biocathodes (Rozendal et al. 2008; Clauwaert, Van der Ha, et al.
2007), where the microorganisms are the electrocatalytic agents of the target cathodic reaction.
The main advantages of microbial biocathodes include self-regeneration of the catalyst, low
cost, they can effectively operate under neutral pH conditions and are not susceptible to
corrosion. Furthermore, due to their metabolic versatility and specificity, microbial biocathodes
offer the potential to produce a variety of value added products. As an example it has been
demonstrated that microbial biocathodes can be employed in oxygen reduction (Clauwaert, Van
der Ha, et al. 2007), nitrate and fumarate reduction (Clauwaert, Rabaey, et al. 2007; Gregory et
al. 2004), and bioremediation processes (Aulenta et al. 2011; Aulenta et al. 2009). The MECs
set with this type of cathodes can also be employed to produce methane from carbon dioxide
reduction (Villano et al. 2010; S. Cheng et al. 2009). This reaction could exploit the electrons
and the carbon dioxide released at the anode from the microbial oxidation of organic matter
contained in a waste stream, as will be discussed in the following section.
1.2. Coupling organic substrate removal to methane production
Renewable biomethane is typically produced by methanogens from a few substrates such as
acetate, formate and hydrogen gas in anaerobic digesters (Wall et al. 2008). Recently, MEC
have also been confirmed as a new technique to produce methane. In a methane-producing
MEC, the electrons released from the anodic oxidation of organic matter are used for CO2
reduction into methane, by using a suitable chemical or biological catalyst. The latter include
methanogenic consortia, similar to anaerobic digestion (AD) (Villano et al. 2011; Villano et al.
2010; S. Cheng et al. 2009). For microbial biocathodes two distinct mechanisms of methane
production have been identified: direct reduction of CO2 (Equation 1.1) with methanogens
accepting electrons from a polarized cathode,
Equation 1.1
and indirect reduction of CO2 (Equation 1.2 and 1.3) with methanogens using H2 gas as electron
donor in their metabolism,
Equation 1.2
Equation 1.3
Methane production via direct reduction is considered the most energy-efficient process, as the
standard potential of hydrogen production via indirect mechanism (-0.410 V vs. SHE – standard hydrogen electrode) is lower than that of direct methane production (-0.244 V vs. SHE).
Up till now, few studies have investigated this application of MEC technology; for that reason
performances is rather limited. Besides, as it is a relatively new technique, the process needs to
be examined and evaluated on the basis of performance indicators, such as applied voltage,
overall process efficiency, energy requirement and production rates. In a recent study (Villano
et al. 2011), a fully biological MEC, consisting of a Geobacter sulfurreducens-enriched
bioanode and a methane-producing biocathode, was described. The MEC was successfully
started up by sequentially controlling the cathode and the anode potentials at values that are
favorable to the establishment of an active methanogenic biocathode (i.e. -0.850 V vs. SHE) and acetate-oxidizing bioanode (+0.500 V vs. SHE). The highest methane production rate (approximately 0.05 m3 m-3 d-1) was obtained by controlling the cathode at -0.850 V vs. SHE,
whereas the value achieved with the MEC being operated at a controlled anode potential of
+0.500 V vs. SHE was three times lower. However, similar to other biocathode studies, the performance of the system was found to be primarily limited by the concentration of biomass in
both compartments, suggesting that a possible strategy to optimize the process involves
saturating the electrodic surfaces with microorganisms (Villano, Aulenta & Majone 2012).
A subsequent study (Villano et al. 2013), where the bioanode was controlled at +0.200 V vs.
SHE, demonstrated a substrate removal efficiency of 94 % and the current stabilize at around
110 mA; the close correlation between current generation and acetate consumption clearly
indicated the ability of the inoculated sludge to use the graphite anode, poised at +0.200 V, as
terminal electron acceptor for electrochemical substrate oxidation. Concerning the average
energy efficiency, a parameter that takes into account the voltage difference between the anode
and the cathode potentials, it accounted for 75 %. In order to try to obtain a net positive energy
recovery, it is suggested to investigate the MEC performance controlling the anode at
less-positive potentials, without adversely affecting the substrate removal efficiency.
A methane-producing MEC combines features that are typical of conventional aerobic biofilm
processes, like the possibility to oxidize diluted streams, with those of conventional anaerobic
Figure 1.4 Main features of conventional anaerobic and aerobic biofilm processes and electro -active biofilms in a methane-producing MEC (biomass growth was not considered in this simplified representation) (Villano, Aulenta & Majone 2012).
Even though AD is an outstanding competitor, since it is a well-established and effective
biotechnology, this process potentially holds some specific advantages compared with a
traditional AD process; namely the physical separation of the organic matter oxidation from the
methane generation could in principle allow the production of a biogas richer in methane, and
the protection of methanogenic consortia against inhibitory compounds possibly contained in
the waste stream. Moreover, less thermal energy (if any) is needed to control the temperature of
the cathode because the waste stream does not need to be warmed up, being processed only at
the anode side, and analogously to other BESs, low strength wastewater (< 1 kgCOD m-3) can
also be treated. In this context, it has been also proposed to operate a MEC in series to a
conventional anaerobic digester, by removing the residual organic matter contained in the
digestate, which would otherwise represent a disposal burden and a waste of energy. In order to meet stringent effluent discharge limits, AD systems require a “polishing” post-treatment step, which is typically achieved in energy-intensive activated sludge systems, where the residual
organic matter is aerobically oxidized to carbon dioxide and water, with concomitant production
of considerable amounts of sludge.
The use of MEC in series to fermentative or methanogenic bioprocesses is particularly attractive
because AD effluents primarily consist of diluted organic acids, that are ideal substrates for H+ COD O2 CO2 Biofilm Biofilm in conventional anaerobic system COD CO2 Electro-active Biofilms in MEC
Anode e -Proton exchange membrane CO2 COD CH4
oxidation of diluted streams
energy recovery CO2 CH4 Cathode e -Substratum Biofilm in conventional aerobic system Input AD: COD
Output AD: CH4, CO2
Input MEC: COD, voltage Output MEC: CH4, CO2
electro-active bacteria, and so can be further removed, to avoid recirculation of AD effluent into
the wastewater treatment plant. At the same time, continuously bubbling the biogas produced
from AD (which typically consists of carbon dioxide (25-45 vol%) and methane (75-55 vol%))
through the MEC cathode would supply carbon dioxide for methane production, which could be
a strategy to add energetic and economic value to the AD biogas, by increasing its methane
content. A schematic diagram showing a possible integration opportunity for AD and
methane-producing MEC is shown in Figure 1.5. Hence, coupling AD and MEC in the sludge line of a
wastewater treatment plant will also contribute to decrease net sludge production while
increasing the energy recovery (Villano, Aulenta & Majone 2012).
Figure 1.5 - Enhanced methane production and waste substrate removal through a coupled anaerobic digestion (AD) and methane-producing MEC: the AD liquid and gaseous effluents are further processed at the anode and the cathode of the MEC, respectively (Villano, Aulenta & Majone 2012).
Waste substrate
AD effluent Biogas (CO2, CH4)
CH4-enriched Biogas Polished effluent
Bi
o
An
o
d
e
Bi
o
C
a
th
o
d
e
UASB
2.
Research objectives
The main objective of this research is the evaluation of the performance of a fully biological
two-chamber microbial electrolysis cell (MEC) in terms of organic matter oxidation (at the
anode), and methane production (at the cathode). Considering that previous studies were mostly
done at anode potential +0.2 V vs. SHE (standard hydrogen electrode) or higher and by using acetate as the only substrate, this dissertation intends to study the performance of the MEC:
- Operated at a lower anode potential (i.e. -0.1 V vs. SHE);
- fed by either acetate or substrates with different complexities.
In order to accomplish the target objectives, the research plan has been organized as follows:
The anode had been previously inoculated with an activated sludge, whereas the
cathode chamber inoculum was an anaerobic sludge (containing methanogenic
microorganisms).
Initially, the MEC performance was studied by continuously feeding the anode chamber
with an acetate solution as substrate, at an applied organic load rate of 1.08 gCOD L-1 d
-1
(Run I). During this Run the anode potential was controlled at -0.1 V vs. SHE by means of a potentiostat. The performance of the system was evaluated in terms of
substrate removal, coulombic efficiency (CE), cathode capture efficiency (CCE), methane and hydrogen production rates, and energy efficiency (ηE).
The results of Run I were then compared with results from previous studies, carried out
with the same conditions but at different anode potentials. This allowed to evaluate the
effect of the anode potential on the MEC performance.
Subsequently, with the purpose of studying the effect of substrate composition, the
feeding solution was replaced by a synthetic solution containing soluble organic
compounds other than acetate (Run II), with a similar applied organic load rate (0.93
gCOD L-1 d-1), and all other conditions being the same. Likewise the performance of the
system was evaluated with the same parameters as Run I.
At the end of each run, tracer experiments were performed in order to analyze the fluid
dynamics of the MEC.
Furthermore, to acquire microscopy analyses, the reactor was disassembled and samples
of graphite granules were collected from the anode and cathode compartments, as well
3.
Materials and methods
3.1.Microbial electrolysis cell design and setup
The experimental setup consisted of a two-chamber
microbial electrolysis cell (MEC), made of two
identical Plexiglas frames, with internal dimensions
of 17 cm 17 cm 3 cm, bolted together between
two Plexiglas plates (Figure 3.1). The two chambers,
that establish the anodic and cathodic compartments,
were physically separated by a Nafion® 117
(Dupont Co., USA) proton exchange membrane
(PEM), which allows protons and other cations to
pass through from the anode chamber to the cathode
one. Nafion®, a sulfonated tetrafluorethylene
copolymer, consists of a hydrophobic fluorocarbon
backbone (-CF2-CF2-) to which hydrophilic
sulfonate groups (-SO3
-) are attached (Mauritz &
Moore 2004), as shown in Figure 3.2. The main
characteristics of this membrane are: the high level of proton conductivity, explained by the
presence of negatively charged sulfonate groups in the membrane, the good mechanical
properties and the long-term stability as the membrane shows a lifetime of more than 10,000 h
(Appleby & Yeager 1986). Prior to being used, the PEM was pre-treated by boiling successively
in H2O2 (3%, v/v), distilled water, 0.5 M H2SO4, and finally in distilled water again, for 2 h
each.
Figure 3.2 - Structure of Nafion membrane.
In the chambers were four diaphragm in plexiglass (two per each compartment, with 13 cm 3
cm dimensions) to force a preferential liquid flow pathway across each chamber (see Figure 3.3
and Figure 3.4).
The reactor was designed to operate with three electrodes: the working electrode, the reference
electrode and the counter electrode. Both working and counter electrode were composed by
graphite granules filling each chamber. The electrical connections to the potentiostat (BioLogic
VSP, Grenoble, France) were guaranteed by means of a graphite rod (5 mm diameter and 100
mm length, Sigma-Aldrich, Italy) placed in each compartment. A KCl saturated Ag/AgCl
reference electrode (+0.199 V vs. standard hydrogen electrode, SHE) (Amel s.r.l., Milan, Italy) was also placed in both the anodic and cathodic compartments, in contact with the graphite
granules to measure or control the potential of individual electrodes. Each reference electrode
was placed close to the working or counter electrode, in order to reduce the ohmic loss and
make the potential measurement and control as accurate as possible. The potential of the
working electrode (anode) was controlled at -0.1 V vs. SHE by means of the potentiostat; whereas the potential of the counter electrode (cathode) was measured by means of a resistor.
Prior to being used, the graphite rods were treated for 1 h in a 37% HCl solution, subsequently
submerged for 24 h in a HCl (1 M) solution and then for 24 h in 1 M NaOH solution. This
process was repeated for two times and then the rods were thoroughly washed with distilled
water. The purpose of this treatment was to remove any metallic oxides and eliminate potential
organic residues from the graphite material. Prior to being used, the graphite granules were
activated by means of a washing process of 3 cycles, being submerged for 24 h in 37% HCl, to
remove metals from the surface, and then for 24 h in a NaOH (1 M) solution. The washing
process was repeated three times and then the granules were thoroughly washed with distilled
water and dried at 100 ºC. The intent of this treatment was to eliminate any potentially catalytic
foreign compounds from the graphite material. By killing all microorganisms, this treatment
also eliminated any potential biocatalyst that could affect the electrode performance (Freguia et
al. 2007).
Both chambers were filled with 730 g of graphite granules (El Carb 100, Graphite Sales, Inc,
USA) with diameters between 2 and 6 mm, with a real density of 1.709 ± 0.025 g mL-1 and an
apparent density of 0.951 g mL-1, giving a bed porosity ( ⁄ of 48 %. Besides
of offering a high electrodic surface area, the graphite grains also functioned as support material
for the biofilm growth. The total empty volume of each compartment was 0.86 L.
A glass chamber
,
equipped with sampling ports sealed with butyl rubber stoppers and aluminumcrimps, was placed in the outlet of each compartment in order to sample the headspace and the
297 mL, for the anode and the cathode compartment, respectively). In the latter case, the glass
chamber was connected to a MilliGascounter (Ritter, Germany), which recorded the volume of
the produced gas. The connections to the pumps for each compartment were made by means of
Tygon® Laboratory Tubing R-3603, impermeable to oxygen.
3.2. Microbial electrolysis cell operation
The experimentation was performed with microorganisms already present in the MEC from
previous operation. Specifically, the anode compartment had been inoculated with 0.2 L of
activated sludge collected from a local full-scale municipal wastewater treatment plant (Roma
Nord, Italy), having a biomass concentration of 1.99 0.06 g L-1 as volatile suspended solids
(VSS). This inoculum was kept in anaerobic conditions, in order to use the electrode as sole
external electron acceptor for the oxidation of organic matter. The cathode compartment had
been inoculated with 0.05 L of anaerobic sludge from the full-scale wastewater treatment plant
of Treviso (Italy), with a biomass concentration of 8.35 0.88 g L-1 as VSS. Prior to being
inoculated, the anaerobic sludge was diluted in mineral medium with the necessary amount of
nutrients to the microbial culture. Considering the empty volume in anodic and cathodic
compartments (390 and 417 mL, respectively), the initial sludge concentration in each
compartment was approximately 1 g L-1. After inoculation, the liquid phase and headspace of
both compartments were flushed for 1 h with a N2/CO2 (70:30 v/v) gas mixture in order to
establish anaerobic conditions. One day after the reactor was connected to the potentiostat by
controlling the anode potential at the desired value. The potentiostat also allowed measuring and
recording the electrical current flowing in the system. After the inoculation the MEC had been
operated for almost 80 days, mostly by controlling the anode potential at +0.2 V vs. SHE (Villano et al. 2013)
Throughout this research, the MEC anode was operated in continuous-flow mode by using a
peristaltic pump (Figure 3.3). In each compartment the liquid phase, hereafter referred to as
anolyte and catholyte, was anaerobic basal medium which contained (g L-1): K2HPO4, 4; NH4Cl,
0.125; MgCl2∙6H2O, 0.1; CaCl2∙2H2O, 0.05; 10 mL L -1
of a trace metal solution (Balch et al.
1979)and 1 mL L-1 of a vitamin solution (Zeikus 1977). Nevertheless, for each run the initial
anolyte was substituted by the feeding solution, which contained organic components, whereas
the catholyte was only the mentioned basal medium.
Initially (Run I) the feeding solution (anolyte) contained acetate as organic substrate and the
following composition in g L-1: CH3COONa, 0.82; NH4Cl, 0.125; MgCl2∙6H2O, 0.1; K2HPO4, 4;
CaCl2∙2H2O, 0.05; 10 mL L -1
of a trace metal solution (Balch et al. 1979), and 1 mL L-1 of
d-1, being acetate the sole electron donor for the anodic culture (based on the conversion factor
1.067 gCOD g acetate-1). In a second part of the research (Run II), the feeding solution was
replaced with a more complex solution containing soluble organic compounds other than
acetate, with the following composition in g L-1: NH4Cl, 0.267; CH3COONa, 0.077; KH2PO4,
0.053; peptone, 0.120; yeast extract, 0.065; glucose, 0.141 and starch, 0.127. In this case, the
corresponding OLR was 0.93 gCOD L-1 d-1. Prior to being supplied to the anode, the feeding
solution was flushed with a N2/CO2 (70:30 v/v) gas mixture in order to establish anaerobic
conditions. Then, pH was adjusted at values between 7.00 and 7.50 by adding 40 mL L-1 of a
NaHCO3 solution (10% w/v) and the solution was transferred anaerobically inside a Tedlar ®
bag. The feeding flow rate was 1 mL min-1 (1.44 L d-1), resulting in a hydraulic retention time
(HRT) of 0.60 d (referred to the empty volume of the anode compartment). The effluent of this
compartment was recovered in a Tedlar® bag.
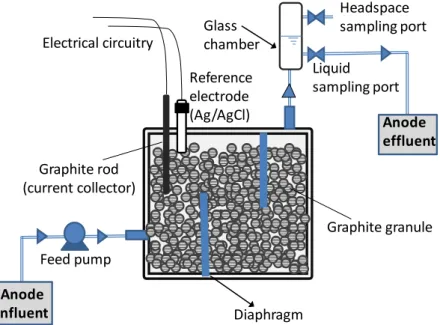
Figure 3.3 - Schematic overview of the MEC anode compartment.
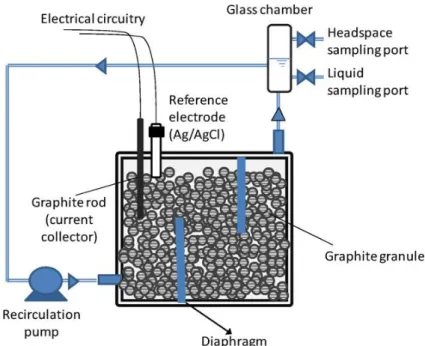
The MEC cathode (Figure 3.4) was operated in a semi-batch mode with the liquid phase (catholyte) being continuously recirculated at a flow rate of 30 mL min-1, using a peristaltic
pump and Tygon® tubings, in order to prevent the establishment of products concentration
gradients. Furthermore, this compartment was continuously flushed with a gas mixture of
N2/CO2 (70:30 v/v), with a 10 L d -1
flow rate, in order to control the pH and continuously
supply carbonate for methane formation as well. Catholyte was the basal medium, i.e., the same
composition as the anolyte but deprived of acetate or other organic compounds. Besides, a small
liquid flow from the anode to the cathode compartment through the membrane was observed.
Hence, to counterbalance this additional flow, it was necessary to daily remove the catholyte Reference
electrode (Ag/AgCl) Glass chamber
Headspace sampling port
Feed pump
Diaphragm Electrical circuitry
Graphite granule Graphite rod
(current collector)
Liquid sampling port
Anode
influent
collected inside the glass chamber. For Run I, the average daily withdrawn was 73.2 mL, and
51.6 mL for Run II.
Figure 3.4 - Schematic overview of the MEC cathode compartment (Villano et al. 2011).
In order to smooth temperature variations both the influent line to the anode and the recycle line
through the cathode were passed through a glass heat exchanger; typically the MEC temperature
was around 24 to 26 ºC.
3.3. Tracer experiment
In order to characterize the hydrodynamic behavior in the anode compartment of the
bioelectrochemical reactor, a tracer test was carried out for two times. Prior to performing both
tests, the bioanode was fed with a mineral medium solution, in order to let current drop down to
the baseline value. For the first tracer experiment, the inlet feed solution consisted of mineral
medium to which was added an inert tracer (KBr) at a concentration (C0) of 0.5 g L -1
(as Br-).
Instead, the inlet feed solution of the second experiment was modified by adding the inert tracer
to the usual acetate-containing medium, at the same concentration as before. The solution was
fed into the anode in a step-input mode at a flow-rate of 0.87 mL min-1 (1.25 L d-1) in the first
The response of the reactor to the step-input of the tracer was calculated from the
non-dimensional F(t) curve, obtained by plotting C(t)/C0 as a function of time (where C(t) is the Br
-concentration at time t, and C0 is its initial concentration). In the second experiment, the time
profile of electric current generated from the oxidation of the acetate was also acquired and
compared to the F(t) curve by plotting i(t)/imax, where i(t) and imax represent the current value at
time t and the maximum value of current achieved, respectively.
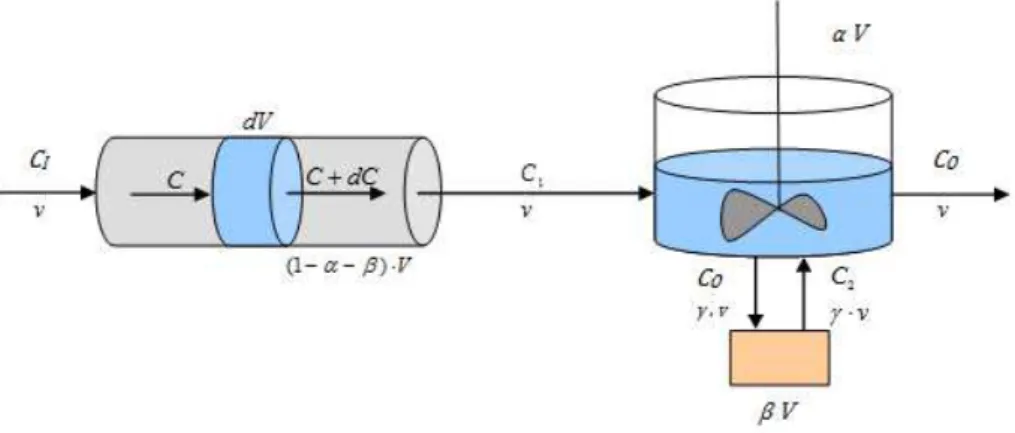
To analyze the result of the tracer experiments three theoretical models were tested. In this
section, it will only be specified the equations of the theoretical model that had the better
adjustment: the combination of a plug-flow reactor (PFR) and a continuous stirred tank reactor
(CSTR) with stagnant zones (Figure 3.5).
Figure 3.5 – Schematic representation of the theoretical model that had the better adjustment to the tracer experiment: combination of a PFR and a CSTR with stagnant zones.
The mole balances to the system started with the dispersion model to the tubular reactor. The
balance to the volume element dV is
Equation 3.1
Being the molar flow, and the molar flux, it cames
Equation 3.2
Equation 3.4
Equation 3.5
Equation 3.6
In ideal conditions,
In conditions of axial dispersion
Equation 3.7
In order to arrive at the dimensionless group that characterize the process, let and
Equation 3.8
As
, multiplying by
Equation 3.9
Introducing the Peclet number, that can be regarded as the ratio of
Equation 3.10
Applying the Laplace transform ̅ :
̅ ̅ ̅
̅
̅
̅
Equation 3.11
That is an homogeneous second order differential equation, with the following characteristic
polynom
Equation 3.12
Of roots: √
⁄ , the solution of the differential equation is
̅
√
⁄
√ ⁄
Equation 3.13
Considering the boundary conditions it is possible to determine the constants and ,
{
The second condition implies that
̅
√ ⁄
Equation 3.14
The transfer function is a ratio of output to input , in -domain:
̅ ̅ ̅ ̅
√ ⁄
√ ⁄
Applying inverse Laplace it is obtained the residence times distribution function
{ } √
√
Equation 3.16
Where, in this case,
.
The next step is the mole balance to the CSTR with the stagnant zone, starting with the CSTR
balance
Equation 3.17
Dividing by
Equation 3.18
Equation 3.19
Introducing the Euler method for numerical integration yields
( )
Equation 3.20
The balance to the stagnant zone comes
Equation 3.21
Dividing by
Equation 3.23
Introducing the Euler method,
Equation 3.24
The final equations used to design the model are then
PFR:
√
√ ( )
( ) ( ( ))
Equation 3.25
CSTR:
Stagnant zones:
To solve these differential equations the Simpson‟s one-third rule was applied and the model was built with a dt of 0.064 h in a total of 64 hours. The cumulative distribution curve, F(t),
presented in Hydrodynamic characterization of the bioanode, was also obtained with Simpson‟s one-third rule. The term , or hydraulic retention time (HRT) is calculated from the F(t) curve, obtained by plotting C(t)/C0 as a function of time. On the other hand, the theoretical hydraulic
retention time (HRTT) is the ration between the volume of the reactor and the influent flow rate:
.
3.4. Control and data acquisition
3.4.1.
Potentiostatic system
Throughout all the investigation the bioelectrochemical reactor was connected to a potentiostat.
This allowed the control the potential of the working electrode (anode) at the desired value (-0.1
V). All potential values reported in this thesis are expressed with respect to the potential of
standard hydrogen electrode (SHE), for convention the potential of this electrode is assigned the