Optimization of Bioplastics Production from
Cheese Whey
Inês da Silva Farinha
Faculdade de Ciências e Tecnologia
Chemistry Department
Optimization of Bioplastics Production from
Cheese Whey
Inês da Silva Farinha
Dissertation presented in partial fulfillment of the Requirements for the Degree of Master in Biotechnology
Supervisiors:
Doctor Luísa Seuanes Serafim, Associated Researcher, REQUIMTE Professor Maria d’Ascensão Carvalho Miranda Reis, Associate Professor with
Aggregation, Faculdade de Ciências e Tecnologia, UNL
I would like to specially thank to my supervisors Dr. Luísa Seuanes Serafim and Professor Maria d’Ascensão Miranda Reis, for their guidance during my research on this project. Their encouragement and support since beginning enable me to complete my work successfully.
I would like to thank to Joana Pais, for her help, support and valuable suggestions through this work.
I want also to thank to all people from the Biochemical Engineering and Processes group laboratory, for their friendship and support.
I would like to thank to Maria A. Prieto from CIB/CSIC and Miguel Arevalo Rodriguez from BIOMEDAL, for their contribution in developing the E. coli strains used in this work.
And finally, I want to thank to my parents, for all the patience and support they gave to me.
Polyhydroxyalkanoates (PHAs) are polyesters produced by a variety of microorganisms. Due to the similarity of chemical and physical properties with the conventional plastics, and full biodegradability, PHAs constitute one of the best alternatives for synthetic polymers replacement. However, the production costs of these biopolymers are very high when compared to synthetic polymers production. One way to reduce the production costs is the utilization of low cost raw materials, such as industrial wastes and by-products as carbon source. An example of raw material is cheese whey, a by-product form cheese industry rich in lactose (4-5%).
Polihidroxialcanoatos (PHAs) são poliésteres produzidos por uma grande variedade de microrganismos. Os PHAs constituem uma das melhores alternativas para a substituição dos polímeros sintéticos, devido não só às suas propriedades químicas e físicas, mas também devido ao facto de serem produzidos por via biológica e serem totalmente biodegradáveis. No entanto, os custos de produção destes biopolímeros são muito elevados quando comparados com a produção de polímeros sintéticos. Uma das formas encontradas para reduzir os custos de produção foi a utilização de matérias-primas de baixo custo, como resíduos ou sub-produtos industriais. O soro de leite, um sub-produto proveniente da indústria do queijo com elevado teor em lactose (4-5%), é um exemplo de uma matéria-prima de baixo custo que pode ser utilizada na produção de PHAs.
Contents
Acknowledgements iv
Abstract vi
Resumo viii
Contents x
Index of Figures xiv
Index of Tables xvi
Nomenclature xvii
Greek letters xvii
Abbreviations xviii
1. MOTIVATION AND THESIS OUTLINE 1
2. INTRODUCTION 2
2.1 – Cheese Whey 2
2.2 – Polyhydroxyalkanoates (PHAs) 3
2.2.1 – Characteristics of PHAs 3
2.2.2 – Economical aspects of PHAs production 5
2.2.3 – Applications of PHAs 6
2.3 – Production of Polyhydroxyalkanoates 7
2.3.1 – Bacterial Strains and the Carbon Sources used 7
2.3.2 – Bioproduction Process 8
2.3.3 – PHAs production from cheese whey 9
3.1 – Escherichia coli Strains 13
3.2 – Cheese Whey preparation 14
3.2.1 – Composition and characteristics 14
3.2.2 – Experimental procedure 14
3.3 – Experimental set-up 15
3.3.1 – LB medium experiments 15
3.3.1.1 – Screening experiments 15
3.3.1.1.1 – Medium preparation and composition 15
3.3.1.1.2 – Inocula preparation 15
3.3.1.1.3 – Operating conditions 16
3.3.1.2 – Shake flask experiment with the selected strain 16 3.3.1.2.1 – Medium preparation and composition 16
3.3.1.2.2 – Inocula preparation 16
3.3.1.2.3 – Operating conditions 16
3.3.2 - Defined medium experiments with lactose 17
3.3.2.1 – Flask experiment 17
3.3.2.1.1 – Medium preparation 17
3.3.2.1.2 – Inocula preparation 18
3.3.2.1.3 – Operating conditions 18
3.3.2.2 – Fed-batch experiment 18
3.3.2.2.1 – Medium preparation 18
3.3.2.2.2 – Inocula preparation 19
3.3.2.2.3 – Operating conditions 19
3.3.3 – Defined medium with cheese whey 20
3.3.3.1 – Flask experiment 20
3.3.3.1.1 – Medium composition and preparation 20
3.3.3.1.2 – Inocula preparation 21
3.3.3.1.3 – Operating conditions 21
3.3.3.2 – Fed-batch experiment with feeding controlled by pH 21
3.3.3.2.1 – Medium preparation 22
3.3.3.2.2 – Inocula preparation 22
3.3.3.2.3 – Operating conditions 22
3.3.3.3 – Fed-batch experiment with manual feeding 22
3.3.3.3.1 – Medium preparation 22
3.3.3.3.2 – Inocula preparation 22
3.3.3.3.3 – Operating conditions 22
3.3.3.4.3 – Operating conditions 23 3.3.3.5 – Fed-batch experiment with continuous feeding 24
3.3.3.5.1 – Medium preparation 24
3.3.3.5.2 – Inocula preparation 24
3.3.3.5.3 – Operating conditions 24
3.4 – Analytical Methods 24
3.4.1 – Cell growth and concentration 24
3.4.2 – PHB quantification 25
3.4.3 – Lactose quantification 26
3.4.4 – Organic acids quantification 26
3.4.5 – Ammonia quantification 26
3.5 – Microscopy analysis 27
3.6 - Calculations 27
4. RESULTS AND DISCUSSION 29
4.1 – LB Medium Experiments 29
4.1.1 – Selection of the strain 29
4.1.2 – Flask experiments with E. coli CML 3-1 strain 30
4.2 – Defined Medium Experiments with Lactose 33
4.2.1 – Flask experiment 33
4.2.2 – Fed-batch experiment 35
4.3 – Defined Medium Experiments with Cheese Whey 37
4.3.1 – Flask experiment 38
4.3.2 – Fed-batch experiment with feeding controlled by pH 39 4.3.3 – Fed-batch experiment with manual feeding 43 4.3.4 – Fed-batch experiment with manual feeding and oxygen limitation 45 4.3.5 – Fed-batch experiment with continuous feeding 47
5. CONCLUSIONS 51
5.1 - Future Strategies 52
5.1.1 – Carbon source feeding strategy 52
7. PUBLICATIONS 59
8. APPENDIX 61
8.1 – LB medium experiments 61
8.1.1 - Selection of the Strain 61
8.1.2 - Flask experiment with E. coli CML 3-1 strain 64
8.2 – Defined medium with lactose experiments – fed-batch system 64
8.3 – Defined medium experiments with cheese whey 65
8.3.1 – Flask experiment 65
Index of Figures
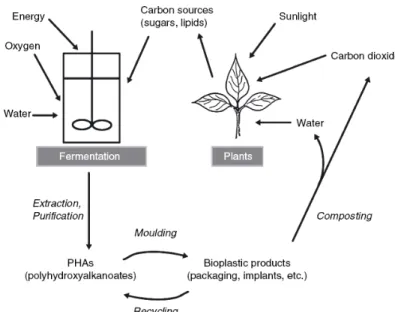
Figure 1 – General structure of PHAs (Solaiman et al., 2006) Figure 2 – Life cycle of PHAs (Verlinden et al., 2007)
Figure 3 – Possible routes to produce PHAs from whey lactose Figure 4 – Biosynthetic pathways to PHB
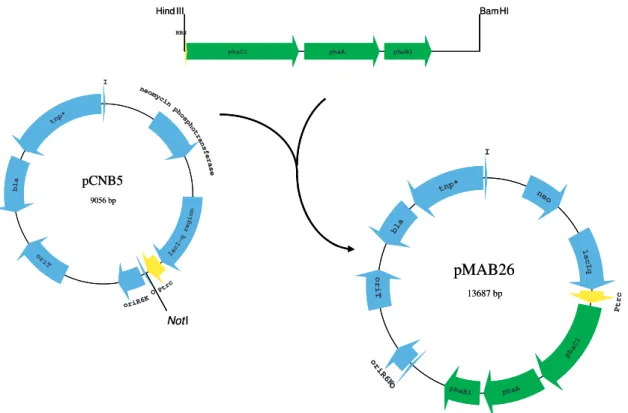
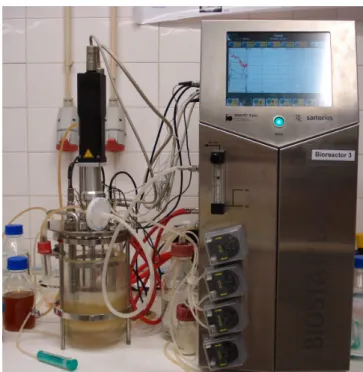
Figure 5 – Construction of plasmids pCNB5 and pMAB26 Figure 6 - Fed-batch reactor (BioStat® B-Plus, Sartorius) Figure 7 – Fed-batch experiments set-up
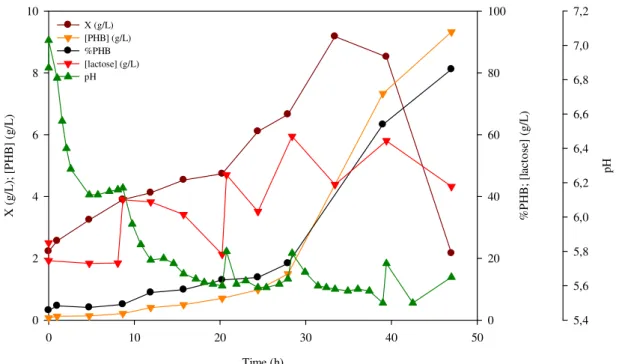
Figure 8 – PHB production from LB medium with lactose by E. coli CML 3-1, in shake flask
Figure 9 – Fresh samples of E. coli CML 3-1 strain lengthening and storing PHB; a) after 7h of incubation, b) after 47h of incubation (1000x)
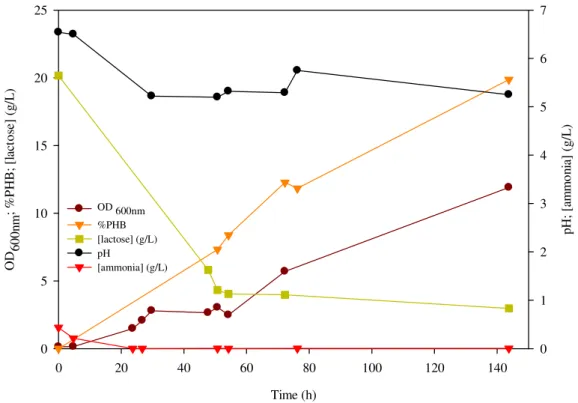
Figure 10 – PHB production from lactose in MR medium by E. coli CML 3-1, in shake flask
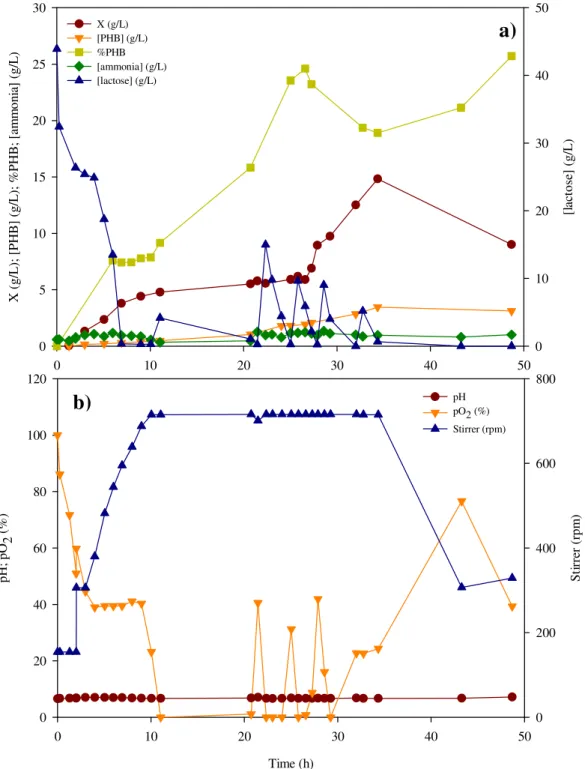
Figure 11 – PHB production in fed-batch reactor with MR medium and lactose, by E. coli CML 3-1; a) PHB content and PHB, active biomass, ammonia and lactose concentrations, b) pH, pO2 and stirrer
Figure 12 – PHB production by E. coli CML 3-1 using whey and MR medium in shake flask
Figure 13 - PHB production from whey in MR medium by E. coli CML 3-1, in fed-batch system with feeding controlled by pH; a) PHB content and PHB, active biomass, ammonia and lactose concentrations, b) pH, pO2, %O2/air and stirrer
Figure 14 – Feeding controlled by pH strategy
Figure 15 - PHB production from whey in MR medium by E. coli CML 3-1, in fed-batch system with manual feeding; a) PHB content and PHB, active biomass, ammonia and lactose concentrations, b) pH, pO2, %O2/air and stirrer
Figure 16 - PHB production from whey in MR medium by E. coli CML 3-1, in fed-batch system with manual feeding and oxygen limitation; a) PHB content and PHB, active biomass, ammonia and lactose concentrations, b) pH, pO2, %O2/air and stirrer, c) organic acids concentration
Figure 17 - PHB production from whey powder in mineral medium by E. coli CML 3-1, in fed-batch system with continuous feeding a) PHB content and PHB, active biomass, ammonia and lactose concentrations, b) pH, pO2, %O2/air and stirrer, c) organic acids concentration
Figure 18 - Stained sample of E. coli CML 3-1 strain in fed-batch experiment with continuous feeding: a) polymer granules inside the cell; b) polymer granules outside the cell; c) cellular debris (1000x)
Figure 19 – PHB production from lactose in LB medium with E. coli CML 1-1A Figure 20 - PHB production from lactose in LB medium with E. coli CML 2-3A Figure 21 - PHB production from lactose in LB medium with E. coli CML 3-1 Figure 22 - PHB production from lactose in LB medium with E. coli CML 3-2A Figure 23 - PHB production from lactose in LB medium with E. coli CML 4-1A
Figure 26 - Specific growth rate determination for E. coli CML 3-1, in shake flask
Figure 27 - Specific growth rate determination for E. coli CML 3-1, in fed-batch experiment with feeding controlled by pH
Figure 28 - Specific growth rate determination for E. coli CML 3-1, in fed-batch experiment with manual feeding
Figure 29 - Specific growth rate determination for E. coli CML 3-1, in fed-batch experiment with manual feeding and oxygen limitation
Index of Tables
Table 1 – Composition of cheese whey (Siso, 1996) Table 2 – Characterization of cheese whey powder
Table 3 – LB medium (liquid and solid medium) for 1 L of solution Table 4 – MR medium with lactose 2% (w/v), for 1 L solution Table 5 – Micronutrients solution composition
Table 6 – MR medium with cheese whey, for 1 L solution Table 7 – Results obtained in this experiment
Table 8 – Maximum cell dry weight, PHB storage content, maximum active biomass and polymer concentrations, maximum specific growth rate, storage and growth yields and volumetric and specific productivities obtained in the nine experiments performed with E. coli CML 3-1 in this work compared with results from the literature (Ahn et al., 2000)
%PHB – PHB content (% w/w)
[acetate] – Acetate concentration (g/L) [ammonia] – Ammonia concentration (g/L) [butyrate] – Butyrate concentration (g/L) [formate] – Formate concentration (g/L) [lactate] – Lactate concentration (g/L) [lactose] – Lactose concentration (g/L) [PHB] – PHB concentration (g/L)
[propionate] – Propionate concentration (g/L) [pyruvate] – Pyruvate concentration (g/L) [succinate] – Succinate concentration (g/L) [valerate] – Valerate concentration (g/L)
DCW – Dry Cell Weight, cell concentration (g/L) DOC – Dissolved Oxygen Concentration (pO2 (%))
Mn – Average molecular mass Mw/Mn – Polydispersy index
OD600nm – Optical Density at 600 nm
qPHB – Specific production rate (or specific productivity) (gPHB/gX.h)
rPHB – Volumetric production rate (or volumetric productivity) (gPHB/L.h)
rpm – rotation per minute
vvm – gas volume per liquid volume per time (minutes) X – Active biomass or residual cell concentration (g/L)
YPHB/lactose – Storage yield (gPHB/glactose)
YX/lactose – Growth yield (gX/glactose)
Greek letters
µ - Specific growth rate (h-1)
BOD – Biochemical Oxygen Demand (ppm) COD – Chemical Oxygen Demand (ppm) FDA – U.S. Food and Drug Administration HB – Hydroxybutyrate
HPLC – High Performance Liquid Chromatography HV – Hydroxyvalerate
LB medium – Luria-Bertani medium lcl-PHAs – Long-chain-length
mcl-PHAs – Medium-chain-length PHAs MR medium – chemical defined medium PHAs – Polyhydroxyalkanoates
PHB – Poly(3-hydroxybutyrate)
scl-mcl PHAs – scl and mcl monomers copolymers scl-PHAs – Short-chain-length PHAs
1.
Motivation and thesis outline
In the last 50 years synthetic plastics become one of the most utilized materials in many applications. Their versatility, outstanding technical properties (such as high chemical resistance and elasticity) and relatively low price were the main causes of their success (Zinn et al., 2001; Reddy et al., 2003). However, in the recent years, there has been increasing the concern over the harmful effects of petrochemical-derived plastic materials in the environment, especially because they are not biologically degraded. Therefore, it is mandatory to find biodegradable alternative materials to petrol based plastics. Many polymers found in nature were proposed and tested for their possible industrial application and biodegradability, for example, cellulose, starch, polylactate and polyhydroxyalkanoates (PHAs) (Zinn et al., 2001). PHAs were considered strong candidates for biodegradable polymer material because these polymers produced by many microorganisms possess material properties similar to various synthetic thermoplastics currently in use. Moreover, they are completely degraded upon disposal, by microorganisms in various environments such as soil, sea and lake water and sewage (Lee, 1996).
The objective of this work is the production of poly(3-hydroxybutyrate) (PHB), by using recombinant strains of Escherichia coli harbouring the Cupriavidus necator PHAs biosynthesis genes, from lactose present in cheese whey powder. The success of this process allows the economic valorisation of cheese whey, a residue from dairy industry that needs to be treated before disposal due to its high organic matter content. PHB production from a complex waste like cheese whey comprises three main steps: upstream, fermentation and downstream. This work focuses only the upstream and fermentation steps.
Firstly, batch tests in shake flasks were conducted for the selection of the strain with the highest PHA content and productivity from lactose. Then, other batch tests in shake flask and fed-batch bioreactor assays were conducted with the selected strain, to study the effect of carbon concentration and oxygen limitation on PHB content and productivity in order to optimise this process. Finally different carbon source feeding strategies were evaluated.
2.
Introduction
2.1 – Cheese Whey
Whey is the major by-product from the manufacture of cheese or casein bovine milk, representing 80 to 90% of the volume of milk transformed (Ahn et al., 2000) and retaining 55% of milk nutrients (Siso, 1996). Cheese whey is rich in fermentable nutrients such as lactose, lipids and soluble proteins (Table 1), and also contains citric acid, non-protein nitrogen compounds (urea and uric acid) and B group vitamins (Siso, 1996).
Table 1 – Composition of cheese whey (Siso, 1996)
Nutrient Concentration
(% w/v)
Lactose 4.5 – 5
Soluble Proteins 0.6 – 0.8
Lipids 0.4 – 0.5
Mineral Salts
(such as NaCl, KCl and calcium salts) 8 – 10
(1)
Lactic Acid 0.05
(1) Concentration in percentage of dried extract
According to the procedure used for casein precipitation, the cheese whey produced can be acid (pH<5) or sweet (pH 6-7). Acid whey, also known as salty, has higher salt and lower protein contents than sweet whey. As a consequence of its high salinity, salty whey is more difficult to process and has higher disposal costs than sweet whey (Blaschek et al., 2007; Siso, 1996).
In 2000, in the European Union 6,385.000 tons of cheese were produced resulting in approximately 40,420.800 tons of whey. Around 67% of this whey is used for the production of lactose and animal feed, but the remaining 13,452.000 tons that contain 619.250 tons of lactose constitute a serious disposal problem for the dairy industries (Koller et al., 2008). In Portugal, there were produced 28.146 tons of whey, in 2007 (Instituto Nacional de Estatística, 2008).
environmental problem. As an example, a dairy farm processing 100 tons of milk per day produces approximately the same quantity of organic matter in its effluent as would a town with 55.000 residents. A solution to this water pollution problem is urgent due to the increasing volumes of whey produced and the stricter legislative requirements regarding effluent quality. The bioconversion of whey lactose to marketable products such as ethanol, methane or single cell protein reduces more than 75% of the BOD, but in most cases the resulting effluent is not ready for disposal (Siso, 1996).
To overcome this environmental problem and considering the high content of lactose and proteins, cheese whey may be used as a fermentative feedstock for production of valuable products. Lactose may be used as a carbon source of bacterial strains in the production of bioplastics (like PHAs) (Lee, 1997), ethanol and methane that can be used as a source of energy. Other products such as agricultural fertilizers, animal feeding supplements, organic acids, vitamins, pharmaceutical products and supplements for baby milks can also be obtained by treatment of whey (Siso, 1996). Whey proteins have high nutritional potential and high added commercial value (Zydney, 1998). These proteins can be used as simple protein supplements, for the manufacture of transformed food products because of their functional and technological characteristics (Siso, 1996).
2.2 – Polyhydroxyalkanoates (PHAs)
Polyhydroxyalkanoates (PHAs) are polyesters of various hydroxyalkanoates which are synthesized by numerous microorganisms belonging to the Bacteria and Archea domains (Solaiman et al., 2006), as a carbon and energy reserve material. PHAs are synthesized usually when an essential nutrient is limited (such as oxygen, nitrogen or phosphorus) and in presence of excess carbon source (Lee, 1996). These polymers are accumulated as intracellular granules to levels as high as 90% of the cell dry weight. (Reddy et al., 2003). The occurrence of PHAs in bacteria has been known since 1926, when the French scientist Lemoigne reported the formation of PHB inside Bacillus megaterium (Lemoigne, 1927).
2.2.1 – Characteristics of PHAs
in D-(-) configuration due to the stereospecificity of biosynthetic enzymes (Lee, 1996). More than 100 different monomers were identified as constituents of PHAs in various bacteria. However, only a few of these polymers have been produced in sufficient amounts (Zinn et al., 2001) to enable the characterization of their physical properties and to develop potential applications.
Figure 1 – General structure of PHAs (Solaiman et al., 2006)
PHAs can be mainly divided into three types based on the number of carbon atoms in the monomers. Short-chain-length PHAs (scl-PHAs) include monomer units of C3-C5, medium-chain-length (mcl-PHAs) include monomer units of C6-C14 (Li et al., 2007) and long-chain-length (lcl-PHAs) consist of monomers ranging in size from C14 and more (Luengo et al., 2003).
Due to the diversity of monomeric units, PHAs present a wide variety of physical properties. Scl-PHAs are often crystalline, stiff and brittle, exhibiting thermoplastic-like properties; while mcl-PHAs present lower crystallinity and more elasticity (Reddy et al., 2003), behaving like elastomers or adhesives (Solaiman et al., 2006). The production of PHAs composed of scl and mcl monomers copolymers is quite frequent in nature and scl-mcl PHAs present properties between these two states, depending on the ratio of scl and mcl monomers in the copolymer (Li et al., 2007). Bacterial strains usually produce PHAs with an average molecular mass (Mn) of up to 4.0x10⁶ and a polydispersity (Mw/Mn) of around 2.0 (Verlinden et al., 2007). PHAs are also non-toxic, biocompatible and biodegradable thermoplastics. They have a high degree of polymerization and they are optically active, isotactic (stereochemical regularity in repeating units), piezoelectric and insoluble in water (Reddy et al., 2003). These features make them highly competitive with petrochemical-derived plastics.
the degradation products are carbon dioxide and methane. Studies have shown that 85% of PHAs were degraded in seven weeks (Reddy et al., 2003).
PHB is a homopolymer of 3-hydroxybutyrate and is the most widespread and best characterized member of PHAs. Like others scl-PHAs, PHB is a partially crystalline polymer with material properties similar to polypropylene. However, industrial applications of PHB have been hampered owing to its low thermal stability and excessive brittleness upon storage (Lee, 1996). The introduction of other 3-hydroxyacid monomers (such as 3-hydroxyvalerate or 4-hydroxybutyrate) in PHB chains, forming copolymers, increases the polymer processability.
2.2.2 – Economical aspects of PHAs production
Renewable resources, like agricultural feedstock or wastes containing sugars and fatty acids as carbon and energy sources can be used for PHAs production. The synthesis and biodegradation of PHAs are totally compatible with carbon cycle (Figure 2). Thus, while for some applications the biodegradability is critical, PHAs receive general attention because their production is based on renewable compounds instead of fossil fuels (Verlinden et al., 2007).
Figure 2 – Life cycle of PHAs (Verlinden et al., 2007)
to the life cycle impacts are electricity requirements. Nevertheless, considering all the life cycle presented in Figure 2, the production of PHAs is more benefic than petroleum-based polymers. However, the fermentation process to make PHAs is far from optimized, while the production of petrochemical plastics is fully developed (Verlinden et al., 2007).
In spite of the numerous advantages, PHAs are not economically competitive due to its high cost, US$9 per Kg for PHB against US$1 per Kg of synthetic plastics (Biby, 2002). The use of raw materials (such as whey, molasses, malt, soy, vinegar waste and sesame oil) (Solaiman, 2006; Wong et al., 2004), as carbon source for PHAs production can reduce the costs in about 50% (Reis et al., 2003). So, using cheaper carbon sources as basic feedstock could be one of the solutions for decreasing PHAs prices. Despite of the highly developed process of PHA production from wastes, the optimization of the technology for wastes utilization is also urgent. Possible technology for converting wastes in PHAs is the use of recombinant microbial strains to achieve high substrate conversion rates or the selection of open mixed microbial cultures (Reis et al., 2003; Verlinden et al., 2007). With all these improvements, the price of PHAs will be likely becoming US$3-4 per Kg (Choi et al., 1997).
2.2.3 – Applications of PHAs
The majority of possible applications for PHAs are as partially or entirely replacements of petrochemical polymers, especially on packaging and coating applications, such as films, personal hygiene products and adhesives (Reddy et al., 2003; Verlinden et al., 2007). Composites of bioplastics are already used in electronic industry (like mobile phones), agriculture (e.g. for encapsulation of seeds and fertilizers or long term dosage carriers of insecticides and herbicides) and chemical synthesis of optically active compounds (Verlinden et al., 2007).
strict specifications for compounds used in human body, only some types of PHAs can be used in medical applications; and those used in contact with blood have to be free of bacterial endotoxins (Verlinden et al., 2007). In consequence, extraction and purification methods have to be developed in order to obtain medical PHAs with high purity levels. Recently, the U.S. Food and Drug Administration (FDA) approved the use of PHAs as suture materials in valve heart replacements (Morrow, 2007).
2.3 – Production of Polyhydroxyalkanoates
2.3.1 – Bacterial Strains and the Carbon Sources used
The traditional and commonly used substrates for bacterial production of PHAs are glucose and other saccharides, oils, alcohols and acids (Lee, 1996). Despite being the most commonly used, these substrates contribute largely to the high price of PHAs, since they represent 70 to 80% of the total raw materials costs. Raw materials have a large impact on total operation costs when production scale increase, accounting for as much as 50% of all operation costs (Choi et al., 1997). Currently efforts have been made to substitute these carbon sources by renewable carbon feedstocks like food waste, olive oil mill effluents, frying and palm oil, sugar beet molasses and cheese whey (Verlinden et al., 2007). Some microorganisms can convert methane (Wendlandt et al., 2005), hydrogen (Pohlmann et al., 2007) and carbon dioxide (Jau et al., 2005) to produce PHAs, but with low PHAs contents and low productivities. Unlikely the use of traditional carbon sources, the use of these inexpensive substrates could lead to significant economical advantages (Verlinden et al., 2007).
So far more than 90 genera of archae and eubacteria able to produce PHAs have been detected in aerobic and anaerobic habitats (Zinn et al., 2001). These include
Cupriavidus necator, Alcaligenes latus, and several strains of methylotrophus,
Pseudomonas oleovorans and recombinant Escherichia coli. All of the aforementioned strains can reach high cell densities with high PHAs content in a short period of time, resulting in high PHAs productivity (Lee, 1996).
Cupriavidus necator (formerly known as Wautersia eutropha, Ralstonia eutropha or
carbon dioxide (Lee, 1996). As mentioned before, PHAs production by a pure culture as
C. necator from synthetic carbon substrate does not seem the most cost-effective process. Nevertheless, the deep study of PHAs production by this microorganism at enzymatic and genetic level is important in order to optimize the production by recombinant bacteria bearing C. necator genes (Verlinden et al., 2007). However C. necator showed already promising results in producing PHAs from renewable resources like soybean oil (Kahar et al., 2004).
Escherichia coli is unable of producing PHAs, however it can use several carbon sources, including some substrates that cannot be easily used by most of the microorganisms, such as lactose (Lee et al., 1997). E. coli grows fast, even at high temperature, is easy to lyse and is one of the most studied bacteria, being its genome extensively studied. For these reasons, E. coli is widely considered as an ideal host for harbouring PHAs producing genes for biopolymer production. Ahn and co-workers (2001) reported a PHB content of 87% of cell dry weight, a PHB concentration of 168 g/L and a productivity of 4.6 gpolymer/L.h, by a recombinant E. coli harbouring the A. latus PHAs biosynthesis genes, which is frequently mentioned as the best results ever obtained by a bacteria for PHAs production. The use of recombinant E. coli is also advantageous for downstream process, since cells can disrupt easily, contrary to the most natural PHAs producers which are often hard to lyse and contain pathways for PHA degradation (Reddy et al., 2003).
2.3.2 – Bioproduction Process
Currently, there are four methods to produce PHAs: in vitro, via PHA-polymerase catalyzed polymerization; and in vivo with batch, fed-batch and continuous cultures (Zinn et al., 2001). The fed-batch method is the most used for PHAs production and consists in a two-stage process: an initial growth phase in nutritionally enriched medium to biomass production, followed by a product formation phase in nutrient-depleted medium (Verlinden et al., 2007).
PHA, resulting in low PHA content and low PHA productivity, even though high cell concentrations can be achieved (Lee, 1996). An example of the effect of a premature limitation is the PHB production by recombinant E. coli limited by oxygen, where when the limitation took place too early, cells and PHB concentrations were lower, even with high PHB content (Ahn et al., 2000). Usually, most of the bacterial strains used in these processes are limited by nitrogen, most of the cases without total depletion (Verlinden et al., 2007).
As mentioned before, recombinant E. coli strains are able to produce high amounts of biopolymer and to achieve high cell concentrations. In order to support the higher grow rate during growth phase, these strains need large amounts of oxygen and, sometimes, is even necessary an addition of pure oxygen. From the economical point of view, this supplementation of pure oxygen to the system is not economically attractive for PHAs production (Park et al., 2002).
2.3.3 – PHAs production from cheese whey
As mentioned above, cheese whey is rich in lactose and, therefore can be used as carbon source for PHAs production. However only few microorganisms are able to convert directly lactose to PHAs. Microbial conversion of lactose to PHAs can follow three possible strategies (Figure 3). The simplest way is the direct conversion of lactose, but only by a limited number of microorganisms (such as Hydrogenophaga pseudoflava
and recombinant E. coli). Other possible way, but more complex, is the fermentation after enzymatically or chemically hydrolysis step of lactose. The resulting monomers, glucose and galactose, will be used by some microorganisms to produce PHAs (such as
Figure 3 – Possible routes to produce PHAs from whey lactose
Considering these possible ways to produce PHAs from whey lactose, the selection of the process to produce PHA from lactose depends on many factors but mainly on the strains available (Koller et al., 2007).
PHB production metabolism includes the production of acetyl-CoA from sugars and, its subsequent conversion into PHB. PHB production is composed by three enzymatic steps (Verlinden et al., 2007), as shown in Figure 4.
Three Possible Routes to produce PHAs from Whey Lactose
Direct conversion of lactose to PHAs
(sufficient β-galactosidase activity of the strain)
First step: Hydrolysis of lactose to
glucose and galactose
(enzymatically or chemically: at lacking or isufficient β-galactose activity of the strain)
Second step: Conversion of glucose
and galactose to PHAs
First step: Conversion of lactose to
lactic acid
(via Lactobacilli)
Second step: Conversion of lactic acid
to PHAs
β-ketothiolase acetoacetyl-CoA reductase
PHB synthase
PHB (R)-3-hydroxybutyryl-CoA
acetoacetyl-CoA acetyl-CoA
sugars
Krebs cycle
The first reaction consists on the condensation of two acetyl-CoA molecules into acetoacetyl-CoA by β-ketothiolase (encoded by phbA gene). The second reaction is the reduction of acetoacetyl-CoA to (R)-3-hydroxybutyryl-CoA by an NADPH-dependent acetoacetyl-CoA reductase (encoded by phbB gene). Finally, the (R)-3-hydroxybutyryl- CoA monomers are polymerized into PHB by PHB polymerase (encoded by phbC gene) (Madison et al., 1999; Reddy et al., 2003; Verlinden et al., 2007).
2.3.4 – Downstream Process
After fermentation, bacterial cells with PHAs are normally separated from the medium by centrifugation (Verlinden et al., 2007). Following this separation step, extraction and purification can be done by several methods. There are two possible strategies for extraction of PHAs. One, by using chemicals after the production step, to lyse cells. Other possibility consists on the use of bacterial strains that can lyse easily, by changing external or internal cell parameters, releasing the biopolymer granules. This last strategy is more difficult to implement since not many organisms present a controllable lysis (Li et al., 2007).
Most of the existing methods for PHAs recovery involve the use of organic solvents, such as acetone and chloroform. In organic solvent-based extraction, PHAs are extracted directly from ground biomass by dissolving it in an organic solvent, usually chloroform. After removing cellular components by filtration, the polymer is precipitated in cold ethanol or methanol. PHAs for medical applications, with purity higher than 98% can be achieved with this method. Despite of the higher purity obtained, the use of chlorinated compounds and the necessity of using large volumes of solvents make this procedure economically and environmental unattractive. As an alternative, digestion with sodium hypochloride (Ling et al., 1997) and surfactants (Ramsay et al., 1990), aqueous enzymatic procedures (Holmes et al., 1984), extraction with supercritical CO2 (Williams et al., 1999) and the employment of less expensive
solvents, like sodium hydroxide or potassium hydroxide, can be used as isolating methods, because they are cheaper and efficient with both high PHB yield and high purity (Li et al., 2007).
3.
Materials and methods
3.1 –
Escherichia coli
Strains
The recombinant Escherichia coli strains used in this work were modified by BIOMEDAL (Spain). A genetic construct, plasmid pMAB26, was obtained in order to integrate the PHB producing genes of Cupriavidus necator into the chromosome of recombinant E. coli, via transposition-mediated mechanism. This new construct contains the PHB operon (with phbC, phbA and phbB genes) inserted in the mini-Tn5 element of plasmid pCNB5 and located under the lactose-inducible Ptrc promoter of this element (Figure 5), allowing a stable integration of these genes and the expression of the corresponding enzymes in the E. coli strains. Plasmid pMAB26 was transferred by conjugation to four rifampicin-resistant derivates of E. coli strains: BL21(DE3), C, MG1655 and ET8000.
The derivates of the E. coli strains obtained were tested for their ability in storing PHAs from lactose. The five best strains were selected for this work: CML 1-1A from BL21 (DE3), CML 2-3A from C, CML 3-1 and CML 3-2A from MG1655 and CML 4-1A from ET8000.
Figure 5 – Construction of plasmids pCNB5 and pMAB26
Hind III Bam HI
phaC1 phaA phaB1
RBS NotI pCNB5 9056 bp la cI -q re gi on bl a tnp* O I oriR6K or iT Ptrc neomy cin
phos ph o tr a n s f e r a s e pMAB26 13687 bp ph aC 1 phaA phaB1 la c Iq bl a tnp* O I or iR 6K o r i T Pt rc neo
Hind III Bam HI
phaC1 phaA phaB1
RBS NotI pCNB5 9056 bp la cI -q re gi on bl a tnp* O I oriR6K or iT Ptrc neomy cin
All recombinant E. coli strains were preserved in frozen samples with Luria-Bertani (LB) liquid medium (Table 3) and 20% (v/v) glycerol and conserved at -80ºC.
3.2 – Cheese Whey preparation
3.2.1 – Composition and characteristics
The cheese whey used in this work was supplied by Lactogal (Portugal). The composition and main characteristics of cheese whey determined by the manufacturer are resumed in Table 2.
Table 2 – Characterization of cheese whey powder
Cheese whey
Fat content (%w/w) 1.21
Protein content (%w/w) 13.62 Lactose content (%w/w) 78.4 Acidity (cm3 per 100g, NaOH 1M) 11.4 Moisture content (%w/w) 1.8
Specific weight (g/l) 570 Insolubility index (cm3) <0.1
3.2.2 – Experimental procedure
3.3 – Experimental set-up
3.3.1 – LB medium experiments
3.3.1.1 – Screening experiments
The screening of the recombinant strain with best PHAs storage capacity was performed with the recombinant strains CML 1-1A, CML 2-3A, CML 3-1, CML 3-2A, CML 4-1A.
3.3.1.1.1 – Medium preparation and composition
The experiments and adaptation steps were carried out in LB liquid medium (Table 3) with 1% (w/v) of lactose. The lactose solution was prepared by dissolving 10.55 g of lactose in 200 mL of distilled water (for 1 L of LB medium). This solution was prepared separately from LB medium to avoid the browning of lactose during sterilization. Then, lactose solution was autoclaved at 121ºC for 15 minutes and after sterilization was joined to LB medium. Also after the LB medium sterilization, 1 mL of Kanamycine (25 g/L) was added to medium.
Table 3 – LB medium (liquid and solid medium) for 1 L of solution
LB medium
Bactotriptone 10.0 g Yeast Extract 5.0 g
NaCl 10.0 g
For solid medium:
Agar 15 g
3.3.1.1.2 – Inocula preparation
inoculate the first adaptation step and 5 mL of the first adaptation step (after 20.5 h of incubation time and an OD600nm of 3.65 with a dilution factor of 1:50) were used for the
second one. These adaptation steps cultures were incubated at 37ºC and 200 rpm.
3.3.1.1.3 – Operating conditions
The experiment was performed in 500 ml flasks with 100 ml of culture and without pH control. Cells were incubated at 37ºC and 200 rpm. The medium was inoculated with 2.5 mL of inocula in exponential phase (with 14 h of incubation time).
The assays were run for 75 h and 8 mL samples were taken every two hours until 16 h of incubation. After this period the shake flask was sampled once every day for three days. The samples were analyzed for PHB, biomass and lactose quantification.
3.3.1.2 – Shake flask experiment with the selected strain
E. coli strain CML 3-1, selected as the best PHAs producer, was utilized in this experiment and in the following ones.
3.3.1.2.1 – Medium preparation and composition
The medium used in this experiment and in the inocula was again in LB liquid medium (Table 3) with 2% (w/v) of lactose. The lactose solution was prepared as in section 3.3.1.1.1, but this time, with 21.1 g of lactose dissolved in 200 mL of distilled water.
3.3.1.2.2 – Inocula preparation
The inocula were prepared in two adaptation steps, in 500 mL flasks with 100 ml of culture broth. One isolated colony from agar plates was used to inoculate the first adaptation step and 5 mL of this adaptation step (with 16 h of incubation time) were used as inoculum for the second one. The inocula were incubated at 37ºC and 200 rpm.
3.3.1.2.3 – Operating conditions
During this experiment, a pulse of a concentrated solution of lactose (8.5%) in LB medium was supplied to culture every time a pH rise was detected.
The assay was run for 47 h and 15 mL samples were taken every hour. These samples were analyzed for PHB, biomass and lactose quantification.
3.3.2 - Defined medium experiments with lactose
3.3.2.1 – Flask experiment
In this batch experiment, strain CML 3-1 was tested in a defined medium with lactose 2% (w/v).
3.3.2.1.1 – Medium preparation
The experiment and adaptation steps were carried out in defined (MR) medium (Table 4) with 2% (w/v) of lactose. The micronutrients solution was prepared in HCl 1M solution with the composition showed in Table 5. Such as lactose, MgSO4.7H2O
solution was prepared and sterilized separately from MR medium, in order to avoid the precipitation of phosphates in presence of MgSO4.7H2O. Proline and Thiamine solution
was prepared by dissolving 400 mg of Proline and 6.740 g of Thiamine-HCl, in 20 mL of distilled water and was sterilized by filtration. Proline and Thiamine solution and the Kanamycine solution were also added to MR medium after sterilization.
Table 4 – MR medium with lactose 2% (w/v), for 1 L solution
MR medium with lactose 2% (w/v) (pH 6.7)
KH2PO4 13.5 g
(NH4)2HPO4 4.0 g
Citric acid monohydrate 1.8594 g Micronutrients (Table 5) 10 mL
Lactose Monohydrate 21.1 g
MgSO4.7H2O 1,4 g
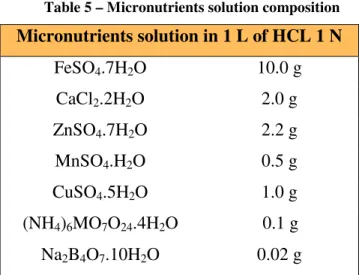
Table 5 – Micronutrients solution composition
Micronutrients solution in 1 L of HCL 1 N
FeSO4.7H2O 10.0 g
CaCl2.2H2O 2.0 g
ZnSO4.7H2O 2.2 g
MnSO4.H2O 0.5 g
CuSO4.5H2O 1.0 g
(NH4)6MO7O24.4H2O 0.1 g
Na2B4O7.10H2O 0.02 g
3.3.2.1.2 – Inocula preparation
The inocula were prepared as in section 3.3.1.2.2.
3.3.2.1.3 – Operating conditions
The experiment was performed in 250 mL flask with 50 mL of culture and without pH control. Cells were incubated at 37ºC and 200 rpm. The medium was inoculated with 5 mL of inoculum in exponential phase (with 13.5 h of incubation time).
The assay was run for 6 days and 5 mL samples were taken twice or three times a day. These samples were analyzed for PHB, biomass, lactose and ammonia quantification.
3.3.2.2 – Fed-batch experiment
In this experiment, the performance of strain CML 3-1 was tested in a fed-batch reactor with several pulses of lactose.
3.3.2.2.1 – Medium preparation
3.3.2.2.2 – Inocula preparation
The inocula were prepared as in section 3.3.2.1.2.
3.3.2.2.3 – Operating conditions
This assay was performed in a 2-L reactor (BioStat® B-Plus, Sartorius, Figure 6) with 1 L of working volume. This experiment was executed at 35ºC, with 100 mL of inoculum (with 13.5h of incubation time) in exponential phase growth. The set-up scheme used in this experiment is shown in Figure 7.
The pH was controlled by automatic addiction of NH4OH 28% (v/v) solution, when
the pH dropped to values lower than 6.5. Dissolved oxygen concentration (DOC, pO2
(%)) was controlled by automatically increasing the agitation speed from 200 rpm to 700 rpm and by aeration flux (2 vvm of pure air, which contains 21% of oxygen). In this fed-batch experiment, DOC was kept near 40%.
Foam formation was suppressed by addiction of an Antifoam solution, Antifoam A (Fluka). The feeding solution contained 105.5 g of lactose dissolved in 1 L of distilled water. During the day, pulses of 200 mL of feeding solution were added manually, when pH value was above 6.75. During the night, the pulses were automatic with the addition coupled to the pH control, based on Ahn and co-workers (2000) procedure. Every time it rose above 7.0, a lactose pulse was supplied.
The experiment was run for 49 h and 15 mL samples were taken every hour during the day. These samples were analyzed for PHB, biomass, lactose and ammonia quantification.
3.3.3 – Defined medium with cheese whey
3.3.3.1 – Flask experiment
In this batch experiment, the same CML 3-1 strain was tested in a defined medium with cheese whey in a shake flask.
3.3.3.1.1 – Medium composition and preparation
The experiment and adaptation steps were carried out in MR medium with cheese whey. Cheese whey solution was prepared as described in section 3.2.2, by dissolving 300 g of cheese whey in 1 L of distilled water. This solution was added to the MR medium (Table 6) in order to obtain 2% (w/v) of lactose in culture broth.
Figure 7 – Fed-batch experiments set-up
Anti-foam
Air/O2
NH4OH
Lactose /
Whey
Table 6 – MR medium with cheese whey, for 1 L solution
MR medium with cheese whey (pH 6.9)
KH2PO4 6.67 g
(NH4)2HPO4 4.0 g
Citric acid monohydrate 0.875 g Micronutrients (Table 5) 5 ml
MgSO4.7H2O 0.8 g
Cheese Whey solution
3.3.3.1.2 – Inocula preparation
The inocula were prepared as in section 3.3.1.2.2.
3.3.3.1.3 – Operating conditions
The experiment was performed in 1 L flask with 200 mL of culture and without pH control. Cells were incubated at 37ºC and 200 rpm. The medium was inoculated with 40 mL of inoculum in exponential phase (after 7 h of incubation with an OD600nm of 2.08
with a dilution factor of 1:20). At the end of exponential phase, a pulse of whey solution (17 mL) was added, in order to re-establish the 20 g/L of lactose concentration in culture broth.
This assay was run for 4.5 days. 13 mL samples were taken four times a day, until the end of exponential phase and once a day after the addition of the second whey pulse. Samples were analyzed for PHB, biomass, lactose and ammonia quantification.
3.3.3.2 – Fed-batch experiment with feeding controlled by pH
3.3.3.2.1 – Medium preparation
The medium used for inocula preparation and in the fed-batch reactor is described in section 3.3.3.1.1. The exception was the feeding solution that contained cheese whey and MgSO4.7H2O (6 g/L).
3.3.3.2.2 – Inocula preparation
The inocula were prepared as in section 3.3.3.1.2.
3.3.3.2.3 – Operating conditions
The experimental set-up of this experiment was similar to the used in section 3.3.2.2.3 with two exceptions: pH and DOC profile. pH was controlled to 6.8 and DOC was maintained at 30%. This time, DOC was controlled automatically by changing the stirring speed in the range 200-1000 rpm and by supplying air supplemented with pure oxygen. When OD600nm reached 60, DOC was limited to 10%.
This experiment was run for 62 h and 15 mL samples were taken every hour. Samples were analyzed for PHB, biomass, lactose and ammonia quantification.
3.3.3.3 – Fed-batch experiment with manual feeding
In this experiment, the fed-batch reactor worked with manual feeding.
3.3.3.3.1 – Medium preparation
The medium used for inocula preparation and in the fed-batch reactor is described in section 3.3.3.2.1.
3.3.3.3.2 – Inocula preparation
The inocula were prepared as in section 3.3.3.1.2.
3.3.3.3.3 – Operating conditions
concentration was monitorized off-line simultaneously with the experiment. In the beginning of the experiment, 120 mL of cheese whey were added to the reactor. When lactose concentration dropped to values lower than 5 g/L, 90 mL of feeding solution (see chapter 2.3.3.2.1) were supplied manually.
This experiment was run for 23 h. 13 mL samples were taken every two hours during lag phase and every one hour during exponential phase. These samples were analyzed for PHB, biomass, lactose and ammonia quantification.
3.3.3.4 – Fed-batch experiment with manual feeding and oxygen limitation
In this experiment, the performance of strain CML 3-1 was tested in a fed-batch reactor with manually added cheese whey pulses and under oxygen limitation.
3.3.3.4.1 – Medium preparation
The medium used for inocula preparation and in the fed-batch reactor is described in section 3.3.3.2.1. The exception was the cheese whey feeding solution that was prepared by dissolving 400 g of cheese whey in 1 L of MR medium, followed by the procedure described in section 3.2.2.
3.3.3.4.2 – Inocula preparation
The inocula were prepared as in section 3.3.1.2.2 but this time with a double amount of ammonia in MR medium (8.0 g/L of (NH4)2HPO4).
3.3.3.4.3 – Operating conditions
The experimental set-up used in this experiment was similar to the described in section 3.3.3.3.3 but now with oxygen limited to 20% after OD600nm reached 100. The
inoculum added to medium was incubated after 8 h with an OD600nm of 4.15 with a
dilution factor of 1:50.
3.3.3.5 – Fed-batch experiment with continuous feeding
In this experiment, the performance of strain CML 3-1 was tested in a fed-batch reactor with cheese whey continuous feeding.
3.3.3.5.1 – Medium preparation
The medium used for inocula preparation and in the fed-batch reactor is described in section 3.3.3.4.1.
3.3.3.5.2 – Inocula preparation
The inocula were prepared as in section 3.3.3.4.2.
3.3.3.5.3 – Operating conditions
The experimental set-up used in this experiment was similar to the described in section 3.3.3.3.3 but now with oxygen limited to 30% after OD600nm reached 100 and a
continuous feeding strategy was applied. The continuous strategy implemented was the following: in the beginning of the experiment pulse of 30 g/L was added manually, then when lactose concentration reached 24 g/L, the continuous feeding was switched on at a flow rate of 15 g/L/h in exponential phase.
The experiment was run for 131 h and 15 mL samples were taken every two hours. These samples were analyzed for PHB, biomass, lactose, ammonia and organic acids quantification.
3.4 – Analytical Methods
3.4.1 – Cell growth and concentration
Cell growth was monitored online by measuring the optical density of 3 mL of sample, at 600 nm (OD600nm) with a spectrophotometer (Elios , ThermoSpectronic).
weight value, usually after 24h. After drying, the membrane with biomass was weighted again and DCW was determined by the Equation 1:
V m m l g
DCW( / )= 1 − 2
where m1 is the mass of the membrane with biomass (g) after drying, m2 is the mass
of the membrane (g) and V is the volume of culture filtrated (L).
3.4.2 – PHB quantification
For quantification of PHB produced, it was used the method proposed by Braunegg
and Comeau, with minor modifications introduced by Satoh (Braunegg et al, 1978;
Comeau et al., 1998; Satoh et al., 1992). Biomass was collected by centrifuge 1 mL of
culture broth at 10000 rpm for 10 minutes. The supernatant was collected for lactose,
ammonia and organic acids quantification. The pellet was resuspended in 1 mL of NaCl
0.9% (w/v) and centrifuged again (10000 rpm for 10 minutes). After centrifugation,
supernatant was discarded and the pellets were frozen in liquid nitrogen before going to
lyophilizer (Telstar, Cryodos). The biomass was lyophilized for 24 h, at approximately
-50ºC and 0.07 mbar, in vacuum.
After lyophilization, 2 mg of biomass were resuspended in 1 mL of a solution of
methanol with 20% of sulfuric acid and 1 ml of chloroform containing 0.88 mg/ml of
heptadecane (internal standard). Then samples were digested in a thermoblock for 3.5
hours and, after cooling, 500 µL of distilled water were added. Samples were shaken for
1 minute in vortex, and then 800 µL of chloroform phase were extracted and transferred
to a 2 mL vial with molecular sieves (0.3nm, Merck). Samples were analyzed in gas
chromatography (GC, Chrompack SP900), equipped with an ionization flame detector,
at 220ºC. 1 µL of chloroform phase was injected in a CPWAX column (60 m, 0.53 mm,
1 µm; Varian), with helium gas as mobile phase, in a split flow manner with a pressure
of approximately 100 kPa. The temperatures program for PHB analysis was: 40°C to
100ºC (10°C/min), 100ºC to 175ºC (3ºC/min), 175 to 220ºC (10ºC/min) and 220ºC
during 1 minute.
A calibration curve correlating the ratio between the peak areas of HB and
standards of HB/HV copolymer (88%/12%; Merck) by subjecting them to the same
treatment as the samples. After GC analysis, PHB content and PHB and active biomass
(X) concentrations were determined.
3.4.3 – Lactose quantification
For quantification of lactose, samples were centrifuged and the supernatant was
diluted 200x with distilled water. After dilution, samples were filtered through a 0.2 µm
membrane. For analyzing the lactose present in whey solution, whey samples were
diluted 1000x with distilled water.
The concentration of lactose was measured by high-performance liquid
chromatography, HPLC (Dionex BioLC) equipped with a Carbopac PA10/MA1 column
(4x250) coupled on a amperometric detector. The injection volume was 10 µL and a
100 mM NaOH solution was used as mobile phase, with 0.8 ml/min flux at 30ºC. For
lactose quantification, standards containing 0.2 g/L, 0.1 g/L, 0.05 g/L, 0.025 g/L and
0.0125 g/L of lactose were used.
3.4.4 – Organic acids quantification
For quantification of volatile organic acids (lactate, acetate, propionate, butyrate,
valerate, formic acid, succinic acid and pyruvate), samples were diluted 20x with
distilled water. After dilution, samples were filtered through a 0.2 µm membrane.
The organic acids were determined by high-performance liquid chromatography
(HPLC) equipped with an Aminex HPX-87H (Biorad) column coupled to an IR
detector. The mobile phase was H2SO4 0.01 N, with an elution rate of 0.6 mL/min and
an operating temperature of 50 °C.
For organic acids quantification were used standards of 1 g/L, 0.5 g/L, 0.25 g/L and
0.125 g/L.
3.4.5 – Ammonia quantification
The concentration of ammonia was measured using an ammonia electrode (Thermo
Electron Corporation, Orion 9512). For ammonia quantification NH4Cl standards were
3.5 – Microscopy analysis
For microscopy visualization of fresh samples, few drops of culture were put in a
slide and observed under microscope in phase contrast (Olympus BX51).
For visualization of stain samples, 1 ml of culture broth was centrifuged at 3.000
rpm for 1 minute and supernatant was discarded. It was added 100 µL of nile blue
solution to the pellet. This pellet was incubated at 55ºC for 15 minutes. Few drops were
put in a slide and were observed in the same microscope using epyfluorescence.
3.6 - Calculations
The PHB content (%PHB) was determined by the Equation 2:
% 100
% = ×
cells PHB
m m PHB
where mPHB is the amount of PHB (mg) and mcells (mg) is the amount of liophylized
biomass in sample.
The PHB concentration ([PHB], g/l) was determined by the Equation 3:
[
PHB]
= PHB×DCW100 %
The active biomass (X) concentration as follows (Equation 4):
[
PHB]
DCW
X = −
The PHB volumetric production rate (or volumetric productivity, rPHB) is defined as
the maximum amount of PHB produced (mPHB max) by reactor volume (V) and by time
(t). rPHB was determined by the Equation 5:
t V m
rPHB PHB
⋅
= max
(2)
(3)
(4)
PHB specific production rate (or specific productivity, qPHB) is defined as the
maximum PHB formation (mPHB max) per maximum active biomass (mX max) and per
time (t). qPHB was determined by the Equation 6:
t m
m q
X PHB PHB
⋅ =
max max
The specific growth rate (µ) is defined as the variation of X concentration per time
unit and X concentration. The µ maximum value (µmax) was determined from the linear
regression slope of the exponential phase of Ln X versus time chart.
The storage yield (YPHB/lactose) and growth yield (YX/lactose) were as follows
(Equations 7 and 8):
consumed lactose
PHB lactose
PHB
m m
Y / =
consumed lactose
X lactose
X
m m
Y / =
The lactose consumption rate was determined from the slope between lactose
concentration and the growth phase time period.
(6)
(7)
4.
Results and Discussion
4.1 – LB Medium Experiments
4.1.1 – Selection of the strain
The five E. coli strains (CML 1-1A, CML 2-3A, CML 3-1, CML3-2A, CML 4-1A)
were grown in LB medium with 1% (w/v) of lactose, for the selection of the best PHB
producer strain. The performance of the five strains is presented in Table 7 (and in
Appendix 8.1.1).
Table 7 – Results obtained in this experiment
Strain DCW
(g/L)
PHB content
(%)
[PHB]
(g/L)
X
(g/L)
YPHB/lac
(g/g)
YX/lac
(g/g)
rPHB
(g/L.h)
qPHB
(g/g.h)
CML 1-1A 4.73 26.14 1.24 3.49 0.10 0.28 0.016 0.005
CML 2-3A 4.17 40.10 1.67 2.50 0.12 0.17 0.022 0.009
CML 3-1 4.07 52.65 2.14 1.92 0.16 0.14 0.029 0.015
CML 3-2A 3.66 45.15 1.65 2.01 0.14 0.17 0.022 0.011
CML 4-1A 4.27 7.65 0.33 3.94 0.04 0.42 0.004 0.001
The results obtained showed that all the five strains were able to produce PHB from
lactose, but CML 3-1 strain was considered the best PHB producer, because presented
the highest content (52.65%), polymer concentration (2.14 g/L), volumetric and specific
production rates (0.029 gPHB/L.h and 0.015 gPHB/gX.h, respectively) and storage yield
(0.16 gPHB/glactose). CML 3-1 was the only strain with a storage yield higher than the
growth yield (0.14 gX/glactose) meaning that, more lactose was consumed for storage than
growth. In opposition, the other four strains drifted more carbon substrate for active
biomass formation than for PHB production. The highest growth yield and,
consequently, the lowest storage yield were observed for strain CML 4-1A, 0.42
gX/glactose and 0.04 gPHB/glactose, respectively. Based on these results the strain selected
4.1.2 – Flask experiments with E. coli CML 3-1 strain
In order to determine the maximum PHB storage capacity of strain E. coli CML 3-1
from lactose, LB medium was used again but this time with several pulses of 2% (w/v)
lactose. When pH rose, which according to Ahn and co-workers (2000) is an indication
of lactose depletion, a new pulse of lactose was added to culture, in a total of five
pulses. The results of the evolution of lactose, PHB and biomass concentration, as well
the storage content and pH are shown in Figure 8.
Figure 8 – PHB production from LB medium with lactose by E. coli CML 3-1, in shake flask
The values of maximum cell dry weight, PHB storage content, maximum active
biomass and polymer concentrations, maximum specific growth rate, storage and
growth yields and volumetric and specific productivities performed with E. coli CML
3-1 in this work are shown in Table 8. During this experiment, cells grew during the first
three pulses but with a minimal PHB quantity production. After the addiction of the
fourth pulse (after 28 h of incubation), the active biomass concentration reached its
maximum value, 9.18 g/L (at 33.42 h of incubation). After this time a PHB production
rate increased sharply and a strong decrease in biomass concentration was observed. At
the end of the experiment (after 47 h of incubation), 81.2% of PHB content and 9.32 g/L
of PHB concentration were obtained. The storage yield was 0.04 gPHB/glactose and the
growth yield was 0.01 gX/glactose. Volumetric and specific PHB production rates
Time (h)
0 10 20 30 40 50
Table 8 – Maximum cell dry weight, PHB storage content, maximum active biomass and polymer concentrations, maximum specific growth rate, storage and
growth yields and volumetric and specific productivities obtained in the nine experiments performed with E. coli CML 3-1 in this work compared with results from
the literature (Ahn et al., 2000)
Culture medium Op erat i on al c on d i t i on s DCWm a x
(g/ L)
PHB con t en t (%)
[ PHB]m a x
(g/ L)
Xm a x
(g/ L) µm a x
(h- 1)
YP H B / l a c
(g/ g )
YX / l a c
(g/ g )
rP H B
(g/ L.h )
qP H B
(g/ g.h )
LB
k
+ lactose 1% (w/v) Without pH control Shake flask; 4.07 52.65 2.14 1.92 - 0.16 0.14 0.029 0.015
LBk + lactose 2% (w/v)
Shake flask; Without pH control; 5 lactose pulses added
11.58 81.17 9.32 9.18 0.03 0.04 0.01 0.20 0.02
MRk + lactose 2% (w/v) Shake flask; Without pH control 4.07 19.86 0.81 3.26 - 0.05 0.19 0.006 0.002
MR + 2% lactose 2% (w/v)
Fed-batch;
Several pulses and feed controlled by pH; With pH control;
DOC > 30%
18.29 25.72 3.46 14.83 0.27 0.01 0.03 0.10 0.007
MRk + cheese whey Shake flask; Without pH control; 2 whey pulses added 4.17 32.26 1.25 2.92 0.04 0.12 0.27 0.012 0.004
MR + cheese whey
Fed-batch; Feed controlled by pH;
With pH control; DOC = 30% (DOC = 10%, when OD=60)
99.37 44.93 33.76 78.65 0.09 0.14 0.50 0.57 0.007
MR + cheese whey
Fed-batch; Manual feed; With pH control;
DOC = 60%
48.50 22.22 10.51 37.99 0.15 0.08 0.28 0.46 0.012
MR + cheese whey
Fed-batch; Manual feed; With pH control;
DOC = 60% (DOC = 20%, when OD = 100)
138.10 19.76 22.62 114.2 0.40 0.03 0.21 0.33 0.003
MR + cheese whey
Fed-batch; Continuous feed (2 mL per minute in exponential phase and 1 mL
per minute in stationay phase); With pH control;
DOC = 60%
37.22 63.02 16.21 23.99 0.24 0.13 0.075 0.12 0.015
MR + cheese whey (Ahn and co-workers (2000)
results)
Fed-batch; pH feeding strategy; With pH control;
DOC = 40%
(when DO = 180, CDW = 60 g/L, DOC = 40% »
of 0.2 gPHB/L.h and 0.02 gPHB/gX.h, respectively, and a specific growth rate of 0.03 h-1
were obtained (see Figure 24 in Appendix 8.1.2 for calculation). Despite the similar
values of PHB storage content obtained in this experiment (81.17%) and obtained by
Ahn and co-workers (2000) (80%), the volumetric productivity obtained (0.2 gPHB/L.h)
was much lower than 2.57 gPHB/L.h obtained by Ahn and co-workers (2000) (Table 8).
This difference on productivity values is probably due to the fact that Ahn and
co-workers assay was performed in a fed-batch reactor with defined medium with cheese
whey and this experiment was performed in a shake flask with rich medium with
lactose. So, the operating conditions related to oxygen availability and medium
composition were different and could influence cells performance.
Along the experiment, a gradual lactose accumulation was observed, resulting from
the fact that, contrary to the expected, lactose was not depleted when a new pulse of
lactose was added. This means that a small increase on pH value can not suggest that
lactose was completely consumed from the external medium. Comparing the obtained
results with the CML 3-1 screening experiment results (see section 4.1.1), more PHB
was produced (9.32 g/L in this experiment and 2.14 g/L in the previous one) since more
carbon source was supplied to the microorganisms. In the external medium lactose
concentration reached a maximum value of 59.5 g/L.
The morphology of the cells was monitored throughout the experiment by
microscope observation under phase contrast (Figure 9). Cells became elongated while
PHB granules were accumulated intracellularly. This morphologic modification was
also detected by Kim and co-workers (1992) in recombinant E. coli strains. PHB
4.2 – Defined Medium Experiments with Lactose
After testing E. coli CML 3-1 in a rich medium, this strain was cultivated in a
chemically defined medium, also with 2% (w/v) of lactose as carbon source. The
change to a chemically defined medium is related with the raise of industrial production
costs, if a rich medium is used, due to its higher complex medium composition.
4.2.1 – Flask experiment
Initially, the strain was tested in MR medium with lactose 2% (w/v) in a shake flask.
The results obtained, regarding lactose and ammonia concentration, as well as polymer
storage content, OD600nm and pH are shown in Figure 10.
Figure 9 – Fresh samples of E. coli CML 3-1 strain lengthening and storing PHB; a) after 7h of incubation, b) after
47h of incubation (1000x)
Figure 10 – PHB production from lactose in MR medium by E. coli CML 3-1, in shake flask
At the end of the experiment cell concentration reached 4.07 g/L with a PHB content
of 19.9% corresponding to 0.81 g/L of PHB and 3.26 g/L of active biomass
concentration. Storage and growth yields were 0.05 gPHB/glactose and 0.19 gX/glactose,
respectively. The volumetric and specific productivities were 0.006 gPHB/L.h and 0.002
gPHB/gX.h, respectively (Table 8).
These results showed the performance of CML 3-1 strain in MR medium is worse
than in LB medium (see section 4.1.1 and Table 8). Thought in this experiment lactose
concentration was the double as in the former, the maximum amount of PHB produced
(0.81 g/L) was less than a half of the value obtained for LB medium (2.14 g/L).
Despite the low polymer production, the cell dry weight concentration obtained with
MR medium was the same as with LB medium (4.07 g/L). This means that in MR
medium was achieved a higher active biomass concentration (3.26 g/L) than in LB
medium (1.92 g/L). So, in this MR experiment, lactose was consumed preferentially for
cell growth. This result is confirmed by comparing growth and storage yields of these
two experiments. The growth yield obtained in MR medium (0.19 gX/glactose) was higher
than what was achieved in LB medium (0.14 gX/glactose) screening experiment, while the
Time (h)
0 20 40 60 80 100 120 140