Performance
of
On
l
ine
Advert
is
ing:
Search
,
D
isp
lay
and
Soc
ia
l
Med
ia
Ads
Mar
iana
D
ias
Carr
iço
Dissertation submittedin partial fulfillment of requirements forthe degree of International Masterin Management at Universidade Católica Portuguesa
ADVISOR: Ana Isabel de Almeida Costa June 2016
ABSTRACT
Title of the dissertation: “Performance of Online Advertising: Search, Display and Social Media Ads”
Author: Mariana Dias Carriço
Digitaladvertisingis becomingincreasinglyrelevant.In particular, managersare gradually allocatingthe online budgetto mobile and social media advertising. Forthat reason,it becomes essentialto understandthe performance of different adtypes andthe dynamics within each format and platform.
The presentstudyaimstocompare differentadtypes – search, displayandsocial media – whilst assessing the impact of different devices – mobile devices and computers– on online campaign performance. Moreover, it seeks to understand the factors that explain the performance within each adtype. This dissertation focuses on a B2B companythat advertises aninvoicing software using Google and Facebook. Tothis end,the studyis based on descriptive quantitative research, analyzing secondary data from sixteen campaigns.
The results showthat search ads perform better on averagethan social media and display ads. However,the device ofimpression has also a significantimpact on campaign performance. In fact, ads displayed on mobile devices yield more clicks and ads displayed on computer desktops generate more conversions. On Facebook, users often clicked on an ad in a mobile device andswitchedto a computerto convert. Besides,thetargetingstrategy adoptedin display and social media ads has a significantinfluence on performance. On social media, ads retargetedto visitors ofthe company’s website originated significantly more conversions. In conclusion, these findings are relevant for managers in allocating the online budget across adtypes andin optimizingthe ads for different devices andtarget audiences.
Keywords: Online Advertising, Search, Display, SNS, Social Media, Google, Facebook, Targeting.
SUMÁRIO
A publicidade digital tem um pesocrescente na despesaem publicidade. Em particular,as empresas estão a alocar o orçamento digital a publicidade móvel e nasredes sociais. É essencial compreender o desempenho de diferentes tipos de anúncios e a dinâmica dentro de cadatipo de formato e de plataforma.
O presente estudo compara diferentes tipos de anúncios – anúncios de pesquisa, de display e de redes sociais – analisando o impacto dos dispositivos de exibição – dispositivos móveis e computadores – no desempenho decampanhas. Além disso, pretendeidentificar osfactores explicativos do desempenho decadatipo deanúncio. A dissertaçãofoca-se numaempresa comercial queanuncia umsoftware defacturaçãoatravés do Googlee do Facebook. Numa óptica de pesquisa quantitativa descritiva, este estudo analisa dados secundários de dezasseis campanhas.
Os resultados mostram que os anúncios de pesquisa têm em média um melhor desempenho. Contudo, o dispositivo deimpressãotem umainfluência significativa no mesmo. Os anúncios exibidos em dispositivos móveis geraram mais cliques e os anúncios exibidos em computadores mais conversões. No Facebook, alguns utilizadores clicaram no anúncio através de um dispositivo móvelesubscreveramaosoftware numcomputador. Adicionalmente,a estratégia de segmentação adoptada nos anúncios display e nas redes sociaisinfluenciou o seu desempenho. No Facebook, osanúnciosredireccionadosaos visitantes dosite daempresa originaram significativamente mais conversões.
Concluindo, estes resultados são relevantes na alocação do orçamento digital a váriostipos de anúncios e na optimização dos anúncios para diferentes dispositivos etipos de público alvo.
Palavras-chave: Publicidade Digital, Pesquisa, Display, Redes Sociais, Google, Facebook, Segmentação.
ACKNOWLEDGEMENTS
I would like to express my gratitude to my thesis advisor, Professor Ana Isabel Costa, who was extremely helpfulin all stages ofthe process. Fromthe discussion of potentialtopics and statistical approaches to the thorough revisions and valuable feedback, her help was essential duringthe past four months.
Moreover,I wouldliketothank my mentorandformer managerat Live Content, Sérgio Gonçalves, who helped me understandthe dynamics ofsocial mediaandcontributed with importantinsightsto mythesis. Besides, myinternship at Live Content allowed meto access the datathatis object of analysisinthis study andthat originated constructive results.
Finally, I want to show appreciation for my father, with whom I often discussed the practicality of my dissertationand who helped me definearelevanttopic of analysis. In addition, his constant availabilityto debate on my work was a crucialinputtothis study.
TABLE OF CONTENTS
CHAPTER 1: Introduction...11
1.1. Background and problem statement ...11
1.2. Aims and scope ...12
1.3. Research methods ...13
1.4. Relevance ...14
1.5. Dissertation outline ...14
CHAPTER 2: Literature Review and Conceptual Framework...15
2.1. Online advertising ...15
2.1.1. Online advertisingindustryin Portugal ...15
2.1.2. Advertising formats...15
2.1.3. Advertising platforms ...17
2.1.4. Targeting strategies ...18
2.1.5. Pricing strategies...19
2.1.6. Metrics ...20
2.1.7. Social network advertising ...21
2.1.8. Mobile advertising ...22
2.1.9. Industry benchmarks for online advertising ...23
2.2. Conclusions ...25
CHAPTER 3: Methodology ...27
3.1.Research approach...27
3.2.Research methods...27
3.2.1. Data collection ...27
3.2.2. Dataset preparation ...28
3.2.3.Performance variables...28
3.2.4. Independentvariables of the global regression model ...29
3.2.5. Independentvariables of the displayregression model ...29
3.2.6. Independentvariables of thesocial media ads regression model ...30
3.2.7. Tests ofnormality ...31
3.2.8.One samplet-tests...32
3.2.9. Zero-inflated negative binomialmodel ...32
CHAPTER 4: Results and Discussion ...34
4.1.Descriptive statistics...34
4.1.1. Descriptive statistics ondisplayads ...36
4.1.2. Descriptive statistics onsocial media ads ...37
4.2.One-samplet-tests...39
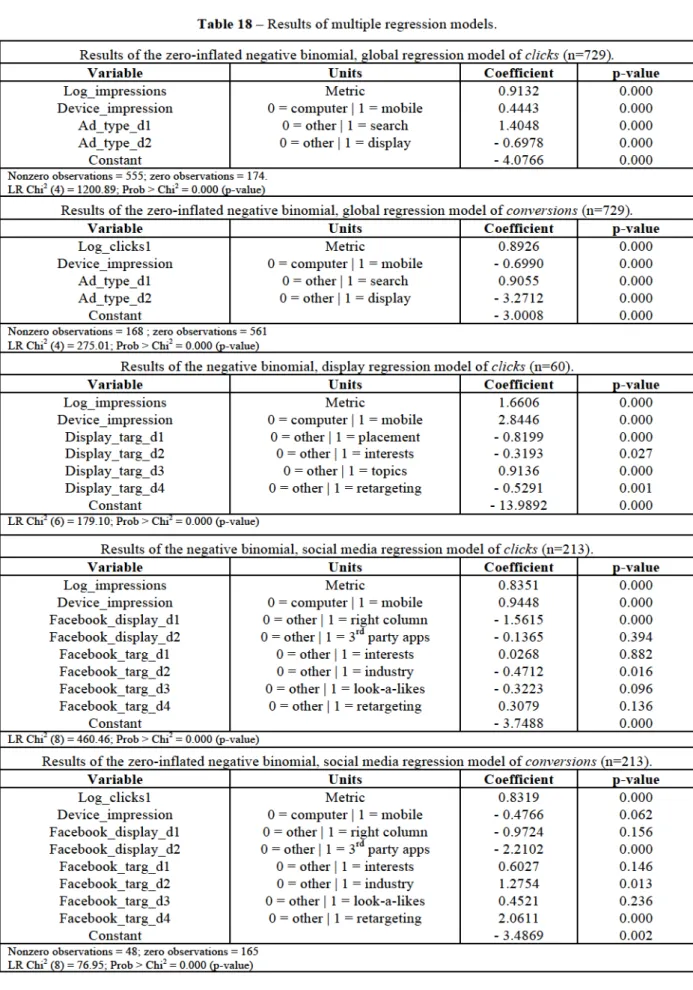
4.3.Globalregression model...40
4.4. Display regression model...42
4.5.Social media regression model...42
4.6.Campaign optimization ...44
4.7. Summary ofthe results and discussion...45
CHAPTER 5: Conclusions and Limitations ...48
5.1.Limitations and future research...48
5.2.Conclusions ...49
TABLE OF FIGURES
Figure 1 – Facebookad placement: Desktop newsfeed, desktoprightcolumnandaudience
network (banner,interstitial and native)...18
Figure 2 – Average CTR for search, social and display by device in 2014 of Marin’s larger customerslocatedin 12 countries and Eurozone (Marin Global, 2015)...24
Figure 3 – Globalaverage CR by deviceandchannelin 2014 of Marin’slargercustomers locatedin 12 countries and Eurozone(Marin Global, 2015)...25
Figure 4 – Histograms ofthe distributions ofCTR,CR,clicks andconversions...31
Figure 5 – Evolution ofthe CTR andCR of search ads overthe campaign period...44
TABLE OF TABLES
Table 1 – Targeting options at Google Display Network (Google, 2016)...19
Table 2 – Metrics of Google Adwords and Google Display Network for the B2B industry, in the US marketin Q2 2015 (Wordstream, 2016)...23
Table 3 – Details ofthe 16 ad campaigns providing datafor analysis, by platform and timeframe...28
Table 4 – Independent variables and units of analysis includedintheglobal regression model. ...29
Table 5 – Independent variablesand units ofanalysis includedin the Google Displayads regression model...30
Table 6 – Independent variables and units of analysis includedinthe social media ads regression model...30
Table 7 – Results of Kolmogorov-Smirnov and Shapiro-Wilk tests of normality of CTR, CR, CPC andCPA...32
Table 8 – Descriptive statistics ofimpressions,clicks,conversions,CTR, CR, CPC andCPA (n=729)...34
Table 9 – Descriptive statistics of performance variables bytype of ad...35
Table 10 – Descriptive statistics ofCTR per adtype and device ofimpression...35
Table 11 – Descriptive statistics ofCR per adtype and device ofimpression...36
Table 12 – Descriptive statistics ofclicksand CTR per device andtargeting strategy of display ads...37
Table 13 – Descriptive statistics of conversions and CR per device and targeting strategy of display...37
Table 14 – Descriptive statistics of clicks and CTR perdevice, targeting strategy and display placement of social media ad...38
Table 15 – Descriptivestatistics: Conversionsand CRacross device,targetingstrategyand display placement of social media ads (n=213)...39
Table 16 – Descriptivestatistics of conversions and CR per device,targetingstrategyand display placement of social media ad...39
Table 17 – One-sample t-tests for each type of ads, comparing average CTR and benchmark for each adtype (Kim, 2014; Rich Media Gallery, 2016; Salesforce, 2013)...40
TABLE OF ANNEXES
Annex 1 – Box plot of performance variables CTR and CR...56
Annex 2 – Kurtosis and skewnesslevels ofthe variables CTR andCR...56
Annex 3 – Histogram of variables log_impressions andlog_clicks1...56
Annex 4 – One-samplet-tests SPSS results...56
Annex 5 – STATA results of zero-inflated negative binomial, global regression model of the variable clicks...57
Annex 6 – STATA results of Cragg hurdle, global regression model ofthevariable log_CTR. ...58
Annex 7 – STATA results of zero-inflated negative binomial, global regression model of the variable clicks with control variable log_clicks1...58
Annex 8 – STATAresults ofzero-inflated negative binomial global regression of variable clicks with control variable log_clicks...59
Annex 9 – STATA results of negative binomial, display model regression model of variable clicks...59
Annex 10 – STATA results of negative binomial, social media regression model of variable clicks...60
Annex 11 – STATA results of zero-inflated negative binomial, social media regression model of variable clicks...60
Annex 12 – STATA results of zero-inflated negative binomial, social media regression model of variable conversions with control variablelog_clicks1...61
Annex 13 – STATAresults ofzero-inflated negative binomialsocial mediaregression of variable conversions with control variablelog_clicks...61
GLOSSARY
B2B – Business to business (B2B) companies focus on selling to other businesses, either to incorporatein other products or for final use.
B2C – Businessto consumer (B2C) companies focus on sellingtoindividuals as final consumers and markettheir products for personal use.
CPA – Cost per action (CPA) is the ratio between total cost and number of actions (subscription, purchase,etc.). Asa pricing model,theadvertiser paystothe publisherthe CPA forthetotal number of actions.
CPC – Cost per click (CPC)isthe ratio betweentotal cost and number of clicks. As a pricing model,the advertiser paystothe publisherthe CPC forthetotal number of clicks.
CPM – Cost per mille (CPM) or cost perthousandisthe cost perthousand views/impressions. Asa pricing model,theadvertiser paystothe publisherthe CPMforthetotal number of thousandimpressions.
CR – Conversion rate (CR) is a performance metric that measures the number of clicks that resulted on conversions. Itis given bythe ratio betweenthe number of conversions and clicks. CTR – Click-through rate (CTR) is performance metric that measures the number of impressions that resulted on clicks. It is given by the ratio between the number of clicks and impressions.
SERP – Search Engine Results Page is the search engine’s webpage that presents theresults for a specific group of keywords.
SNA – Social Networking Advertisingisthe advertising on Social Networking Sites.
SNS – Social Networking Sites (SNS) are platformsto build social networks, often referred as social media. Examples of SNS are Facebook, Twitter and LinkedIn.
CHAPTER 1: INTRODUCTION
This chapter presents the topic and aim of the dissertation. It starts by analyzing the background of online advertising and the problem statementthatledtothe aim ofthe dissertation, presented afterwards together withthe relevantresearch questions. Next,the research methods applied and the academic and managerial relevance of the topic are described, ending withthe outline ofthe dissertation.
1.1. Background and problem statement
Onlineadvertisingis gainingrelevanceinthe marketing budget offirms worldwide.Itis estimated that, by the end of 2016, the amount allocated to digital advertising reaches $163 billion. This willrepresent 25% ofthetotal expenditure on advertising (Kireyev, Pauwels and Gupta 2014). Another relevant trend is mobile advertising, which is expected to increase to $50.84 billion and come to represent 24.9% of the total media ad spending in the US market by 2017 (eMarketer, 2015). Online advertising also brought new targeting options to companies,suchasremarketing,i.e.,theabilitytotargetcustomers who have been onthe advertiser’s website but did notcompletea purchase onexternal websites(Lambrechtand Tucker, 2013).
Given the growing importance of online ad channels, managers are focusing on better understandingand usingrelated metrics,suchas cost-per-acquisition(CPA)and ad click -through rate(CTR), among others(Kireyev et al. 2014). However, unlike in traditional approaches, these metrics are highly dynamic andinterconnected(Peters, Chen, Kaplan, Ognibeni and Pauwels 2013). Hence,the dynamic effects observed between differenttypes of onlineadvertising,suchas paidsearchand displayads, haverecently becomesubjects of study byacademics (Xu, Duandand Whinston 2014; Lewisand Nguyen 2012). Kireyev, Pauwels and Gupta (2014), forinstance,studiedtheimpact of display ads on search behavior. Theirresults showed that displayads actually increased searchconversionratesand boost searchclicksandimpressions, andthatsuchcross-effects couldactually be moreimportant thanthe directeffects ofthistype of onlineads. Therefore, other academicstudies have suggested that combining different advertising formats may increase the conversion rates of online ad campaigns.Yet,the different digital adsa prospect consumer faces before becoming an actual buyer are often nottakeninto account when evaluatingthe performance of a campaign, sinceit is hardtotracethe customerjourney duringthe purchase funnel.Campaign
performanceisthustypically based onlast-clickattribution models,thatis, itassumesthat sales conversions are essentially due to the one ad the consumers click onlast and that leads themtomake an actual sale onthe advertisers’ e-commerce website (Li and Kannan 2014). Advertising in Social Network Sites (SNS) differs from online advertising in general (Zhang & Mao, 2016), asit has a specific ecosystem of users (Safko & Brake, 2009). However,there isstilllack ofresearch ontheeffectiveness ofadvertising onsocial media(Zhang & Mao, 2016). Michaelidou, Siamagka and Christodoulides (2011) assessedthe use of SNS by a mail survey deliveredto 1000 business-to-business (B2B) small and medium enterprises (SMEs)in the UK. The study showed that although almost half of the sample intended to increase their marketing spending on SNS, the majority did not adopt any metrics to assess SNS effectiveness (Michaelidou, Siamagka & Christodoulides, 2011).
It is important to notice that most academic studies regarding online advertising focus on the B2C marketand theindustriestherein. Thereisstilllack ofresearch on how,forinstance, companies make use Social Networking Sites(SNS), especiallythose operatingin B2B markets (Michaelidou, Siamagkaand Christodoulides, 2011). Mullarkey(2012) dividedthe current SNSliterature based onthe nature ofthe users, after reviewing 160 academic articles. Accordingto hisstudy,literature could be dividedintotwo macro categories: SNS with Individualsas Users(IAU)and SNS with Organizationsas Users(OAU). Theauthoralso dividedthe first category between users who actin a personal capacity and users who have a professional behavior - on SNS such as LinkedIn - (Mullarkey, 2012). According to Mullarkey (2012), alarge number of studies discussthe use of B2C companies of SNS forthe purpose of advertising and selling.
In line with this, there is still no clear measurement of performance of different ad formats, like display ads,paid search adsand social media ads.Moreover, there is still a great lack of research on theeffect of device on online advertising performance.
1.2. Aims and scope
This dissertation aims to evaluate and compare the performance of differentonline ad types. The moderating effects of differenttargeting strategies and digital devices on ad performance will also be explored. In orderto achievethe stated aims,the following research questions are addressed:
RQ2 – Whatistherelative performance of different digital devices ofimpression in online advertising?
RQ3 – What factorsinfluencethe performance of display and social media ads?
This dissertation focuses on measuring the performance of different formats of digital advertising, specifically display ads (Google Display and Facebook ads) and paid search ads (Google Adwords).It focuses on the campaignsran by a Portuguese digitalagency, Live Content,for one ofits clients operating in a B2B market, namelyselling differenttypes of managementsoftware(HRand CRMsystems,invoicingsoftware,among others) to other companies. Itisimportantto notethat,the productthatis beingadvertised(aninvoicing software) is targeted mainly to startups. Hence, the product is being advertised to individuals who represent their own startups and are able to take decisions on invoicing software adoption. In addition, giventhatthese campaigns wereran bothin mobile and desktop devices, it is also possible to investigate whether there are significant differences of type of digital device inad performance.
Finally, this dissertationintendsto detectifthere are significant differencesin performance for using differenttargeting optionsforeachadformat,suchasretargeting,contextualand placementtargeting andtargeting byinterests,topics,industry, demographics andlook-a-like users on Facebook.
Theinformation usedislimitedtothe metrics provided bythe advertising platforms of Google and Facebook. The study focuses on sixteen campaigns for invoicing software targetedtostartups,seven of whichinvolved paid search ads and nine displayads. Most campaigns had overlaps and the general time scope considering all campaigns is from the 7th
of September 2015tothe 2nd of February 2016.
Therefore, other advertising formats are notincludedinthis study, neither advertisingin other platforms besides Googleand Facebook. Moreover, onlinecampaigns outside Portugaland outsidethe definedtime scope were not considered. Finally, campaigns fortangible products, for otherindustries are not object of analysis ofthis dissertation.
1.3. Research methods
Quantitative,secondary dataaboutthefeaturesand performance ofseveral adcampaigns, conducted for the above-mentioned B2B client advertiser by Live Content was compiled and statistically analyzed. Allthe campaigns were promotingthe same product and offered a 50%
discount, which could be redeemed by subscribingthe invoicing service for a 30-day freetrial period.
The research approach of the dissertation is categorized as a descriptive quantitative research and all quantitativeinformation was extracted from Google Adwords and Facebook Business Manager platforms. The dataset compiledthe metrics for all sixteen campaigns, whichintotal comprised 729 groups ofads. Thestatisticalanalyses,ran on SPSS and STATA,included descriptive and inference statistics and multiple regression analysis using the Negative Binomial model. The dependent variables correspondtothe performance metrics of ad campaigns, namely clicks andconversions.
1.4. Relevance
Fromanacademic perspective,this dissertationcontributestotheexisting body ofresearch about the performance ofdifferent types of online ads by including the influence of different devices. Of further valueisthe factthatit alsoinvestigatesthe potential moderating effects of ad targeting strategy on ad performance. Besides, there is still no existing theory developed specifically for understandingthe effectiveness of advertising on social media (Zhang & Mao, 2016). Hence, this dissertation contributes with relevant insights on advertising performance insocial media.
From a managerial perspective,this research should help marketersto understand better what arethe key drivers of onlinead performanceandthe potentialeffects of differentformats, digital media devicesandtargetingstrategies. Ultimately,this dissertationintendsto help marketers to make more informed decisions when allocating the marketing budget in online advertising andto optimize adsto specific devices andtarget audiences.
1.5. Dissertation Outline
Chapter 2 presents aliterature review about online advertising andthe performance of different ad formats, along withthe main conclusions andthe research hypotheses. Chapter 3 describesthoroughlythe research methods used,the data collected andthe statistical analyses performedtotestthe hypothesesabouttheeffectiveness of display, paidsearch andsocial mediaads. Chapter 4 presentsand discussesthe mainresults obtained from dataanalysis. Lastly, Chapter 5 presents the main conclusions and implications of this dissertation, as well asthelimitationsandrecommendationsfor futureresearch addressingthe effectiveness of online advertising campaigns.
CHAPTER 2: LITERATURE REVIEW AND CONCEPTUAL FRAMEWORK
2.1. Online Advertising
TheInternet enablesthe extension ofthetraditionalfunctions of offline advertising. For instance,itallows consumersto,throughanad format suchasa banner, be immediately directed to an e-commerce website and complete a purchase online in a seamless manner (Li and Leckenby, 2004). Digital advertising spending worldwide in 2015 reached already 170.5 billion US dollars. Thisfigure isestimatedtoincrease nearly 48% until 2018. Moreover, global social network advertising was estimated to reach $25.14 billion in 2015, with Facebook drivingits growth and capturing almost 65% of SNS adrevenues(eMarketer, 2016).
2.1.1. Online advertisingindustryin Portugal
In Portugal, the marketingagencyservicesector haschanged considerablyinthelast 10 years, withthe emergence of multiple digital agencies competing againstthe bigger traditional agenciesthat provide both offline and online services (Personal Communication, 2016). Most of these digital agencies have a clear focus, like lead generation or Search Engine Marketing (SEM). Live Content was foundedin 2009 and focuses onsocial media marketing, having clientsin both B2C and B2Bindustries. Generally speaking, client advertisersopen a callfor tenders by several marketing agencies, for a particular campaign.Each agency then develops an onlinestrategy based onthe briefing provided bythe client.Itis commonfor client advertisersin Portugalto work with morethan one agency atthetime,forthe performance of online ad campaigns with different aims and scopes (e.g. paid search, lead generation, social media content and community management, website development, etc.) (Personal Communication, 2016).
2.1.2. Advertising Formats
The Internet brought along new channels and advertising formats such as search and display ads (Lewisand Nguyen, 2012). One ofthe most usedtermsin digital marketingis SEM, which entails the different means of marketing a website and comprises both organic, search engine optimization (SEO) and paid search strategies (Sen, 2005). SEO is based on optimizing website codes – such astitletags orlinks onthe site– to makethem more relevant and more search-engine compatible, resulting on higher positions in the search-results pages
of search engines like Google (Sen, 2005). Paid search or paid placements differ from SEO sinceadvertisers pay directlytothesearchenginefor placementinthespecificsponsored section ofthe search engine.
Buyers generally trust more theresultsinthe editorialsectionratherthanthesponsored section (Sen, 2005). Since this section has limited spots, search engines sell them through an auction, where advertisers make a bid to be placed on the ‘recommended’ list for a keyword search (Chen and He, 2011). Broadly speaking,paid search auctions are PPC (pay-per-click) continuoussecond-priceauctions(Kittsand Leblanc, 2004). Eachadvertiserentersa bid, which represents the maximum amount they are willing to pay for a click in their advertisement. Thenthe auctioneer, such as Google, ranksthe participants butthese positions are re-calculated during the day and the advertisers may change their bids for that keyword. Finally,theauctioneer determinesthe pricethateach bidder will pay perclick, whichis usuallythe bid ofthecompetitorimmediately below – hence beingasecond-priceauction (Kitts and Leblanc, 2004).
Display ads are graphical,sometimesinteractive,advertisements displayed onregular web pages(Papadimitriouetal. 2011). AccordingtoeMarketer(2016), USspending on display ads will outweighthe spendingin paid search adsin 2016 forthe firsttime, being estimatedto reach $32.16 billion (against $29.24 billion for paid search). Within display ads, the biggest playeris Facebook, accounting for 25.2% ofthetotal US digital display ad revenuesin 2015, followed by Google witha 13% ofrevenueshare(eMarketer, 2015).Infact,social media display ads are growing dueto mobile advertising and accordingto eMarketer (2015), Facebook’s US mobile ad revenues will grow morethan 50% from 2014to 2017.
The effect of display ads on search has been amply studied by academics. Lewis and Nguyen (2012),forinstance,concludedthat displayadsincreasesearchfortheadvertised brand by 30% to 45%. However, they also increase search for competitors’ brands by 23% (Lewis & Nguyen, 2012). Although the online click rates are low in general, display ads were found to effectively lift retail sales both online and offline (Fulgoni & Lipsman, 2014). If search ads and display ads are used separately and exclusively,theformer has a biggerimpact on consumer behaviorthanthelatter. Thisimpactis superior bothin online behavior and offline sales. However, the reach of display ads is generally higher than that of search ads (Fulgoni and Mörn, 2009). Moreover, thereare clear synergies betweenthetwoformatsinterms of performance, both in buying penetration and dollar sales per thousand customers exposed. In
fact, whenthetwoformatsarecombined,the overall performanceis betterthan using two formats separately at different pointsintime (Fulgoni and Mörn, 2009).
2.1.3. Advertising Platforms
Within the paid search advertising market, Google Adwords is by far the ad platform most used by advertisers. It hada market share of nearly 76% inthe second quarter of 2015, against 24% ofits biggest competitor, Yahoo!’s Bing(Search Engine Land, 2015). When using Google Adwords,itis keyto understand itsad biddingsystem,i.e.,thesystemadopted by Googleto rank adsto appearinits sponsored section ofthe SERP. Thethree main elements of a paidsearchcampaignarethe keywords,theadsandthelanding page – a web pagethat serves as an entry pointto a website or a particular section ofthe website. The ranking system that Google uses – Ad Rank– to select the ads that are displayed in thesponsored section of theSERPis based onthe bid (moneythe advertiseris willingto pay for a click),the quality of the ad(relevancetothesearch query) andthelanding page(how connecteditistothe keywords selected),in orderto provide a good user experience forthe user (Google Adwords, 2014).
Regarding display advertising, advertisers can use the Google Display Network – group of websites, videosandapps – to displaytheirads. This networkiscreatedthrough Google AdSense, a Google product that allows web publishers to earn money by having ads on their websites (Google Support, 2014). When using the Google Display Network, advertisers can choose howthe websites will be selectedto displaytheir ad. In one hand,it can be by relevant keywords ortopics. Onthe other hand,they canselectspecific websites orevenaudiences (Google Support, 2014). Allthis can be managed using Google Adwords,the same platform where advertisers manage paid placements. One ofthe biggest advantages of AdSenseisthat itiscontextual,i.e.,it presentstheads within websites withthesamecontext, providinga higher chance of usersto click onthem (Karch, 2016).
Facebook isthe biggest SNSinthe world, with 1.65 billion dailyactive users atthefirst quarter of 2016(Statista, 2016). SNS ad revenues are growing worldwide, but Facebook dominates fiercelythisindustry. It had$16.29 billionin ad revenues worldwide in 2015 andis estimated to grow to $26.98 by 2017. Twitterranks second in ad revenues with $2.03 billion in ad revenues worldwide in 2015 (eMarketer, 2016). Facebook Ads presents different options based onthe main campaign objectives intended(e.g. pagelikes,clickto website, website conversions, app installs, app engagement, event responses, etc.), the selected
audience and the budget allocated. Ads can be presented as Link Ads, Carousel Ads or Page Post Engagement(boosting posts) (Facebookfor Business, 2016). When,forinstance,the main objectiveis conversions onthe website(e.g. a registration, asale, alead, etc),the advertiser addsaconversion pixel(acode)tothe HTML ofthe webpageit wantstotrack (Facebook for Business, 2016).
On Facebook, advertisers can select where they want their ads to be displayed, either on the newsfeed(bothfor mobileand desktop), on therightcolumn, onthird-partyappsthrough audience network (network of mobileapps or mobile websitesthat have beenapproved by Facebooktoshow ads) or onInstagram, asitisrepresented on Figure 1(Facebookfor Business, 2016).
Figure 1 – Facebook ad placement:Desktop newsfeed, desktop right column and audience network (banner, interstitial and native).
One ofthe most recent functionalities of Facebook Adsis Canvas, atoolthat enhances mobile ad experience. After clicking on an ad, users are directedto a full-screeninteractive ad, which caninclude videos,text, stillimages and call-to-action buttons (Facebook for Business, 2016).
2.1.4. Targeting Strategies
Advertisers oftentailortheir adsto specific audiences and adopttargeting strategiesin display advertising. Google provides severaltargetingtoolsforthe ads displayed onits Google Display Network, presentedin Table 1.
Table 1 – Targeting options at Google Display Network (Google, 2016). Google Display - Targeting options
Remarketing Targets users who already visitedthe advertiser’s website before. Keyword Contextualtargeting Show ads on websites relatedtothe specified keywords.
Reaches users whenthey are reading aboutthe advertiser’s products, usuallythistype oftargeting optionis made atthe keywordlevel. Placementtargeting Show ads on websites specified bythe advertiser.
Interest categorytargeting Show ads based on userinterests (e.g. sports ortravel).
Topics categorytargeting Similartotheinterest categorytargeting, butintopics (e.g. fitness, entertainment).
Geographic and Languagetargeting Show ads wherethe advertiser’s customers arelocated: display ads by language and region.
Demographicstargeting Show ads based on age and gender. It can be combined with other targeting option.
Facebook also offersseveraltargetingtools, based onlocation, demographics,interestsand behaviours (Facebook for Business, 2016). One of the most used tools are Custom Audiences, atool which allows advertiserstotargettheir Facebook Adstotheir current customers based on email andphone number provided in the user profile. The first step is to haveacustomer databaseina CSVfile – either with phone numbers oremails. Then,the CSV file can be uploaded to Facebook Power Editor, which is a Google Chrome plug in to manage Facebook Ads. Finally, Facebook will findthecustomers on Facebookandthead willappear ontheirfeed(Loomer, 2012). Moreover, Facebookincludedthe possibilityfor advertisersto broadentheirtargetaudience withthe Lookalike Audiences,i.e.,audiences composed by users that are similar to the advertiser’s established customers – with a minimum of 100 customers (Facebook Developers, 2016). Facebook creates Lookalike Audiences byfindinga newsegment based onsimilarity withinthe Custom Audiences.In thatsense,advertisersareabletocommunicate not onlytotheirestablishedcustomers, but also to Facebook users that have similar interests. This is especially valuable to those advertisersthat havelimited customer bases (Loomer, 2014).
2.1.5. Pricing strategies
Pricing modelsin digitaladvertising haveevolved overtime. One ofthe most used pricing models in the early days of digital advertising is the cost-per-mille (CPM), which represents the cost per athousandimpressions. This modelissimilartothe one usedintraditional media
(print, outdoor andtelevision) advertising (Hu, Shin and Tang, 2015). However, becausethis strategyincentivizesimpressionsand not clicks orconversions, performance-based pricing modelsstartedto gainrelevance over a decade ago. Thefirst performance-based pricing modeltoappear wasthecost-per-click(CPC). This was adopted by Googleand Yahoo in 2002 and was the most extensively used pricing model in paid search advertising for a long time (The Economist, 2006). It was subsequently defied by another performance-based pricing model – the cost-per-action(CPA), wherethe advertiser paysfor a pre-specified action that could be a purchase, a lead, an email sign-up or a download (Hu, Shin and Tang, 2015).
Thereis some debate about which pricing strategyis more suited. On one side, many publishers claim that they prefer the CPM model because of the lack of control on some ad performance factors, such as design or attractiveness of the offer. On the other side, advertisers prefer a performance-based pricing, claimingthatit does not make senseto pay for adsthat do not generate value (Hu, 2004). Nonetheless, performance-based pricing models are gainingrelevance. Based onasurvey developed by PwCandIAB(Interactive Advertising Bureau)inthe US market, approximately 65% of 2015 ad revenues were priced on a performance basis,againstthe 33%and 2%that were priced ona CPMand hybrid basis, respectively (IAB, 2016).
A potential explanation is that online publishers can improve the effectiveness of ad campaigns by making non-contractibleefforts. Sincetheseeffortsarecostlyto publishers, they needthe rightincentivesto do so(Hu, 2004). CPA models are usually more favorable for the advertisers, as they shift the riskto ad design and placement. In fact, the clicks on the ad that do notconvertintosales do notrepresentacostforadvertisers. However,this type of model may leadto adverse selection problems,as the best advertiser also has higher costs and lower margins than in the CPC model (Hu, Shin and Tang, 2015). Besides, online publishers arguethatthe CPA model gives advertisers fewerincentivesto convert clicksinto purchases, causing a moral hazard problem. For instance, if advertisers’ main goal is brand awareness, they cantake advantage of such pricing model asthey can displaytheir ads without paying for the views or clicks (Hu, Shin and Tang, 2015).
2.1.6. Metrics
Onlineadvertisingentails severaltypes of metricsto measureitseffectiveness. One ofthe most common metricsisthe Click-Through Rate (CTR) – thepercentage of users who clicked
onthe ad fromthetotal amount of users who sawthe ad - since it reflects best the attractiveness ofthead andthe offer. Nevertheless,advertisersare typicallyfocused onad conversions,i.e.,thelikelihood of a userto make a purchase, register or subscribe a servicein its website after clicking on an online ad. This likelihood can be estimated from the measurement of conversion rates, the percentage of ad clicks that generate a purchase amongst all ad clicks (Xu, Duan and Whinston, 2014).
The return on advertising investment (ad ROI) is the ultimate metric to measure the performance of an advertising campaign.Different definitions andformulae of calculation are availableforad ROI. The most generic formula istheratio between profit(sales revenue minus ad costs) and total ad cost. For a paid search campaign supported by a CPC pricing model, the ad ROI is thus influenced by ad design and placement costs, clicks, conversions and revenues,in casethe relevant unit of actionis a sale conversion (Karwal, 2014).
In orderto perform wellin paidsearchcampaigns usinga CPC pricing model,thereare several key successfactors. First,itis essentialto get a high click-through-rate(CTR). Second, it is important to reduce the CPC, by improving the Google quality score of the ad. Asexplained before,the qualityscoreinfluencestheadrankingandtheamount paid per click, reducing wasted spend (paid clicksthat do not convertto sales) (Karwal, 2014). Nonetheless,the pricing modeladopted willinfluencethe ROI,astheriskshifts between advertiser and publisher, as explained previously.
ROIinsocial media differsfromthetypical online advertising ROI, asitrequires more qualitative measurementsratherthan qualitative andthereis still controversy aroundits measurement(Fisher, 2009). Thechallengearises bythe need of not only measuringthe effectiveness of online advertising within social media, but alsothe framework surroundingit. Thereis still an ongoing searchto definethe ROIin social media, sinceit moves beyond web analytics (Fisher, 2009).
2.1.7. Social Network Advertising
Accordingto eMarketer (2016),total ad spending worldwidein SNSis expectedto reach $41 billion by 2017, an estimated growth rate of morethan 129%, comparedtothe $17.85 billion spentin 2014. Social mediaadvertising differsfrom onlineadvertisingin general,asthe perceivedintrusiveness ofadvertisinginsocial mediais higher(Zhang & Mao, 2016)and also becausesocial media has a unique ecosystem of usersthat differsfromtheregular Internet environment (Safko & Brake, 2009).
Accordingto Taylor, Lewin and Strutton (2011),the keytointegrate advertising successfully in SNS is consumer acceptance and excessive commercialization can lead to user abandonment.Intheir study, SNA(Social Network Advertising) includedtwoforms of advertising: both explicit (banners and videos) andimplicit (fan pages and firm-related posts) (Taylor, Lewin & Strutton, 2011). Resultsshowedthat,inthecontext ofsocial media,the entertainment value of adsinfluences greatly consumers’ attitudestowards online ads.
Meanwhile, consumer motivations play an important role in determining both the perceived entertainment value andtheinformativeness value of an ad (Zhang & Mao, 2016). Zhang and Mao (2016) studied howtwotypes of motivationsinfluenced ad clicks and behavioral intentions: consumption motivations (reading, watching or listening to social media content) andconnection motivations(connect withfriends,socializeandchat). Thestudyconducted with 613 social media usersinthe US concludedthat consumption motivations have a positiveimpact on both perceivedentertainment valueandinformativeness value. Onthe other side, theeffect of connection motivations onthesetwo valuesis moderated by ad-media congruity (Zhang & Mao, 2016). Ad-media congruityis defined asthe degreeto whichthe ad material is thematically similar with the editorial content (Zanjani, Diamond & Chan, 2011), suchassocial mediafeeds. Boththe mentioned perceived valuesandtheattitudestowards SNS had animpact on ad clicks (Zhang & Mao, 2016).
2.1.8. Mobile Advertising
Mobileadvertisinginvestmentis growingrapidlyanditisestimatedtosurpass desktopad spending for the first time in 2016, accounting for 51.9% of total digital spending in the US market (eMarketer, 2015). Within mobile ad spending, 51.1% of the budget was allocated to display ads and 44.7%to search campaignsin 2015. The display ads are estimatedto continue havingthe highestshare of digitaladspending until 2019, althoughitsrelativeimportance will decrease (eMarketer, 2015).
Mobileads (ads displayedin mobile devicessuchassmartphonesandtablets) differfrom desktop ads in the sense that marketers can take advantage of targeting options, such as the abilitytotarget based onlocation. Infact, not onlylocation can have animpact onthe effectiveness ofanad, butalso other contexts suchas physicalcrowdedness – forinstance, commuters in crowded subways were shown to be more responsive to mobile ads than those in non-crowded trains (Andrews, Luo, Fang and Ghose, 2015). One possible explanation for these resultsis mobileimmersion,i.e., as peoplein a crowded environment are susceptibleto
negative emotions such as anxiety, they turn their attention to their more mobile devices and hence become morelikelytoclick onads(Andrewsetal., 2015). Moreover,accordingto Bart, Stephenand Sarvary(2014), mobile displayadsare moreeffective for products with high involvement and with high on a utilitarian dimension, since they generate higher purchase intentions compared to low involvement products and products with hedonic dimensions.
2.1.9.Industry benchmarks foronline advertising
Digital advertisingin Portugal has risen from €20 millionin 2008to €40 millionin 2013, and it is estimated to reach €55 million by 2015 (Statista, 2016). In order to assess the performance of advertising campaigns, it is key to compare metrics against industry benchmarks. Table 2 summarizesinformationfroma Wordstreamreport withasample of 2367 US-basedfirmsin 2015. It describesthe average click-throughrate, cost-per-click, conversionrateandcost-per-actioninthe B2Bindustry and compares itsaverage withthe average of all theindustries reported. These arelegal services,auto, B2B, consumer services, datingand personals,e-commerce,education,employmentservices,financeandinsurance, health and medical, home goods, industrial services, legal, real estate, technology, travel and hospitality (Wordstream, 2016).
Both B2Band B2C averages arerelevanttothis dissertation, sincetheadvertiserisa B2B company but the invoicing software is advertised to individuals who represent startups. B2B industry metricsare higher for Google Adwordsthan for GoogleDisplay (Table2).The B2B industryreported betterresultsthantheindustries averageinthe CTR, CPC and CR of Google Adwords campaigns. On Google Display campaigns, it performed better at the CPC, CR and CPA levels. It is important to note that both CPA and the conversion rate depend on whatthe advertisers defines as a conversioninthe Google Adwords platform (a sale, alead, a registration, etc).
Table 2 – Metrics of Google Adwords and Google Display Network forthe B2Bindustry,inthe US marketin Q2 2015 (Wordstream, 2016).
CTR CPC CR CPA
B2B Indusaverage tries B2B Indusaverage tries B2B Indusaverage tries B2B Indusaverage tries Google
Adwords 2.55% 1.91% $1.64 $2.32 2.58% 2.70% $63.57 $59.18 Google
However, CTRforsearch might varysubstantially depending onseveralfactors,suchas search ad position. For instance, a search ad ranked in the first position yields on average a 5.5% CTR, against an average of 4% in the second position (Kim, 2014). Regarding display ads, the Rich Media platform by Google provides benchmarks for display ads in the Google Display Network by country. Accordingtothe same platform, theaverage display ads CTRin Portugal is 0.23% ("Rich Media Gallery | Display Benchmarks", 2016), close to the benchmarkin Table 2forthe B2Bindustry. Onthe other hand,accordingtoareportfrom Salesforce Marketing Cloudabout the performance of Facebook in Portugal(Salesforce, 2013), theiraverage CTRis 0.375%andtheiraverage CPCis €0.06. However,the CTR varies greatly depending onthe ad placement, with an average CTR of 2.03% for an ad placed onthe newsfeed (Salesforce, 2013).
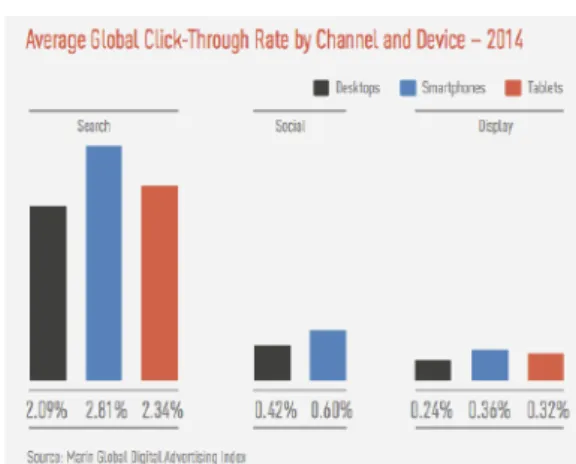
A report from Marin Global (2015) assesses information from Marin’s business customers in 2014 that managed morethan $6 billionin annualized search, social and display spend. These were locatedin Australia, Brazil, Canada, China, Eurozone,India, Japan, Mexico, New Zealand, Russia, Singapore, UKand USA and included large brandssuchasIBM, GAP, Lonely Planet, Symatec, Macy’sand Bloomingdales. Hence,thereportis biasedtowards large advertisers spending morethan $100,000 on paid search, social and display and may not reflecttrends for small and medium businesses (Marin Global, 2015). Accordingtothis study, CTRs are higher for ads appearingin mobile devices (both mobile phones andtablets) thanin desktops, as represented in Figure 2. Search ads have notably higher CTRs than display and social medias ads, since search engines are still the main channel for users to find goods and services. This makes search campaign ads more likely to be clicked,given their relevance to the user (Marin Global, 2015).
Figure 2– Average CTR for search, social and display by devicein 2014 of Marin’slarger customerslocatedin 12 countries and Eurozone (Marin Global, 2015).
Nonetheless, conversion rates are higherin desktopthan mobile devices,independently ofthe channel orformat used (Figure 3).Itisinterestingto notethatsomeshoppers use mobile devices for browsing when they are at the start of the purchase funnel, later on moving to a desktop, asthey getclosertothe conversion stage. This cross-deviceinteractionshould be tracked, in ordertoachievethe highestadvertisingeffectiveness byretargetingadsseen on mobileto the same consumers whenthey are using adesktop later on (Marin Global, 2015).
Figure 3 – Global average CR by device and channelin 2014 of Marin’slarger customerslocatedin 12 countries and Eurozone (Marin Global, 2015).
2.2. Conclusions
First of all, regarding the relative performance of different types of ads, paid search ads tend to perform betterthan displayads(Fulgoniand Mörn, 2009).Inthatsense,two hypotheses were formulatedto addressthe first research question:
H1.a: Search ads generate more clicks perimpressionsthan display and social media ads. H1.b: Search ads generate more conversions per clicksthan display and social media ads.
Nonetheless, display ads are gaining importance as the expenditure on display is expected to outweighthe expenditure on search by 2016 (eMarketer, 2016).
Secondly, mobile advertisingis gainingrelevance and accordingto areportfrom Marin Global(2015), users are morelikelyto click on mobile ads, but generally convert(e.g. complete a purchase, subscribe a service) on a desktop, which makes the cross-device
interaction critical for advertising effectiveness. Hence, to address the second research questiontwo hypotheses were formulated:
H2.a: Ads displayed on mobile devices generate more clicks perimpressions. H2.b: Ads displayed on computers generate more conversions per clicks.
Finally, focusing onthefactorsthat mightinfluencethe performance of displayandsocial mediaads, retargetingisa highly usedtargetingstrategy duetoits proveneffectivenessin converting undecided users(Lambrecht and Tucker, 2013).In orderto answerthethird research question,two hypotheses was formulated:
H3.a: Thetargeting strategy influencesthe relative performanceof display ads. H3.b: Thetargeting strategyinfluencesthe relative performance of social media ads.
CHAPTER 3: METHODOLOGY
This chapter describesthe research approach adoptedto answerthe research questions, depictingthe methods usedto collectthe secondary data andthe statistical analysisthatit was subjectedtotestthe research hypotheses presentedin Chapter 2.
3.1. Research Approach
There arethree maintypes of research approaches. Whilst exploratory research aimsto clarify theresearchenvironment,andcausalresearchtoassessacause-effectrelationship between two variables, descriptiveresearchintendsto describethecharacteristics ofa population or phenomenon (Hyman and Sierra, 2010). In this dissertation, the research hypotheses will be addressed through descriptive research, making use of quantitative secondary data. Quantitative approach seeks to test objective theories, by examining the relationship between variables(Creswell, 2013).In addition,research can either belongitudinal, when datais collected over time, or cross-sectional, when the collected data is from one specific point in time(Hymanand Sierra, 2010).In this dissertation,althoughthecampaignsanalyzed were implemented for five months,the datais analyzed as cross-sectional andthetime evolutionis assessed separately.
3.2. Research Methods 3.2.1. Data Collection
Data referringtothecharacteristicsand performance of past online advertising campaigns conducted by Live Content wascollectedandcompiledin excelfiles. Thetimeframe for campaign data collection was from September 2015to February 2016.The sixteen campaigns selected always promoted exactly the same offer: a mobile invoicing software, offered at a 50% discount ofthe full yearly price, obtainablethrough a 30-day freetrial subscription ofthe invoicing software. The campaigns were conducted using two platforms – Google and Facebook – andintwoformats – searchand display. Forsimplicity ofanalysis,they were dividedintothreetypes of ads – search, display and social media ads (Table 3).
In orderto collect allthe data from Google and Facebook,it was necessaryto usetheGoogle AdWords and Facebook Business Manager platforms. These platforms provide campaign information such as investment, number of impressions, clicks and conversions, and metrics such as CTR, average CPC and conversion rate.
Table 3 – Details ofthe 16 ad campaigns providing data for analysis,by platform and timeframe. Platform Format “Type of Ad” Date range of all campaigns Number of
campaigns Google Search Search 7/09/2015 – 2/02/2016 7 Google Display Display 8/09/2015 – 30/09/2015 4 Facebook Display Social Media 9/09/2015 – 15/01/2016 5
3.2.2. Dataset preparation
Aftercollectingallthe datainexcel filesfrom Google Adwordsand Facebook Manager platforms,these were combinedinto one single SPSS dataset. First of all,it was necessaryto alignsome variablesacross platforms. Sincethe variable device_impression had different units for each platform, it was divided only between mobile and desktop for the purpose of simplicity of analysis. For instance, on Google both tablets and mobile devices weredefined as mobile. For Facebook ads, all other devices werecategorizedas mobile(iPhone,iPad, android and others), except for computer. All categoricalindependent variables (with n categories) were subsequently recodedinto n-1 dummy variables,to guaranteethatthe linearity assumption between variablesis satisfied(Tabachnick &Fidell, 2007).
Finally, giventhatstatisticalinferences becomelessrobust when variables do notfollowa normal distribution, some variables were transformed through a logarithm transformation to improvetheir normality(Tabachnick &Fidell, 2007).
3.2.3.Performance variables
The B2B company that represents the advertiser of the invoicing software had one strategic goal:conversions,i.e.,subscriptionstothe 30-dayfreetrial ofthesoftware. Thecustomer lifetime valueis consideredreasonably high, sothefocus was on maximizing customer acquisitions rather than minimizing the cost per acquisition. Hence, the primary goal was to increasethe number of subscriptions and notthe cost-effectiveness ofthe campaign.
The performance metrics assessedinthis dissertation arethe CTR, which are based on clicks and impressions, and the CR, based on conversions and clicks. The first metric is considered as the measure of “attractiveness”, as it represents the number of people who clicked on an ad after they were exposed to it. The latter is considered as the level of “effectiveness”, as it representsthe amount of people who converted after clicking on an ad.
Althoughitis keyto understand costlevels ofthe campaigns, namelythe CPC and CPA (cost per conversion inthis case),these twolast variables were not considered as dependent variables becausethe main goal ofthe campaigns wasto maximize conversions.
3.2.4.Independent variables of the global regression model
This dissertation aims to compare different platforms and ad formats, but also to analyze the dynamics within each ad type. In order to do so, the research approach started with a broad comparison of all ads, followed by anin-depth study within each platform.
Table 4 liststheindependent variablesincludedintheglobalregression andtheir classes.The adtypecorrespondsto whetherthecampaign wassearch or displayadsandthe platform where it was delivered – either Google search (search), Google display (display) or a Facebook ad (social media ad). The device ofimpression correspondstothetype of devicein whichthe potential customer searched forthe keyword or sawthe ad.
Table 4 – Independent variables andunits of analysis includedintheglobalregression model. Independent variable Unit of analysis
Adtype Search
Display Social Media Device ofimpression Computer
Mobile device
The global regression modelintends to assess whether the ad type and the device impression influencesthe dependent variables of performance. However,this model does nottakeinto account specificities of each ad type. Since search ads are defined by keywords and not by a segmentation strategy, further researchis focused on display and social media ads.
3.2.5.Independent variables of the display regression model
In order to understand what variables influence the ads performance within Google Display (named as display ads in the ad_type variable), a specific regression model for this platform was estimated. Itsindependent variables are presentedin Table 5andinclude boththe device ofimpressionandthetargetingstrategyadopted. Thelatterisclassifiedaccordingtothe strategies defined by Live Contentto advertisetheinvoicing software onthis platform. Namely, thestrategiesadoptedincludedcontextualtargeting, placementtargeting, targeting byinterests ortopics and retargeting.
Table 5 – Independent variables andunits of analysis includedintheGoogle Display ads regression model. Independent variables Unit of analysis
Device impression Computer Mobile device Targeting strategy Contextual – keywords
Placement Interests
Topics Retargeting
3.2.6. Independentvariables of the social media regression model
In the same logic, a specific regression model was conducted to analyze other variables that mayinfluencethe performance of adsin social media,in particular on Facebook. Aside from the device of impression, the independent variables are presented in Table 6 and include also thetargetingstrategy, which differsfrom Google Display. On Facebookads, Live Content targetedtheinvoicing software ads by demographics,interests andindustry. Besides,it used a targeting tool described in chapter 2 – look-a-like users – and retargeting. The demographics ofthetargetaudience mustalways be defined(suchaslocation, genderandage) before targeting byinterests orindustry. However, when Live Content did not add anytype of segmentation besides demographics,the variable was classified as “demographics” only. Moreover, the placement of ads on Facebook and the device through which users converted, i.e. subscribed to the free trial, were also considered as independent variables. Although the variable device_impression was definedforallcampaigns,the variable device_conversion was only accessible for Facebook campaigns.
Table 6 – Independent variables andunits of analysis includedinthesocial media adsregression model. Independent variable Unit of analysis
Device ofimpression Computer Mobile device Targeting strategy Demographics
Interests Industry Look-a-like users
Retargeting Display Placement Newsfeed
Right column
Third party apps – network audiences Device of conversion Computer
3.2.7. Tests of Normality
Figure 4 presentsthe histograms of the performance variablesconsidered (CTR, CR, clicks and conversions).
Figure 4 – Histograms ofthe distributions ofCTR,CR,clicks andconversions.
Afteranalyzingthe histograms(Figure 4) and box plots(Annex 1) and observingthat all performance variables tail off to the right, it was necessary to run the appropriate normality tests. Annex 2 presentsthe kurtosis andskewnesslevelsfor thetwo variables. First, all variables present positive kurtosislevels, confirmingthatthe distributionis peakedin relation to the normal distribution. Second, all variables also present positive skewness values, which confirms that the variables have only a few large values and tail off to the right (Hair et al., 2010).
Finally, specific tests to assess normality, in particular the Shapiro-Wilk test and a modification of Kolmogorov-Smirnov test, which calculate the levels of significance for the differencesfroma normal distribution (Hairetal., 2010). Theresultsfromthesetestsare presented in Table 7 and given the low p-values for both tests for all the variables; the null
hypothesesthatthese variables differ from a normal distribution are not rejected.
Table 7 – Results of Kolmogorov-Smirnov and Shapiro-Wilk tests of normality ofCTR, CR,CPC andCPA. Tests of Normality
Kolmogorov-Smirnov Shapiro-Wilk
Statistic df Sig. Statistic df Sig. CTR 0.340 729 0.000 0.369 729 0.000 CR 0.386 729 0.000 0.319 729 0.000 Impressions 0.408 729 0.000 0.229 729 0.000 Clicks 0.400 729 0.000 0.236 729 0.000 Conversions 0.439 729 0.000 0.128 729 0.000
3.2.8. One-sample t-tests
In orderto comparethe average performance ofthe ad campaignstobenchmark performance values, a one-samplet-test was analyzed for eachtype of ad. Thetested variablewas CTR, as itincludes bothclicks andimpressions. Theseare more easily comparedthan conversions. As earlier explained, a conversion may be defined by the advertiser as a sale, a subscription or otheraction. This limitsthecomparison between benchmarks. Moreover,since conversions only occur after a click, CTR also becomes animportant variableinthe performanceanalysis.
3.2.9.Zero-inflated negative binomial regression model
The metrics defined as appropriate to measure the performance of campaigns are ratios and, forthatreason,theyareconcentratedclosetozeroandcontainseveralzeros. Thistype of situations posesa probleminterms of multivariateanalysis,sincetheycannot bealtered simplytrough alogarithmtransformations withoutlosinginformation.
The most appropriate regression modelis a zero-inflated negative binomial regression. First of all, a zero-inflated model addressesthe excess zerosin a distribution, without disregarding thisinformation. Secondly,a negative binomialregression addressesthe problem of over-dispersion, when compared against the Poisson regression (Yau, Wang, & Lee, 2003). Since thistype ofregressionsrequirescount data,theratios (CTRand CR)cannot be used, but ratherthe variablesthat generatethese ratios,i.e., clicks,impressions andconversions.
Hence,in orderto assessthe level of “attractiveness” ofthe ad,given bythe metric CTR,the variable clicks is defined as dependent variable, whilst controlling for the variable impressions,includedintheregression as exogenous. Since impressions is not normally distributed,the variableincludedinthe regressionisitslogtransformation: log_impressions= log10(impressions). The histogram ofthelatteris presented on Annex 3.
Toassessthelevel of“effectiveness”, given bythe metric CR,the variable conversions is defined as the dependent variable, whilst the variable clicks is considered a control variable. The variable clicksis not normally distributed and some observations are zero. Hence, for all observationsit wasadded onein this variable(the valuethatis usuallyset) beforethelog -transformation (O’Hara & Kotze, 2010). The variable included in the regression is: log_clicks1=log10(clicks + 1).
For thesake of simplicity,the variablesincludedintheinflate part ofthe model,i.e.,the variablesto predict excess zeros, arethe same asthe control andindependent variables ofthe model. Theinflate partis not object ofanalysisand hencethis part will not be described furtherin detail.
3.2.10. The Cragghurdle model
In ordertoincreasethe reliability ofthe results fromthe negative binomial model, a different model was tested for the global regression model. A hurdle model is also used in Economics toaddressexcesszerosandis based ontwo“decisions”thatare madeinsimultaneous:a participation decision(zero or one)andaconsumption decision(level of variation within positive observations) (Humphreys, 2013). Moreover, a hurdle model assumesthat zero observationsare genuinezerosand not missing values.It isimportantto underlinethatthe Cragg model,in particular, assumesthatthe unobservable factors affectingthe first “decision” are uncorrelated withthe unobservablefactorsaffectingthesecond“decision”(Humphreys, 2013). Nonetheless, this model was tested merely to compare with the results from the zero -inflated negative binomial one.
CHAPTER 4: RESULTS AND DISCUSSION
4.1. Descriptive statistics
First ofall,itisimportantto havean overall perspective ofthe dependent variableacross different factors. The invoicing software that is being advertised aims to acquire new customersforthe B2B company, especially startups and SMEs. However,the product’s profitability is very low, since the main strategy is cross-selling other products and services after acquiringthese new customers. Hence,the main goal ofthe companyis customer acquisition, whichinthis case translatesin thesubscription of a 30-dayfreetrial ofthe invoicing software. If customers are satisfied withthe software,they can getthe software for a year for halfthe price.
Table 8 describesthe mean,standard deviation, minimumand maximum value ofthe CTR, CR, CPC and CPA acrossalladsandalsothe variablesthat helpcomputetheseratios – number of impressions,clicks,conversions andcost.
The metrics compared included the number of impressions and conversions (service subscription), the CTR, CR, CPC and CPA. In a first look, it is easily detectable that all the variables are highly dispersed, since for all of them, the standard deviation is higher than its mean.
Table 8 – Descriptive statistics ofimpressions,clicks,conversions,CTR, CR, CPC andCPA (n=729).
Table 9 depictsthe descriptive statistics bytype of ad and provides more detail about variable distribution. Clear differences in performanceare observable between search, displayand social media ads.Infact,searchads have, onaverage,a much higher CTR and CR than
display and social media ads. Social media ads perform better than display, on average. It is importantto notethatthe number ofobservationsin search ads was considerably higherthan inthe cases ofdisplay and social media ads.
Table 9 – Descriptive statistics of performance variables bytype of ad.
In orderto assess whetherthe differencein performance across adtypes also varied whenthe ad was seen on a mobile device or on desktop, it was necessary to analyze in more detail the descriptive statistics for each performance variable. Table 10 presents the mean and standard deviation of CTR across adtypes and device ofimpression. By analyzing it,the main conclusionisthatthe mean CTR is higherforadsseen on mobile,independently ofthead type. Nevertheless, the standard deviation is also always higher. Table 11 presents the mean andstandard deviation of CR acrossadtypesand device ofimpression.Itcan beseenthat mean CR is always higher for ads seen on a computer ratherthanin a mobile device, although with higher dispersion.
Table 10 – Descriptive statistics ofCTR per adtype and device ofimpression. CTR
Ad Type Device_impression Mean Std. Deviation N
Computer 5.28% 4.95% 171
Mobile device 7.16% 16.51% 285
Search
Total 6.46% 13.42% 456
Computer 0.08% 0.04% 20
Mobile device 0.77% 0.43% 40
Display
Total 0.54% 0.48% 60
Computer 0.31% 0.35% 47
Mobile device 1.82% 2.59% 166
Social Network Ad
Total 1.48% 2.38% 213
Computer 3.86% 4.77% 238
Mobile device 4.83% 12.96% 491
Total
Table 11 – Descriptive statistics ofCR per adtype and device ofimpression. CR
Ad Type Device_impression Mean Std. Deviation N
Computer 5.41% 10.65% 171
Mobile device 2.09% 9.11% 285
Search
Total 3.34% 9.83% 456
Computer 0.29% 0.66% 20
Mobile device 0.25% 1.58% 40
Display
Total 0.26% 1.34% 60
Computer 1.96% 3.41% 47
Mobile device 0.57% 2.21% 166
Social Network Ad
Total 0.88% 2.58% 213
Computer 4.29% 9.32% 238
Mobile device 1.43% 7.11% 491
Total
Total 2.37% 8.01% 729
4.1.1. Descriptive statistics of displayad performance
In orderto haveathoroughanalysis ofthe dynamics withineachtype ofad, descriptive statistics foreachtype ofad were computed. Table 12 presentsthe mean, minimumand maximum of clicks and CTR of display ads, across different devices ofimpression and targeting strategies. Again, both clicks andCTR are substantially higher for display ads seen on a mobile rather than a computer. When comparing different targeting strategies, although clicks varyconsiderablyfor differentstrategy,the CTR variationsareless pronounced. The only exceptionisretargeting, which hassubstantially more average clicks and CTR. The targeting option that seems to be less efficient when considering the CTR is “placement” or “managed placement”. This is when the agency specified websites or mobile apps to display the ad.
Table 13 presents the mean, minimum and maximum of conversions and CR of display ads, across different devices of impression and targeting strategies the same information as there were only five conversions originated from display ads, which limits the comparison ability between devices ortargeting options. In fact,thereis no sizeable differencein conversions or CR between devices or betweentargetingstrategies. The optionsthat appearto be more effective aretargeting bytopics and retargeting. Still,the sampleislimitedly small.
Table 12 – Descriptive statistics ofclicksand CTR per device andtargeting strategy of display ads.
Table 13 – Descriptive statistics ofconversions and CR per device andtargeting strategy of display.
4.1.2. Descriptive statistics of social media ad performance
In orderto have afirst understanding onthe dynamics of social media ads, descriptive statisticsforthe different performance variables wereanalyzed. Table 14summarizesthe information for different devices,targeting options and ad placement on Facebook.Similarto what was observed inall types of ads,clicks andCTR are substantially higher for social media ads seen on a mobile. On the other hand, when comparing different targeting strategies, the variable industry has the lowest average performance. The other options do not have accentuated differences,although look-a-like users have higheraverage clicks,followed by retargeting.Interms ofad placement,although third-party apps have moreabsoluteclicks, theads on newsfeed have higher averageCTR.
Table 14 – Descriptive statistics ofclicks and CTR per device,targeting strategy and display placement of social media ad.
There were a total of 309 conversions originated from social media ads.Table 15 depicts the differences between variables interms ofconversions andCTR. Averageconversions andCR are much higherfor Facebookadsseen onacomputer desktop than on mobile, whichis opposite to what happens with clicks and CTR. Regardingtargeting options,itisclearthat retargeting is the most effective strategy in terms of average conversions and CR. Similarly, ads placed onthe newsfeed appearto have a better performancethan ads onthe right column orthird-party apps.
Table 16 shows cross-device conversions and is key to understand cross-device switch, i.e., whether usersclicked onasocial mediaadin one deviceandswitchedto other deviceto convert, or the opposite. In fact, computers performed better in terms of absolute number of conversions. People whoclicked ona Facebookad onacomputeralwayssubscribedthe invoicing software on the same device. However, from the users who clicked on the ad on a mobile device, 18 switched to a computer to subscribe the software trial. In terms of average cost performance, adsseen, clicked and convertedthrough a mobile device had alower average CPCand CPA.Inthissense,itisrelevantto envisageacross-device approachto social mediaads,forinstance optimizing mobileadsforclicksand websitein desktopfor conversions.
Table 15 – Descriptive statistics ofconversions and CR per device,targeting strategy and display placement of social media ad.
Table 16– Conversions,CR,CPC andCPA of social media ads per device ofimpression and conversion.
4.2. One-sample t-tests
In search ads,the campaigns average was compared againstthe CTR benchmark of 5%, based on the assumption that best performers in paid search advertising achieve CTRs close to this value (Kim, 2014). In display ads,the benchmarkis specific for Portugal, whichincreasesthe validity oftheresults obtainedforthe campaigns under analysis ("Rich Media Gallery| Display Benchmarks", 2016).Insocial mediaads,the benchmarkisalsospecificforthe Portuguese market, butitis an average of alltypes of Facebook ads(Salesforce, 2013). Nonetheless, it is important to notice that the CTR on Facebook ads varies greatly, yielding higher CTRsforads placed onthe newsfeed(Salesforce, 2013). Table 17 summarizesthe information from the statistical t-tests ran in SPSS (Annex 4) to compare means. As observable,the p-valuesforallthetestsfall below 0.05,rejectingthe null hypothesisthat