Gonçalo Filipe Marques Policarpo
Licenciado em Ciências de Engenharia Química e Bioquímica
Nucleosides Separation by
Reversed-Phase, Single-column Chromatography
with Recycle Lag
Dissertação para obtenção do Grau de Mestre em
Engenharia Química e Bioquímica
Orientador: José Paulo Mota, Prof. Catedrático,
FCT-UNL
Co-orientador: Abimaelle Chibério, Doutoranda,
FCT-UNL
Júri:
Presidente: Prof. Doutor Mário Fernando José Eusébio Arguente: Doutor Ricardo Jorge Sousa da Silva
Vogal: Prof. Doutor José Paulo Barbosa Mota
Nucleosides Separation by Reversed-Phase, Single-column Chromatography with Recycle Lag
Copyright © Gonçalo Filipe Marques Policarpo, Faculdade de Ciências e Tecnologia, Universi-dade Nova de Lisboa.
A Faculdade de Ciências e Tecnologia e a Universidade Nova de Lisboa têm o direito, perpétuo e sem limites geográficos, de arquivar e publicar esta dissertação através de exemplares impres-sos reproduzidos em papel ou de forma digital, ou por qualquer outro meio conhecido ou que venha a ser inventado, e de a divulgar através de repositórios científicos e de admitir a sua cópia e distribuição com objetivos educacionais ou de investigação, não comerciais, desde que seja dado crédito ao autor e editor.
i
Agradecimentos
Desde que entrei na faculdade, e mesmo antes disso, tive sempre pessoas que me apoiaram, que estiveram sempre presentes e que deram significado ao meu percurso e sempre darão. E, é nesta página, que agradeço a todas estas pessoas.
Ao meu Avô Vovôzito: estiveste sempre presente comigo, sempre a apoiar, a puxar por mim, a fazer de tudo para que nunca faltasse nada, sempre a mimar e sempre com o sorriso que mais adoro neste mundo. Infelizmente, a Vovózita não está presente fisicamente, mas está sempre presente ao pé de nós pois, onde nós estamos, ela também estará. Daí que, agradeço muito o vosso apoio e por serem os melhores avós que algum neto poderia ter. Amo-vos Vozito e Vozita!
À minha Mãe: só Deus sabe o que sofreste na tua vida, mas sempre demonstraste garra e afinco para ultrapassar qualquer obstáculo, e isso é das coisas que mais admiro em ti. Podemos ter as nossas discussões, os nossos desen-tendimentos; mas eu sei que poderei contar sempre contigo venha o que vier. Só quero que sejas feliz, com tudo de bom, e ao lado de quem tu queiras. Agradeço-te todo o apoio, principalmente, nestes últimos 5 anos do meu percurso académico. Amo-te Mãe!
Ao meu Irmão: tens o teu feitio, tens o teu orgulho imensurável, e tens a tua doença incurável do Benfica. Mas, nem tudo é mau. Sempre ajudaste quando podias, nunca fizeste as coisas a meio gás e nunca ninguém te vai conseguir tirar a tua garra de vencer. Ao ver-te assim sempre, só me deu vontade para avançar e conseguir as coisas com a mesma garra que tu. Por isso, por seres um grande irmão e uma grande inspiração, agradeço-te por tudo. Amo-te André! (NO HOMO!) E para a Teresa, muito obrigado por fazeres o meu irmão feliz e por teres aparecido na nossa família, minha cunhada!
À minha tia Sandra: sempre me motivaste para nunca parar, para dar o tudo para atingir os meus objetivos e para conseguir tudo aquilo que queira. Sempre me mostraste o divertido de estudar, e me guiaste para uma das melhores decisões que já tomei. Com isso tudo, cheguei onde cheguei, e tu és uma das principais razões para ter conseguido chegar até aqui. Agradeço-te muito por tudo! Amo-te, Titi!
Para o Prof. Mota: muito obrigado por me ter ajudado nestes 5 anos de mestrado, por ter me guiado no curso e por me ajudar no meu futuro profissional. Muito obrigado por ser um grande Professor! Gostaria de agradecer à coorien-tadora Abimaelle Chibério e ao Tiago Santos, por toda a ajuda que me deram na dissertação. Adicionalmente, gostaria de agradecer ao project4319 - NESSIE - New Structured Substrates for Downstream Processing of Complex Biopharma-ceuticals.
Para a minha Família de Praxe: os meus padrinhos, José Malta e Clarinda Costa, por me terem guiado quando entrei, obrigado! Adoro-vos, padrinhos! Às minhas afilhadas, Catarina Ferreira, Sofia Jin e Zahara Eltayari, obrigado por me terem escolhido como vosso padrinho e por terem me sempre animado sempre que vos via: obrigado! Adoro-vos, Afilhadas! E à minha Neta, Sofia Pereira, por ter entrado na família e por ter sido uma grande companhia várias vezes, obrigado! Adoro-te Neta!
Às minhas Maninhas: Obrigado por me terem sempre apoiado, por me terem ajudado em tudo o que podiam e por terem estado lá para mim, independentemente do que fosse. Cheila Tavares, Daniela Dias e Liliana Cajada, muito obrigado por tudo! Adoro-vos maninhas!
Aos meus Amigos: Obrigado por me terem sempre ajudado, por me terem animado e, principalmente, por me terem aturado quando dizia as piadas mais negras possíveis: João Furry, João Gonçalves, Garcia, Zé Pinto, Sofia Pádua, Cátia Felizardo, Henriquinho, Bea e Óscar, Regina, Batatinha, André Shura, e o maior bastardo e melhor companhia do Curso, João “H” Antunes. Adoro-vos!
E, por fim, ao meu Amor: tu apareceste durante o primeiro ano de faculdade, sabe-se lá donde! Como é que me consegues aturar há mais de 4 anos e 7 meses? É o amor, e eu agradeço todos os dias a todos os santinhos, pela sorte que tive ao te encontrar e te ter na minha vida. Todos os momentos felizes, tristes, a rir, a chorar, até mesmo a discutir, não trocava por nada deste mundo. E, para surpreender mais o Rui Unas, ainda a darmos as mãos passado tanto tempo. Tu és das melhores coisas que apareceu na minha vida e vais me trazer coisas igualmente boas e importantes. Estarei contigo até ao fim! És quem eu penso quando acordo e és a última que penso quando vou dormir. Amo-te muito, meu Amor!
iii
“From there to here, from here to there, funny things are everywhere.” —
Dr. Seuss
v
Abstract
The purpose of this project is to experimentally validate a newly developed chromato-graphic platform for (bio)purification based on a novel single-column device that mimics the op-eration of multicolumn chromatography through ingenious management and recycling of mixed fractions. The newly developed platform shares the benefits of simulated-moving-bed (SMB) chromatography in that it not only gives significantly higher yields of purer product, but also ena-bles processing more feed and thereby increasing the overall throughput. However, the proposed process uses a single chromatographic column.
The process is based on the realization that the periodic state of an SMB process can be mimicked by a single-column chromatographic process with a recycle lag of (N−1)τ time units, where N is the number of columns of the equivalent SMB unit and τ is the switching interval (time interval between consecutive switches of the inlet and outlet ports). The recycle lag is imple-mented in practice by means of a special type of plug-flow tube (recycle piston) that includes a moving piston to compensate for the difference between inlet and outlet flow rates. The proper operation of inlets and outlets of such device implements an approximate “first in, first out” method of organizing and manipulating the fractions of fluid collected from the chromatography column, where the oldest (first) amount fluid, or “head” of the fraction, is the first to exit the plug-flow tube. Using the separation of nucleoside mixtures by reversed-phase chromatography as a case study, it is demonstrated that the single-column chromatographic process can mimic the opera-tion of recent multicolumn capture and polish processes designed for the efficient separaopera-tion and purification of biomolecules.
vii
Resumo
O objetivo deste projeto é validar experimentalmente uma plataforma cromatográfica re-cém desenvolvida para (bio)purificação baseada num novo dispositivo de coluna única que imita a operação de cromatografia multi-coluna, através de uma gestão engenhosa e reciclagem de frações mistas. A plataforma recentemente desenvolvida compartilha dos benefícios da croma-tografia de Leito Móvel Simulado (LMS) que não só dá rendimentos significativamente mais ele-vados do produto mais puro, mas igualmente permite o processamento de mais alimentação e aumentando, desse modo, a taxa de transferência total. No entanto, o processo proposto utiliza uma coluna de cromatografia única.
O processo baseia-se na perceção de que o estado periódico de um processo LMS pode ser imitado por um processo de cromatografia de coluna única com um intervalo de reciclagem de (N−1)τ unidades de tempo, onde N é o número de colunas da unidade LMS equivalente e τ é o intervalo de troca (intervalo de tempo entre trocas consecutivas das portas de entrada e saída). O atraso de reciclo é implementado na prática por meio de um tipo especial de tubo com escoa-mento pistão (pistão de reciclo) que inclui um pistão em moviescoa-mento um pistão em moviescoa-mento para compensar a diferença entre as taxas de vazão de entrada e saída. O funcionamento apro-priado das entradas e das saídas do tal dispositivo implementa um método aproximado "primeiro a entrar, primeiro a sair" de organizar e de manipular as frações do líquido coletados da coluna de cromatográfica, onde o líquido mais velho (primeiro a entrar) da quantidade, ou a "cabeça" da fração, é o primeiro a sair do pistão de refluxo.
Usando a separação de misturas de nucleósidos por cromatografia de fase inversa como um estudo de caso, é esperado para mostrar que o processo de cromatografia de coluna única pode imitar a operação de recentes processos de captura e polimento em multi-coluna projetados para a separação eficiente e purificação de biomoléculas.
ix
Contents
1-
THEORETICAL INTRODUCTION ... 15
1.1
P
HARMACEUTICALI
NDUSTRY HISTORY,
M
ONOCLONALA
NTIBODIES,
VLP
S15
1.2
C
HROMATOGRAPHY ANDS
IMULATEDM
OVINGB
ED(SMB)
P
ROCESS... 17
1.3
I
MPLEMENTATION OF THES
INGLE-C
OLUMNS
YSTEM... 20
2-
MATERIALS, INSTRUMENTS AND SETUP ... 23
2.1
I
NSTRUMENTS ANDS
ETUP... 23
2.2
R
ECYCLEL
AGD
EVICE... 27
2.3
S
OLUTIONS... 29
3-
PROTOCOLS AND METHODS ... 31
3.1
D
EADV
OLUME ANDH
YDRODYNAMIC... 31
3.2
N
UCLEOSIDESO
NE-C
OLUMNR
ECYCLEP
ISTONE
XPERIMENTS... 32
3.3
P
ARAMETERS VALUES... 32
4-
RESULTS AND DISCUSSION ... 35
4.1
D
EADV
OLUME ANDH
YDRODYNAMICR
ESULTS ANDD
ISCUSSION... 35
4.2
N
UCLEOSIDES1-C
OLUMNR
ECYCLEP
ISTONR
ESULTS... 36
5-
CONCLUSIONS ... 41
6-
BIBLIOGRAPHY ... 43
7-
ANNEXES ... 45
7.1
A
NNEX1
-
R
ECYCLEP
ISTONM
ODELE
QUATIONS... 45
7.2
A
NNEX2
-
P
ERFECTLYM
IXEDT
ANKM
ODELE
QUATIONS... 48
7.3
A
NNEX3
-
D
EADV
OLUMESM
ODELE
QUATIONS... 48
7.4
A
NNEX4
-
C
HROMATOGRAPHICC
OLUMNM
ODELE
QUATIONS... 49
7.5
A
NNEX5
-
H
YDRODYNAMICE
XPERIMENTSJ
ULIAC
OMMANDS... 49
xi
List of Figures
FIGURE 1-PRICIPLE OF ELUTION IN CHROMATOGRAPHY. ... 18
FIGURE 2-DIAGRAM OF A TYPICAL TMB PROCESS. ... 18
FIGURE 3-DIAGRAM OF A TYPICAL 4-ZONE SMB PROCESS, WITH 12 COLUMNS. ... 19
FIGURE 4-TWO-COLUMN SMBCHROMATOGRAPHY SCHEMATIC, WHERE: ... 20
FIGURE 5-SEQUENTIAL STEPS FOR THE SECOND COLUMN, WITH THE ADJUSTMENTS FOR THE RECYCLE PISTON’S (RP) IMPLEMENTATION. ... 21
FIGURE 6-FULL CYCLE SEQUENCE FOR THE ONE-COLUMN ANALOG SMBCHROMATOGRAPHY SYSTEM ... 21
FIGURE 7-ONE-COLUMN ANALOG SMB SETUP. ... 24
FIGURE 8-KNAUER™V5010S100SMARTLINE PUMP... 25
FIGURE 9-KNAUER™HPLCK501 PUMP ... 25
FIGURE 10-SUPERFORMANCE 26 MM I.D. THERMOJACKETED GLASS CHROMATOGRAPHIC COLUMN ... 25
FIGURE 11-OCEAN OPTICS USB2000 MULTI-WAVELENGTH UV DETECTOR ... 26
FIGURE 12-TWO-WAY (ON/OFF) PNEUMATIC VALVE ... 26
FIGURE 13-ELECTRICALLY-ACTUATED,2 POSITION 6-PORT/3-CHANNEL-INJECTION VALVE ... 27
FIGURE 14-SARTORIUS™SCALE ... 27
FIGURE 15-RECYCLE LAG PISTON-STYLE DEVICE ... 28
FIGURE 16-MAIN PISTON OPERATING CONFIGURATIONS. ... 28
FIGURE 17-GUANOSINE MOLECULE ... 29
FIGURE 18-URIDINE MOLECULE ... 30
FIGURE 19-HYDRODYNAMIC BEHAVIOUR INSIDE STATIC PISTON FOR PISTON HEIGHTS OF 0MM (BLACK), 5MM (BLUE),10MM (GRAY) AND 25MM (RED) ... 35
FIGURE 20-EXPERIMENTAL CONCENTRATION PROFILES FOR NUCLEOSIDES SEPARATION (BLACK, GUANOSINE; RED, URIDINE): GUANOSINE IS RECOVERED IN THE GRAY ZONE (STEP 2 OF EACH CYCLE), URIDINE IS RECOVERED IN THE LIGHT-PINK ZONE (STEPS 3 AND 4 OF EACH CYCLE) ... 37
FIGURE 21-SOLUTE CONCENTRATION PROFILES.TOP GRAPHIC:URIDINE;BOTTOM GRAPHIC: GUANOSINE;THE EXPERIMENTAL DATA IS REPRESENTED IN DOTS, THE DISPERSED PLUG-FLOW IS REPRESENTED IN BLUE, THE PERFECT MIXED TANK IS REPRESENTED IN BLACK. ... 38
xii
FIGURE 22-PURITY VALUES FOR EACH CYCLE.BLACK -GUANOSINE;RED -URIDINE ... 3813
List of Tables
TABLE 1-TYPES OF CHROMATOGRAPHY, ACCORDING TO STATIONARY PHASE... 17
TABLE 2-FULL ONE-COLUMN ANALOG SMBCHROMATOGRAPHIC SEQUENCE: ... 22
TABLE 3-COLUMN PARAMETERS ... 32
TABLE 4-PARAMETER VALUES OF THE CYCLE FOR THE SEPARATION OF NUCLEOSIDES USING ONE-COLUMN
15
1-
Theoretical Introduction
1.1 Pharmaceutical Industry history, Monoclonal Antibodies,
VLPs
According to Encyclopaedia Britannica, the Pharmaceutical Industry is the industry that focuses on the discovery, development and manufacture of drugs and pharmaceutical products by public and private organizations [1]. Although this practice has been around since the early civilizations, with med-icines made from plants, animals and/or minerals, the industry had a great improvement in the 16th and
17th centuries, with the creation of pharmacopoeia [1].
With these improvements, in the 18th century, compounds necessary for pharmaceutical products
have been isolated to produce more viable and valuable drugs. In the 20th century, with the advances
in technological knowledge and methods, the pharmaceutical products could be produced using chem-ical and biochemchem-ical compounds, causing essentially a rapid decline in the number of deaths with the development of vaccines and antibiotics [1]. In the late 20th century, biochemical pharmaceutical
prod-ucts started increasing in quantity, with the advances in the biochemical understanding, biochemical and genetics.
Focusing on the biotechnological pharmaceutical products, the production of these products can be divided into two parts:
• Upstream Processing (USP) – initial stage of a bioprocess, in which the biomass is grown to produce the biomolecules of interest. Includes the steps of: media preparation, cell culture development, production, and subsequent, harvest of the result of the biore-actor [2], [3];
• Downstream Processing (DSP) – final stage of a bioprocess, where the cell mass frim the upstream is processed to meet purity and quality requirements, by isolation and pu-rification of the biotechnological product of interest [4], [5].
16
In a biotechnological production there are several costs that can be distributed between USP and DSP; however, the costs and the optimizations are not equal. The USP had many optimizations in the past years, having production of cubic meters of biological broth, with high quantity of valuable phar-maceutical compounds. On the other hand, with the DSP, although recent optimizations have been discovered, the costs are considerably higher when compared to the upstream and the yield is far from being a great success; for a typical downstream process, the protein retrieval yield is very low, resulting in high quantity of product losses, leading to a less profitable bioprocess. Considering these facts, for DSP more optimizations are necessary to reach more efficient results and lower losses in product, to reduce the prices of biopharmaceutical products [6], [7].The DSP can be divided in 5 different stages, from the harvest of the biotechnological product to the final stage to be used as a biopharmaceutical product [6], [7], [8]:
1. Harvest – the insoluble components are separated from the soluble components, sepa-rating the cells and cell debris from the media. The typical operations of this phase are: centrifugation, filtration, sedimentation, flocculation, gravity settling;
2. Concentration – the components of interest are concentrated, by removing components whose presence vary the considerably the properties of the desired product, water being a great percentage of the impurities. The typical operations of this phase are: filtration, precipitation and adsorption;
3. Purification – the components of interest are separated from contaminants, which have resemblances in physical and chemical properties. The typical operation of this phase is: chromatography;
4. Formulation – the product is stabilized, and its activity is maintained for future storage. In this stage, the product can be sterilized, and its trace contaminants ought to be deac-tivated or removed. The typical operations of this phase are: crystallization and lyophi-lization;
5. Filling – the product is stored for later testing or usage.
With the advances of biopharmaceuticals, more complex biomolecules were produced and puri-fied using DSP. Several innovative vaccines and gene therapies were created using more complex biomolecules. Some of those new complex biomolecules are: Monoclonal Antibodies (MABs), Virus-Like Particles (VLPs) and Retroviruses:
• MABs are antibodies that are identical to immunoglobulins, that are generated from a single B-cell clone. These antibodies recognize binding sites, or epitopes, on a single antigen. The importance of these antibodies is the derivation from a single B-cell clones and the targeting of a single binding site, that can be used to detect or purify a substance [9];
• VLPs are products of the expression of viral structural proteins, such as the envelope or capsid proteins without any of the viral genetic material that’s dangerous on the vi-ruses that they mimic. As they mimic the outer layers of vivi-ruses, VLPs can be used in vaccines to protect from diseases like influenza and hepatitis B [10].
• Retroviruses are a type of virus enveloped with RNA, remarkable for their usage of reverse transcription of viral RNA into linear double stranded DNA. Through viral gene expression, restriction factors to infections and immune response to retroviral infection, retroviruses can be used as gene delivery devices and antiretroviral therapies [11].
17
Considering the stages of the Downstream Processing, the stage that’s going to be the focus of this thesis is the fourth stage, with the usage of Chromatographic processes. In the following sub-chapter, the chromatographic process is explained and the SMB technology that’s used.1.2 Chromatography and Simulated Moving Bed (SMB) Process
Chromatography is a separation and analytical technique initially developed by chemists with the goal of extraction and purification of mixtures of plant origin. Chromatography is a separation method in which a mixture of solutes is eluted through a stationary phase (usually a solid inside a column), with each compound interacting with the stationary phase. The affinity that each solute has to the stationary phase will determine their migration speeds, enabling the collection of the separated compounds based on how strongly they interact with the stationary phase. A strong affinity towards this phase will lead towards slower migration speeds of compounds, while compounds with lower affinities elute more quickly. There are several types of chromatographic processes, depending on the type of stationary phase, which some are explicit in Table 1:Table 1 - Types of Chromatography, according to Stationary Phase Type of Chromatography Specification
Affinity The stationary phase uses specific ligands that link with the compound with most affinity
Ion-Exchange The stationary phase uses electrically charged ligands for linkage Size Exclusion The stationary phase is loaded with a gel with pores of different
diame-ters, separating based on the size of the compound Reverse Phase[12] The stationary phase is less polar than the mobile phase Hydrophobic Interaction[13] The stationary phase is loaded with hydrophobic ligands
A chromatographic process can be characterized based on the number of columns used: • Batch chromatography (BC) – characterized by the use of a single, where the feeding
of the mixture and the elution is performed non-continuously in the same column [14]; • Continuous chromatography (CC) – the column is split into a given number of smaller
columns that operate in series with switching of the inlet/outlet ports in the direction of fluid flow over a larger number of cycles [14].
By allowing the process to be operated simultaneously on many columns (wash, elution and regeneration), the CC is more efficient in terms of resin and solvent usage [14].
18
Figure 1 - Priciple of Elution in Chromatography.To improve the process, the True Moving Bed (TMB) process was developed, employing unique operating principles and conferring several valuable benefits to the chromatographic separation pro-cess. The process changes how the solid phase operates, no longer being immovable, it starts to have a continuous movement, countercurrent to the flow of the fluid and with an intermediate velocity in relation to the migration speed of the two solutes to be separated, as the compound that interacts most strongly with the phase (named the extract) will then be dragged by the solid and the other (named the raffinate) continues to migrate with the fluid but at a lower speed. With this, it is possible to collect each pure compound in each end of the column, allowing for the continuous feed of mixture to be separated [15].
Figure 2 - Diagram of a typical TMB process.
However, the TMB process has been difficult to implement as it relies on a continuous flow of eluent in one direction being recycled back into the column filled with a chromatographic medium and a continuous flow of said medium circulating in countercurrent to the eluent and also being recycled, resulting in problems (such as friction of particles in the bed) and not being economically viable.
To overcome some of the True Moving Bed process’ shortcomings, Universal Oil Products de-veloped the Simulated Moving Bed (SMB) process in 1961. Essentially being the discretization of the
19
TMB in several columns (the higher the number of columns, the closer SMB process becomes to TMB process), simulating the opposing currents by periodically shifting the inlets/outlets ports in the direction of the fluid flow [16].Figure 3 - Diagram of a typical 4-zone SMB process, with 12 columns.
In its conventional operating mode, at regular time intervals, the designated injection and with-drawal ports all move one column ahead in the direction of the fluid flow. When the initial injection/col-lection port of all the streams is reached, we have completed one cycle. In this way, during one cycle the same column is being used towards different roles in the separation process.
With this and the interest of adapting this process to other industries and applications, the Simu-lated Moving Bed technology was advanced upon and scaled down, with more versatile configurations with simpler configurations: having reduced the number of chromatographic columns; creating an alter-native to the use of the initial process arrangement where several columns with large dimensions were employed[17], [18][19].
Several different configurations have been applied to the SMB chromatographic process, with their respective advantages and disadvantages. From the configurations point of view and for compar-ation purposes, the types of SMB configurcompar-ations are [20]:
• Classical SMB: with four columns and four sections; • Three-zone SMB: with three columns and three sections; • Two-column SMB: with two columns and two pumps;
• One-column SMB: with one column, one recycle piston and two pumps; this is the con-figuration under study in this thesis.
The classical SMB can be described with four chromatographic zones operated in countercur-rent, sequentially linked and in closed loop. Each zone has a specified function in the separation of two
20
solutes. Considering a binary mixture, A/B (A has higher affinity than B to the stationary phase), the mixture is fed between sections II and III, where the separation of A and B occurs. The solute A is dragged by the stationary phase and recovered between sections I and II: the solute B flows with the fluid current and is recovered between sections III and IV. At the entrance of section I, it’s fed pure solvent to regenerate the adsorbent before being recirculated to section IV, where the regeneration of solvent occurs[21].The three-zone SMB removes section IV, that functions as enrichment of raffinate and recircula-tion of solvent, not affecting the extract. Hence, the three-zone configurarecircula-tion avoids any extract con-tamination due to the recirculation of solvent. It has advantages when compared to the classical SMB: less total number of chromatographic columns, less number of valves, less pumps, less residence time of solutes and it’s a simpler and easier to control system[21].
The two-zone SMB only uses two chromatographic columns for the separation of a binary mix-ture. This configuration has the advantages of having a higher productivity and using less chromato-graphic columns when compared to the classical SMB; however, one of its advantages is the lower amount of adsorbent used when compared to the amount required by the classical four-zone SMB[20]. This thesis will reproduce experiments regarding a One-Column SMB process[22], with its con-figuration specified in the materials section. The mathematical models that describe the system are present in Annex 1.
1.3 Implementation of the Single-Column System
For the implementation of the one-column analog SMB chromatography system, the two-column chromatography system for nucleoside separation[18], that is valid, was used as case study for the validation of the system that’s being implemented. Using the two-column SMB schematic, shown in Figure 4, the transition to the one-column analog SMB schematic can be made, while maintaining the validity of the system.
Figure 4 - Two-Column SMB Chromatography Schematic, where: E is Eluent, F is Feed and P is Product
21
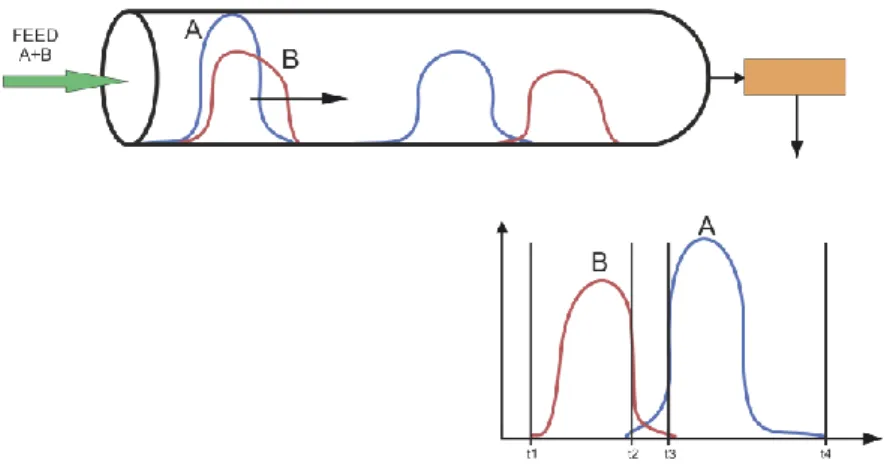
Starting with Figure 4, one column of the two-column SMB schematic is chosen at random. In this case, the second column (the column of the right, for each interval) was chosen as the model. It is to be considered that the effluents/outputs of the chosen column to the other column are to be sent to the recycle piston (RP), being a one-column analog SMB system, to mimic the two-column SMB system.Figure 5 shows the sequential steps for the chosen chromatographic column of the two-column SMB system, with the adjustments for the recycle piston’s implementation. The next step of the transi-tion to the one-column analog SMB chromatographic system is to eliminate the steps where the column is inactive (t2 of the second switching interval) and to merge the steps that are repetitive and sequential to each other (t1 and t3 of the second switching interval).
Figure 6 - Full Cycle Sequence for the One-Column Analog SMB Chromatography system Figure 5 - Sequential steps for the second column, with the
22
The result of the elimination and the merging of the steps is shown in Figure 6, which comprises the full cycle for the one-column analog SMB Chromatography. This transition, from two-columns to one-column, maintains its validity only if the sequence maintains the same, regardless of the initial step. The final step for the implementation of the desired system is the implementation of the initializa-tion of the cycle. Considering that the chromatographic column is clean in the beginning of the process, some steps don’t change the beginning of the process.Starting with the fourth step, the clean eluent passes through the already clean chromatographic column (COL) into the recycle piston (R), that is initially closed and without any solution. The input of clean eluent (E) does not change the concentration inside of the column and its following step (first step of Figure 6) is repeating the previous step, with the difference of closing the recycle piston device. Hence, steps four and one are not good valid initialization steps, since these do not change the solution inside the already clean column.
With the second step of Figure 6, the feed (F) passes through the clean chromatographic into the product (P) or waste (W), changing its concentration profile, being a valid first step for the initialization cycle. The following step (third step of Figure 6) if the recycle piston was open, it would be filled with clean eluent. So, instead of using the recycle piston, it can suffer a slight change for the initialization cycle, that change being the clean eluent from the eluent pump. After this initialization cycle, the se-quence of Figure 6 is repeated for the n number of cycles necessary for the process, as shown in Table 2.
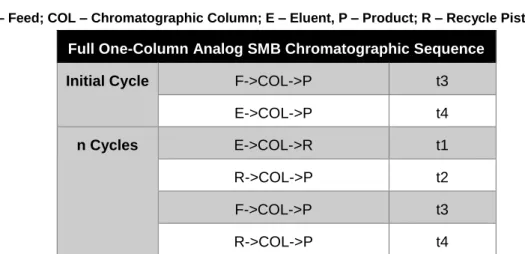
Table 2 - Full One-Column Analog SMB Chromatographic Sequence:
F – Feed; COL – Chromatographic Column; E – Eluent, P – Product; R – Recycle Piston
Full One-Column Analog SMB Chromatographic Sequence
Initial Cycle F->COL->P t3
E->COL->P t4
n Cycles E->COL->R t1
R->COL->P t2 F->COL->P t3 R->COL->P t4
As shown in Table 2, the full sequence for the process is comprised of the initial cycle and the following n repeating cycles. Each step has its respective duration, that doesn’t change for the entire process. However, the parameter values are calculated on sub-chapter 3.3.
The following chapter will show the equipment used for the implementation of the One-Column Analog SMB Chromatographic process, with the explanation of the novel recycle lag device used.
23
2-
Materials, Instruments and Setup
2.1 Instruments and Setup
To reproduce the experiments for a one-column analog SMB, a setup was built and used, as shown in the following figure (Fig. 7). The setup is comprised of:
• Three Knauer™ (Berlin, Germany) pumps: one V5010 S100 Smartline pump (pump F) (Fig.8) for injecting fresh feed into the chromatographic column, one HPLC K501 pump (pump E) (Fig. 9) for injecting fresh eluent and a gradient pump K501 if necessary to introduce solvent gradients into the system, all with 10mL pump heads;
• One multi-wavelength UV detector (USB2000 from Ocean Optics, USA) immediately af-ter the chromatographic column, connected with a DH-2000-S-DUV light source (Micro-pack, Ostfildern, Germany), which has Deuterium and Halogen lamps, to ensure a broad range of absorbance reading versus wavelength at the absorbance spectrum (Fig. 11); • Seven two-way (i.e., on/off) valves (Fig. 12) and three electrically-actuated, 2 position 6-port/3-channel-injection valves (Fig. 13) from Valco International™ (Schenkon, Switzer-land);
• One Sartorius™ TE1302S scale for mass flow calculations (Fig. 14);
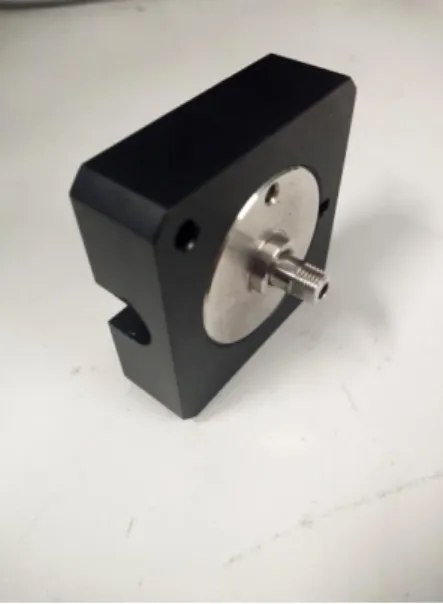
• One recycle piston device (Fig. 15): a column with two inlet and a movable piston, with two frits with a porosity of 20um and 25mm ID, produced by YMC Europe GmbH (Dinslaken, Germany);
• One Superformance 26 mm i.d. thermojacketed glass chromatographic column, with a reverse-phase stationary phase (Labortechnik, Germany) (Fig. 10).
The setup was controlled and automated using the setup described in the thesis: SIMULATED MOVING BED TECHNOLOGY Principles, Design and Process Applications[23].
Using these instruments and with the help of the control software and equipment, several config-urations were implemented to create the different paths for the flow through the chromatographic col-umn:
24
• E => COL => R: the eluent is pumped through pump E into the chromatographic columnthat will lead to the recycle piston forcing the piston to lower;
• E => COL => P/W: the eluent is pumped through pump E into the chromatographic col-umn that will lead to either waste (W) or product (P), that will lead to the scale;
• F => COL => P/W: the feed is pumped through pump F into the chromatographic column that will lead to either waste (W) or product (P), that will lead to the scale;
• F => COL => R: the feed is pumped through pump F into the chromatographic column that will lead to the recycle piston forcing the piston to lower;
• R => COL => P/W: the eluent is pumped to the lower section of the recycle piston, forcing the piston to rise and injecting the fluid inside into the chromatographic column that will lead to either waste (W) or product (P), that will lead to the scale.
With these configurations: fresh feed, fresh solvent, and fresh gradient can be injected while storing the outlet fractions of the chromatographic column into the recycle piston; these fresh liquids can be injected while producing one or more product fractions or waste fractions, or admixing feed, solvent or gradient with one or more fractions from the recycle piston[24].
25
Figure 9 - Knauer™ HPLC K501 pumpFigure 10 - Superformance 26 mm i.d. thermojacketed glass chromatographic column Figure 8 - Knauer™ V5010 S100 Smartline pump
26
Figure 11 - Ocean Optics USB2000 multi-wavelength UV detector27
Figure 13 - Electrically-actuated, 2 position 6-port/3-channel-injection valveFigure 14 - Sartorius™ Scale
2.2 Recycle Lag Device
This novel device (Fig. 15) for the setup consists of a column with a fluid distribution system at the top, a closed end at the bottom with 2 inlets/outlets, and a movable piston with a fluid collector at the top surface. The fluid collector is connected to the closed end of the device by a flexible tube. Two frits with a porosity of 20um and 25mm ID, produced by YMC Europe GmbH (Dinslaken, Germany) are coupled at the top surface and upside of the movable piston, respectively to ensure that there is no radial distribution of the fluid concentration and to avoid possible preferred paths. This piston-type de-vice implements an approximate “first in, first out” method: the first fraction that enters the recycle lag device (first in) is the first fraction to exit the recycle lag device (first out); similar to a plug-flow behaviour.
28
As shown in Fig. 16, the device has two main settings: the left one, fluid injected into the top of the device is stored in section A by forcing the piston to move down and the excess fluid in section B is redirected to the tank from where it was first pumped. The pump that injects fluid into section B is typically an eluent pump, that is used to inject eluent into other parts of the process; the right one, the fluid injected into section B by the pump forces the piston to move up and the excess fluid in section A is redirected via the collector and flexible tube to the inlet of the column, thus implementing the “first in, first out” method. This mechanism is required to implement the “first in, first out” behaviour, a common beaker or a normal harvesting recipient can’t be used; since these have a behaviour similar to a per-fectly stirred tank.Figure 15 - Recycle Lag Piston-style Device
29
2.3 Solutions
To validate the experiments for the One-Column Analog SMB Chromatographic system, two nu-cleosides were used, Guanosine(C10H13N5O5) and Uridine (C9H12N2O6), for the separation process, the
same ones used in the case study[18]. These solutes have a linear isotherm behavior, so the experi-ments don’t have to use both solutes at the same time and can analyze the separation of each nucleo-side by the comparison of their respective graphs.
The Uridine (99%) and Guanosine (98%) were purchased from Sigma-Aldrich™ (Steinheim, Ger-many), and HPLC-grade ethanol from Panreac™ (Spain). The solvents were prepared:
• Eluent: 5% v/v ethanol solution in distilled water; • Guanosine (Feed): 0.05 g/L in 5% v/v ethanol solution; • Uridine (Feed): 0.05 g/L in 5% v/v ethanol solution. For the preparation of the eluent solution, with a volume of 2 liters:
1. 100 mL of ethanol (99.9%) was measured in a graduated test tube; 2. 1.9 liters of distilled water was measured in a graduated test tube; 3. Both liquids were mixed in a 2-liter volumetric flask;
4. After mixing, the volumetric flask was subjected to an ultrasound bath for the removal of bubbles, for three minutes;
5. After the ultrasound, the eluent solution was ready for usage.
For the preparation of the feed solution (either Guanosine or Uridine), with a volume of 1 liter: 1. 0.05 grams of solute was measured on a scale, in a beaker;
2. 1 liter of the 5% v/v ethanol solution in distilled water was measured in a graduated tube; 3. The solute was mixed with small amounts of the ethanol solution and added to a 1-liter
volumetric flask, until it was completely mixed and filled;
6. After mixing, the volumetric flask was subjected to an ultrasound bath for the removal of bubbles, for three minutes;
4. After the ultrasound, the feeding solution was ready for usage.
30
Figure 18 - Uridine molecule31
3-
Protocols and Methods
Throughout the experiments performed for this thesis, the solutions used are described in subtitle 2.3 – Solutions, at an absorbance of 260nm, using only the Deuterium lamp on and with integration time = 15000ms. Before each experiment, the recycle piston and the chromatographic column were cleaned, the pumps were calibrated, the bubbles were removed from the vessels containing the solu-tions, the UV was setup to reference, the scale was monitored, and the valves were set to flow through either inside the column or through the bypass.
3.1 Dead Volume and Hydrodynamic
The recycle device was projected to maintain a plug-flow behavior inside; however, after some experiments, it was confirmed that its behavior is a behavior in the middle of both plug-flow and perfectly stirred tank. The objective of this protocol was to calculate the dead volume of the system, after injection of uridine through the system until it was detected by the UV detector, bypassing the chromatographic column, with the UV detector after the closed recycle piston and with a flow of 2mL/min.
Hence, the following experiments were done: Bypass to the chromatographic column; capillary tube replacing the piston; closed piston, 5mm height, 15mm height and 25mm height piston. After the successful experiments, in triplicate, the calculations done were:
• Relative standard deviation (σ);
• Equal Area Method (EAM) for each curve, with the calculation of average of all the curves.
The relative standard deviation was used for the validation of the process. If its variation was approximately 5%, then the experiment can be considered valid. The EAM is the method used to cal-culate at which time, in the concentration graph, the area is equal in both left and right sides of the graph, but just the initial part of the saturation. The final equation that permitted the calculation of the dead volume of the system is:
𝐸𝐴𝑀𝐴𝑣𝑒𝑟𝑎𝑔𝑒(𝑠) ∗
𝐹𝑙𝑜𝑤(𝑚𝑖𝑛𝑚𝐿) 60
32
The Julia sequence can be found in Annex 5.3.2 Nucleosides One-Column Recycle Piston Experiments
The objective of these experiments is to determine the concentration profile for the binary sepa-ration uridine-guanosine, using the 1-column analog SMB configusepa-ration. As proof of concept, a 2 chro-matographic column process[20], being the system used comprised on one chrochro-matographic column plus one recycle piston. For the experiments of Uridine and Guanosine, the feed and eluent flows were of 4mL/min; in cycles of 18 and 14 times, respectively. The experimental results were compared with gPROMS™ simulations of the same system, developed with parameters determined experimentally.
The Julia sequence for this experiment “ColExps.jl” is described in Annex 6.
3.3 Parameters values
To execute the experiments, it’s needed the full sequence for the experiment and the optimized times for each step of the sequence. In sub-chapter 1.3, the full sequence was described in Table 2; so, only the times are to be determined for the experiment to be ready to execute. For the determination of the parameter values, the volumetric flows of the pumps were fixed at a constant flow rate of 4 mL/min.
Using the column parameters, presented in Table 3, determined experimentally:
• The Henry constants by the analysis of the injection of diluted pulses of solute into the column, being repeated at different elution constants to determine the linearized van Deemter curve;
• The interparticle porosity by the analysis of blue dextran injection pulses’ residence time since these don’t penetrate the resin pores; the total porosity by the analysis of acetone injection pulses’ since it accesses all the porous volume of the resin; the intraparticle porosity by the difference between the total volume and the interparticle volume; With the process described in Table 2, the cycle parameters were determined using model-based optimization in AMPL™ software, achieving the ideal times for each step of the cycle, shown in Table 4.
Table 3 - Column Parameters
Parameters Uridine Guanosine Henry Constant (H) 1.34 2.20
Peclet Number (Pe) 1100 1100
Effective Diffusivity (DL) 0.0125 0.0125
Porosity of Column (ε) 0.295
33
Table 4 - Parameter values of the cycle for the separation of nucleosides using One-columnAna-log SMB Chromatographic System
Step, k t (min) 1 – Step E => COL => R 10.1547
2 – Step R => COL => P 6.14589
3 – Step F => COL => P 3.94387
4 – Step E => COL => P 4.00883
Having the configuration of the system, the schedule of the experiments, and the parameter val-ues for each step of the cycle, the experiments were done, reaching the results that will be discussed on Chapter 4.
35
4-
Results and Discussion
4.1 Dead Volume and Hydrodynamic Results and Discussion
After the experiments for the dead volume and the hydrodynamic behaviour of the one-column analog SMB, the following graph (Fig. 19) was plotted:
4
Figure 19 - Hydrodynamic behaviour inside static piston for piston heights of 0mm (black), 5mm (blue), 10mm (gray) and 25mm (red)
36
When analyzing all the profiles, the piston presented similar behavior to a dispersed plug-flow regardless of the condition. Although, for this setup, the desired profile is the plug-flow behavior to achieve the “first in, first out” profile of the recycle piston, this behavior doesn’t differ much from the plug-flow behaviour, being acceptable and valid for the continued experiments.The dead volume was determined with the equation on sub-chapter 3.1:
𝐸𝐴𝑀𝐴𝑣𝑒𝑟𝑎𝑔𝑒(𝑠) ∗
𝐹𝑙𝑜𝑤(𝑚𝑖𝑛𝑚𝐿)
60 = 62.266 𝑥 2
60= 𝟐. 𝟎𝟕𝟓𝒎𝑳
The value obtained was of 2.075 cm3, which represents approximately 6.5% of the
chromato-graphic column volume used in the experiments.
It’s to note that, replacing the frit of the upper side of the recycle device with customizable frits that can change the inlet profile, thus improving the hydrodynamic behavior.
4.2 Nucleosides 1-Column Recycle Piston Results
Both the eluent and feed pumps operated at a constant flow rate, without any change of the flow. To minimize the quantity of each solutions needed for each cycle to perform the experiments, when one solution was being injected into the chromatographic column, the other solution was recirculated to its own container.
Using the materials with the setup disposition in Chapter 2, the cycle sequence determined in sub-chapter 1.3 and the parameters determined in sub-chapter 3.3, the experiments were reproduced in 14 and 18 cycles, for Guanosine and Uridine, respectively. In both solutes, the cyclic steady state was achieved after approximately six cycles, carrying until 14 cycles. For the comparison of both so-lutes, the time data was treated as dimensionless time (α), calculated using the formula in Equation (1), for each unit of the dimensionless time to represent a cycle of the 14 dimensionless cycles executed. For the analysis of the graphs, the interval between each unit of the dimensionless time represents one cycle, which is displayed on the xx axis of the graph; the yy axis represents the standardized concen-tration values, calculated using C/CMax (current concentration at a specific dimensionless time, divided
by the maximum concentration measured throughout the experiment), having the highest value of one. The concentration profiles obtained from the experiments, measured with the UV detector installed at the exit of the chromatographic column, with the dimensionless times calculated, are shown in Figure 20.
𝛼 = 𝑛 +
𝑡 + 𝑡
𝑖,𝑛∑ 𝑡
𝑘 𝑘, 𝑛 = 𝑐𝑦𝑐𝑙𝑒 𝑛𝑢𝑚𝑏𝑒𝑟; 𝑡
𝑖,𝑛= 𝑖𝑛𝑖𝑡𝑖𝑎𝑙 𝑡𝑖𝑚𝑒 𝑜𝑓 𝑒𝑎𝑐ℎ 𝑐𝑦𝑐𝑙𝑒 (1)
Starting from cycle 1 (between units 1 and 2, of the dimensionless times), the time intervals of each step for the sequence implemented in the experiment are represented in different colors, for a further analysis of the separation of both nucleosides: step 1 is represented by the white area of the graph; step 2 is represented by the gray area; and steps 3 and 4 are represented by the light red areas. As previously mentioned, since the colors represent the time intervals, it will help with the analysis of which intervals are more suited for the collection of each nucleoside with a higher purity value: for guanosine, the interval where it can be collected with higher purity is step 2, represented by the gray area; for uridine, steps 3 and 4 are the intervals that the nucleoside can be collected with a higher purity. As mentioned in sub-chapter 2.2, since both nucleosides have different linear isotherms, the
37
nucleosides can be separated if each has a different collection step, not needing to be separated as a mixture, being possible the analysis in separate experiments.Additionally, to the laboratory experiments, two distinct simulations were developed, with the gPROMS™ software; both using the same experimental and optimized parameters determined with the AMPL™ software, however one considered the piston as a dispersed plug-flow model and another considered to be a perfectly stirred tank model. In Figure 21, the experimental profiles were compared to the simulated solute composition profiles, using the gPROMS software. The points are the experi-mental data; blue line is piston as dispersed plug-flow; black line is piston as perfect mixed tank. When analyzing the graphs, it was noticed that the initial part of each cycle (when the profile rises), it’s better described as a perfectly stirred tank, while the latter part (when the profile lowers), it’s better described with a dispersed plug-flow behavior.
Therefore, when analyzing the graphs and comparing the experimental data with the simulated data, the behavior is not 100% perfectly stirred tank nor is 100% dispersed plug-flow, instead, it’s an agreement between both, being similar qualitatively and quantitatively, and the behavior of the piston is somewhat intermediate between both types of profiles.
Figure 20 - Experimental Concentration profiles for nucleosides separation (black, guanosine; red, uridine): guanosine is recovered in the gray zone (step 2 of each cycle), uridine is recovered in the light-pink zone (steps 3 and 4 of each cycle)
38
The extract (guanosine) and raffinate (uridine) were recovered at the end of the column. The more retained is the first nucleoside to be collected being, in these experiments, the guanosine, be-cause the less retained goes directed to the piston device during the initial cycle. The products guano-sine and uridine reached me purity values of 99.57% and 97.03%, respectively. The purity values were calculated using the integrals of the graphs for the respective time of retrieval for each nucleoside: the integral of the pure component is divided by the sum of both integrals for each cycle (pure and impure integrals). The purity values for each cycle for each component are shown in Figure 22. In Figure 23, the calculated values for recovery in each cycle for each nucleoside is shown.Figure 21 - Solute concentration profiles. Top graphic: Uridine; Bottom graphic: Guanosine; The experimental data is represented in dots, the dispersed plug-flow is represented in blue, the perfect
mixed tank is represented in black.
0 20 40 60 80 100 1 2 3 4 5 6 7 8 9 10 11 12 13
P
u
rity
(%)
Cycle, n
39
The system achieved, after steady state condition was reached, mean values of recovery of 97.76% for guanosine and 100.00% for uridine.It’s important to point out that, much of the output fluid in step 3, where some uridine can be recovered, is pure eluent. Using the experimental data, it was calculated that at least 10.46 mL of sol-vent can be saved per cycle, resulting in a 25.87% decrease in solsol-vent consumption for each cycle. The most optimal solution would be to redirect the fluid within the time interval where is pure eluent to the solvent tank, where it can be reused.
When compared to the two-column SMB configuration, with closed-loop recycling, an advantage is the number of pumps that the installation needs to operate with solvent recirculation: in this thesis configuration (one-column analog SMB), it only needs two pumps since it operates with recycle lag, unlike the three pumps necessary for the two-column, semi-continuous configuration[20].
0 20 40 60 80 100 1 2 3 4 5 6 7 8 9 10 11 12 13
R
ec
ov
er
y
(%)
Cycle, n
41
5-
Conclusions
This thesis was designed to improve the SMB processing, with a simpler configuration: using a one-column analog SMB setup.
This configuration showed very good results, that can lead to a great improvement when com-pared to the two-column SMB configuration and the classical four-column SMB configuration. Some of these improvements are:
• Cheaper setup, with a reduced number of chromatographic columns and reduced num-ber of necessary pumps;
• Time needed, with the reduced time to perform one cycle and which can recover the extract and the raffinate;
• Eluent consumption, with an eluent reduction of 25.87%;
• A high yield recovery in the system, 97.76% recovery for guanosine and 100% recovery for uridine;
• And, despite not achieving a dispersed plug-flow behavior, the nucleosides were recov-ered with high purity, 99.57% for guanosine and 97.03% for uridine.
Considering these factors, this one-column analog SMB configuration can be used viably and could be used, in the future, as the preferred setup for high yield and cheaper chromatographic process. This process can be better applied for the bio-purification of VLPs, monoclonal antibodies, and so on; having the possibility to be applied instead of the two-column chromatography system.
Although it shows remarkable results, this setup can be further improved, in the recycle device, with the improvement of the hydrodynamic behaviour inside the recycle piston. This setup can be later compared to the batch, 4-column chromatography system and 2-column chromatography system for the capture of monoclonal antibodies.
In conclusion, this thesis shows great promise in the improvement of chromatographic pro-cessing.
43
6-
Bibliography
[1] J. W. Dailey, “Pharmaceutical industry.” [Online]. Available: https://www.britannica.com/technology/pharmaceutical-industry#accordion-article-history. [Accessed: 20-Sep-2018].
[2] “Upstream Processing - Glossary.” [Online]. Available: https://www.pharma-iq.com/glossary/upstream-processing. [Accessed: 20-Sep-2018].
[3] “Upstream Processing - What is upstream processing.” [Online]. Available: https://esiultrapure.com/upstream-process/. [Accessed: 31-Oct-2018].
[4] “Downstream Processing - Glossary.” [Online]. Available: https://www.pharma-iq.com/glossary/downstream-processing. [Accessed: 20-Sep-2018].
[5] “Downstream Process - What is downstream processing (DSP)?” [Online]. Available: https://esiultrapure.com/downstream-process/. [Accessed: 20-Sep-2018].
[6] H. W. Blanch and D. S. Clark, Biochemical Engineering. 1996.
[7] P. M. Doran, Bioprocess engineering principles, 2nd ed., vol. 9, no. 1. Elsevier, 1996.
[8] “Purification and Formulation in Downstream Processing.” [Online]. Available: http://www.thrutheseason.com/2017/07/04/purification-formulation-downstream-processing/. [Accessed: 31-Oct-2018].
[9] “What are Monoclonal Antibodies.” [Online]. Available: https://www.genscript.com/how-to-make-monoclonal-antibodies.html. [Accessed: 20-Sep-2018].
[10] P. Roldão, A; Mellado, MC; Castilho, LR; Carrondo, MJ; Alves, “Virus-like particles in vaccine development,” Expert Rev. Vaccines, vol. 9, no. 10, pp. 1149–1176, 2010.
[11] W.-S. Ryu, “Retroviruses,” Mol. Virol. Hum. Pathog. Viruses, pp. 227–246, 2017.
[12] “Theory of HPLC Reverse Phase Chromatography.” [Online]. Available: https://www.chromacademy.com/lms/sco5/Theory_Of_HPLC_Reverse_Phase_Chromatograp hy.pdf. [Accessed: 31-Oct-2018].
[13] “Hydrophobic Interaction Chromatography.” [Online]. Available: http://elte.prompt.hu/sites/default/files/tananyagok/IntroductionToPracticalBiochemistry/ch06s0 3.html. [Accessed: 31-Oct-2018].
[14] Cynthia A. Challener, “Making the Move to Continuous Chromatography,” Biopharm Int., vol. 31, no. 4, pp. 14–18.
[15] R. C. R. Rodrigues, “Compact Smb Chromatography for Binary Separation,” FCT-UNL, 2009.
44
[16] A. . E. Rodrigues et al., Simulated moving bed Bed Technology: Priciples, Design and ProcessApplications. 2015.
[17] R. J. S. Silva, R. C. R. Rodrigues, H. Osuna-Sanchez, M. Bailly, E. Valéry, and J. P. B. Mota, “A new multicolumn, open-loop process for center-cut separation by solvent-gradient chromatography,” J. Chromatogr. A, vol. 1217, no. 52, pp. 8257–8269, 2010.
[18] R. C. R. Rodrigues, T. J. S. B. Canhoto, J. M. M. Araújo, and J. P. B. Mota, “Two-column simulated moving-bed process for binary separation,” J. Chromatogr. A, vol. 1180, no. 1–2, pp. 42–52, 2008.
[19] J. M. M. Araújo, R. C. R. Rodrigues, M. F. J. (FCT-U. Eusébio, and J. P. B. (FCT-U. Mota, “Chiral separation by two-column, semi-continuous, open-loop simulated moving-bed chromatography,” J. Chromatogr. A, vol. 1217, no. 33, pp. 5407–5419, 2010.
[20] R. C. R. Rodrigues, R. J. S. Silva, and J. P. B. (FCT-U. Mota, “Streamlined, two-column, simulated countercurrent chromatography for binary separation,” J. Chromatogr. A, vol. 1217, no. 20, pp. 3382–3391, 2010.
[21] J. P. B. Mota, “Cromatografia em Leito Móvel Simulado Avanços recentes,” 2007.
[22] J. Araújo, R. Rodrigues, R. Silva, and J. Mota, “Single-column Simulated Moving-bed Process with Recycle Lag: Analysis and Applications,” Adsorpt. Sci. Technol., vol. 25, no. 9, pp. 647– 659, 2007.
[23] J. C. Antunes, J. P. B. Mota, and T. Santos, “SIMULATED MOVING BED TECHNOLOGY Principles, Design and Process Applications,” FCT-UNL, 2018.
[24] A. Chibério, T. Santos, J. P. B. Mota, G. F. M. Policarpo, and J. C. Antunes, “Novel Single-Column Simulated Moving-Bed Chromatography for Quasi-Continuous Purification of Biomolecules.”