______________________________________________________________________________________________ https://periodicos.utfpr.edu.br/rbfta
Evaluation of the Quality of the Shielded
Metal Arc Welding Process Using Speckle
Interferometry
ABSTRACT
Felipe Maia Prado [email protected] orcid.org/0000-0001-9350-2496 Faculdade de Tecnologia de Itaquera “Prof. Miguel Reale”, São Paulo, São Paulo, Brasil.
Daniel José Toffoli [email protected] orcid.org/0000-0003-3086-6465 Faculdade de Tecnologia de Itaquera “Prof. Miguel Reale”, São Paulo, São Paulo, Brasil.
Sidney Leal da Silva [email protected] orcid.org/0000-0001-7663-5545 Faculdade de Tecnologia de Itaquera “Prof. Miguel Reale”, São Paulo, São Paulo, Brasil.
Speckle, which is a branch of optics that studies the interference pattern caused by the incidence of coherent light in a material’s surface, has some optical techniques and methods that can be successfully applied to determine properties of materials. In this work we used the method called THSP, Time History Speckle Pattern, in samples made of AISI 1020 carbon steel that were submitted to the shielded metal arc welding (SMAW) process, with the objective of identifying (qualitatively) the level of irregularity on its welded surface, by comparing these samples with a default sample, made with the same material. The technique of spekle by reflection was used for data collection. The results showed quantitative diferences between the default welded sample and the other samples, and there are good perspectives that speckle can be applied to determine the quality of the welding process, since the results showed more accuracy than visual inspection.
INTRODUCTION
Several speckle techniques and methods can be used to study superficial irregularities on materials. The relevance of Speckle applications in Engineering is shown in several current works, for example, in the search for new techniques and methods of measuring roughness on material surfaces, as shown in the works of Marchiori and De Souza (2013); Prazak and Ohlidal (2001); or in the determination of material properties, important both in Materials Engineering and in Materials Physics, as presented in the work of Da Silva et al. (2017). And even in works related to new techniques and methods for the evolution of Speckle, for applications both in scientific research and in educational laboratories, as presented in the work of Paiva and Muramatsu (2004).
Speckle is the branch of physics that evaluates the statical or dynamical behavior of the interference pattern produced by coherent light when it interacts with a surface (DA SILVA and MURAMATSU, 2007; FERREIRA, 2003; HECHT, 2002; and GUENTHER, 1990). The search for methods is instrumental for analysing the data obtained by the several speckle techniques, since they can bring more accuracy and quickness to the analysis and ultimately better results. Visual inspection is used to discover discontinuities on materials that can appear in different manufacturing processes. It is normally used in cast materials and welded elements (MARTIN, 2013). By using the proposed method, the authors could quantitatively classify the quality of the welded joint made in samples of AISI 1020 carbon steel by the process of shielded metal arc welding. The welded samples and the default sample were recorded by a camera during the incidence of a He-Ne laser and the videos were used to obtain the relationship between intensity of the reflected light and time of exposure.
SHIELDED METAL ARC WELDIND (SMAW)
Shielded Metal Arc Welding (SMAW) is a welding process that consists on the use of an electric arc between the electrode and the metals to be joined, so that both the electrode and the materials weld simutaneously. The coat of the electrode is consumed during the processes, generating vapors that act as shielding gases, protecting the weld from contaminations. SMAW is used in different situations: in the industry (for maintenance of equipments and structures) and even under water. It can be used to weld materials with width from 1.5 mm to 30 mm and in any position. This process is mainly manual, and can be applied to several materials, as nickel and cupper alloys, although it is primarily used to weld iron and steel. This welding process has several industrial applications because of its simplicity and versatility. However, it is not applicable to materials with low melting temperature, as zinc, and to very reacive metals as titanium and niobium. Since it is a primarily manual process, it depends a lot on the operator hability, which must be a trained and experient professional. More details can be found on the work of Montalvo et al. (2016).
VISUAL INSPECTION
The simplest method of non-destructive inspection used to analyse welded joints is the visual inspection, that determines if a component is acceptable under certain quality standards. Visual inspection is not exclusive for welded joints; it can be as well used to check the quality of components produced by any other process. One of its purposes it to detect unacceptable discontinuities like lack (or excess) of deposition, cracks, or pits, thus helping to obtain welded joints with high dimentional precision, and to ensure conformity in the process. The more common discontinuities found in welded joints are excessive concavity, excessive convexity, deformation, insufficient deposition, lack of melting, lack of penetration, excessive penetration, microcracks, pits, among several others. Details regarding discontinuities can be found on the paper of Martin (2013).
It is not the intention of this work to analyse every type of discontinuity, but to propose an alternative method that associates speckle interferometry to visual inspection, since the first has more accuracy and allows researchers to get more details from the observations – hard to get from the naked human eye. Furthermore, the visual inspection is totally dependent on the individual, because each person has different sensibility to light, must be trained to know what to look for, and the excitation of the eye depends on the reflection of light on the analysed surface, since the illuminated object is the one that is observed, not the light source – speckle interferometry is not subjected to any of these conditions. SPECKLE
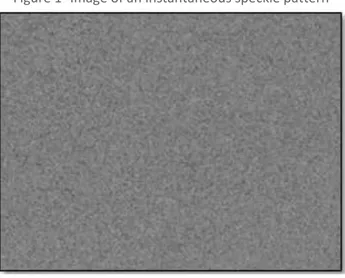
Speckle is a branch of optics that evaluates the statical or dynamical behavior of the interference in surfaces that are illuminated by a coherent light source in some time interval (DA SILVA and MURAMATSU, 2007).
Figure 1- Image of an instantaneous speckle pattern
RELATIVE MEAN INTENSITY
Each video, vj (j = 1, 2, ..., m), containing the speckle pattern, can be divided in n frames, qi. So, to each video vj one has a collection of frames {q1, q2, ..., qi, ..., qn}. The mean value for the intensities in each frame is:
ۃIiۄ = Ik p
k=1
/Imax (1) where Ik/Imax representes the normalized intensity on pixel k (k = 1, 2, ..., p) from the image. The mean of the means of the intensities of the n frames per video, <<Ii>>, can be determined by:
ۃ𝐼𝑗ۄ = ۃۃ𝐼𝑖ۄۄ 𝑛 𝑖=1
(2) If each video represents a position on the sample, then every position j is associated with a mean intensity <Ij>.
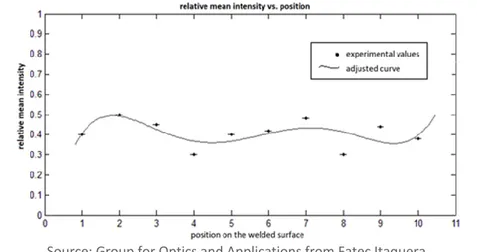
Figure 2- Distribution of the relative mean intensity versus position on the welded surface
Source: Group for Optics and Applications from Fatec Itaquera.
With the values of the relative mean intensities versus positions on the welded surface, one can build a distribution shown in the scheme of Figure 2. This distribution provides a quantitative profile of the irregularities on the welded surface in the sample.
METODOLOGY SAMPLES
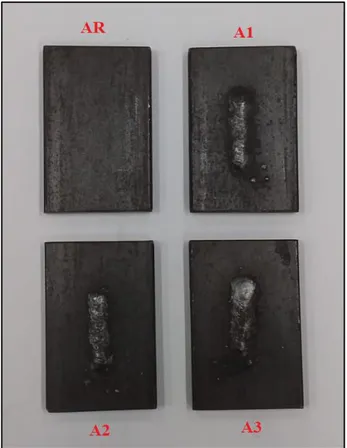
Four samples (Figure 3) made of AISI 1020 carbon steel were used in this work: one default sample (AR), with no welded bead, and three samples (A1, A2 and A3)
welded using the SMAW process. All the samples were rectangular (5 x 10) cm with 5 mm thickness. The eletrode used in the SMAW process was ER 7018, with 2.5 mm diameter, from ESAB, and had the following chemical composition: C (0.07), Si (0.41), Mn (1.10), P (0.022) and S (0.009).
Figure 3 - Samples: AR – default sample; A1, A2 and A3 – welded samples
Source: Group for Optics and Applications from Fatec Itaquera.
TECHNIQUES
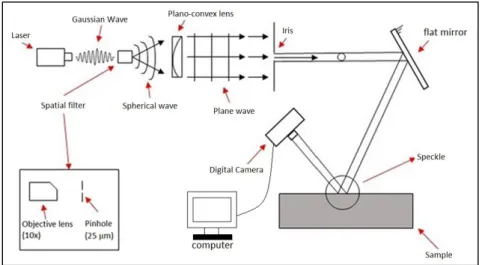
A Dynasty 200 welding machine from Miller was used to produce the samples, by using approximately 70 A alternating current. The optical technique employed in this work was the experimental configuration of speckle by reflection, as show by Figures 4 (scheme) and 5 (real configuration).
The light source was a He-Ne laser (FERREIRA, 2003) (wavelength = 632,8 nm), that was conducted to a spatial filter made of an objective (10x enhancement) and a pinhole of 25 mm, that converts the Gaussian wave into a spherical wave. The wave was then conducted to a plan-convex lens, so it became a flat wave, and the iris allowed us to select the diameter of the beam. The laser was then reflected by a flat mirror which function was to direct the light to the sample, so that the interference pattern could be obtained.
Figure 4- Scheme of the experimental configuration of speckle by reflection
Source: Group for Optics and Applications from Fatec Itaquera.
This pattern was captured by a digital camera which can record 25 frames per second, each frame with 640 pixels width x 480 pixels height, and the videos were recorded during 4 seconds onto the computer (so we get 100 frames to each video).
Figure 5- Photograph of the experimental configuration of speckle by reflection: (1) He-Ne laser; (2) Spatial filter; (3) plan-convex lens; (4) Iris; (5) Flat mirror; (6) Sample; (7)
Digital Camera; (8) Computer for data processing
Source: Group for Optics and Applications from Fatec Itaquera.
For each sample, 10 videos of 4 seconds each were recorded in diferente positions along a 5 cm length (1 video each 0,5 cm). Data from samples A1, A2 and A3, that went through the SMAW process, were then compared with data from sample AR, the reference, with no welded joint.
METHOD
By using the developed computational method, it was possible to correlate the relative mean intensities with the position on the sample of the interference patterns. Graphics from samples A1, A2 and A3 were compared with the graphic with data from the default sample, AR, so that one could compare the curves and determine which of the 3 welded samples was more similar to the default sample, which had more regular surface. The procedures for the computational analysis were, to each sample, the following:
10 videos were recorded in diferent positions of the sample;
Each vídeo, vj, with the interference patterns, was divided in frames, qj, and the first 100 frames were selected to the calculation of the intensities; The relative mean intensity was calculated by equation (1) to each frame, qj,
from the intensities of each one of the frame’s pixels. Each frame has 640 x 780 = 499,200 pixels. The higher value for intensity from all the frames was used as the maximum intensity, Imax, in equation (1);
The medium relative intensity from the 100 frames was determined by the use of equation (2);
The relationship between ۃIjۄ x pi was plotted using the 10 values of relative mean intensity (from the 10 videos), where pi represents the positions (i = 1, 2, ..., 10). The uncertanties of the relative mean intensities were calculated using error theory (VANIN, GOUFFON and HELENE, 1991; VUOLO, 1992). The curves were adjusted by using the minimum square method (VANIN, GOUFFON and HELENE, 1991; VUOLO, 1992) and compared with the reference, default sample, in order to determine which of the samples, A1, A2 or A3, had the best welded joint according to the surface regularity criterion, and the results were compared with visual inspection.
RESULTS AND DISCUSSION
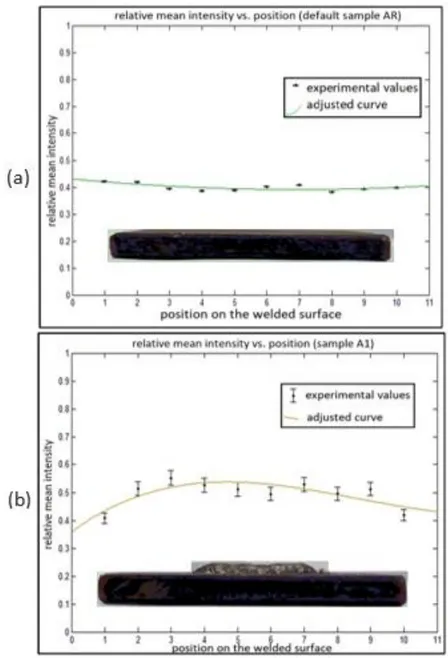
The relative mean intensities for each sample (A1, A2 and A3) and for each position in the welded surface are shown in Figure 6. By observing Figure 6 a, one can notice the linear relationship between the relative mean intensity and the position on the welded surface from where the intensity was collected.
This result was expected since the default sample was not submitted to the SMAW process, and its surface does not have many irregularities – so that the reflection of the laser would be approximately equal on each analysed point. The calculated mean uncertainty for the relative intensities is 0.15%. If the sample’s surface was perfectly polished, the obtained relationship would be a constant, a perfect straight line.
Figure 6- Relative mean intensity as function of the position on the welded surface: (a) default sample–AR; (b) welded sample–A1
Source: Group for Optics and Applications from Fatec Itaquera.
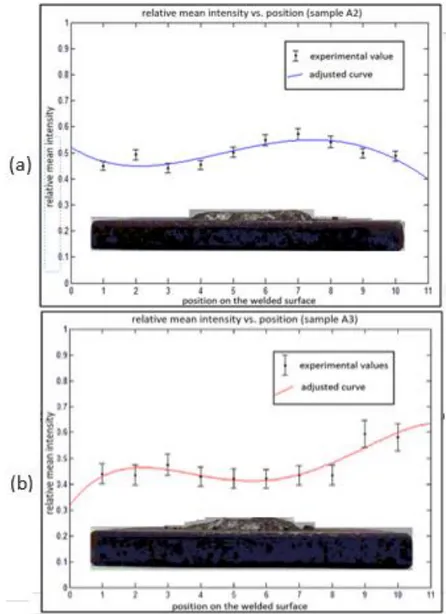
By visually comparing the graphics obtained for all the samples, it can be said that samples A1 (Figure 6 b) and A2 (Figure 7 a) have graphics with more similarities to the default sample than sample A3 (Figure 7 b).
By calculating the mean uncertainties of the relative mean intensities of samples A1 and A2, one can obtain, respectively, 2.4% and 1.9%, which proves that sample A2’s curve has more similarity with the default sample than sample A1’s (the values for the mean uncertainties are closer). Sample A3’s graphic is the one
with less similarity to the default sample (AR), which can be proved by the calculated mean uncertainty of its relative intensities (4.1%).
These results show that the proposed method can be used to determine the regularity of the welded surface, since these same observations could have been done by looking at the photographs of the samples (Figure 3).
Figure 7- Relative mean intensity as function of the position on the welded surface: (a) welded sample–A2; (b) welded sample–A3
CONCLUSIONS AND PERSPECTIVES
The method presented in this work showed to be efficient and comparable to the visual inspection when analysing the regularity of samples welded by SMAW. As an advantage when compared to the visual inspection, the method presents quantitative results with good accuracy, due to the huge amount of data that is obtained with the video collected as part of the technique of speckle by reflection, which is a fast, effective technique. This result points to the possibility of quantifying the visual inspection of samples welded by the SMAW method.
As a possibility of enhancement of this work, the default sample could be a welded surface already inspected and approved as an excellent welded joint, which means its surface presents a very high pattern of regularity. By using this default sample, a standard process could arise from the process presented in this work, and it would become more reliable and attractive to the industry.
Another perspective is to promote adjustments to the technique and to have new methods of data treatment that are comparable to the other criteria of visual inspection, not only the regularity of the surface.
Avaliação da qualidade do processo de
soldagem a arco elétrico com eletrodo
revestido pelo uso de interferometria
Speckle
RESUMO
O Speckle, que é uma área da Óptica que estuda o padrão de interferência causado pela incidência de luz coerente na superfície de um material, conta com algumas técnicas e métodos ópticos que podem ser aplicados com sucesso para determinar propriedades de materiais. Neste trabalho, usamos o método conhecido por THSP (Time History Speckle Pattern, ou Evolução Temporal do Padrão de Speckle) em amostras de aço carbono AISI 1020 submetidas ao processo de soldagem a arco elétrico com eletrodo revestido, com o objetivo de identificar (qualitativamente) o nível de irregularidade na superfície soldada, por meio de comparação das amostras com uma amostra padrão, feita com o mesmo material. A técnica de Speckle por reflexão foi utilizada para a coleta de dados. Os resultados mostraram diferenças quantitativas entre a amostra padrão soldada e as demais amostras, e há boas perspectivas de que o Speckle possa ser usado para determinar a qualidade do processo de soldagem, visto que os resultados mostraram mais acurácia que a inspeção visual tradicional.
PALAVRAS-CHAVE: Interferometria Speckle; Inspeção visual; Soldagem por eletrodo revestido.
Evaluación de la calidad del proceso de
soldadura por arco de metal protegido
utilizando interferometría Speckle
RESUMEN
El Speckle, rama de la Óptica que estudia el patrón de interferéncia causado por la incidencia de luz coerente en la superfície de un material, tiene algunas técnicas y métodos ópticos que pueden ser usados com éxito para determinar propiedades de materiales. En este trabajo, usamos el método conocido como THSP (Time History Speckle Pattern, o Evolución Temporal del Patrón Speckle) en muestras de acero al carbono AISI 1020 sometidas al proceso de soldadura por arco de metal protegido, con el objetivo de identificar (cualitativamente) el nivel de irregularidad en la superficie con soldadura comparándose las muestras con una muestra estándar hecha con el mismo material. La técnica de Speckle por reflexión fue utilizada para obtenerse los datos. Los resultados presentaron diferencias cuantitativas que producen buenas perspectivas para una alternativa en la evaluación de la calidad de la soldadura, por la mejor precisión de los resultados, en comparación com la inspección visual tradicional.
PALABRAS CLAVE:Interferometría Speckle; Inspección visual; Soldadura por arco de metal
ACKNOWLEDGEMENTS
The authors thank Professor Eduardo Acedo Barbosa from Fatec São Paulo for the He-Ne laser.
REFERENCES
DA SILVA, E. R.; MURAMATSU, M. O fenômeno do speckle como introdução à metrologia óptica no laboratório didático. Rev. Brasileira de Ensino de Física (São Paulo), v. 29, p. 283-286, 2007.
DA SILVA, S. L. et al. Determinação de propriedades mecânicas do aço 1010 sob tensão no regime elástico por meio de Speckle dinâmico. Revista Brasileira de Física Tecnológica Aplicada, v.4, n. 1, p. 1-15, 2017.
FERREIRA, M. Óptica e Fotónica. Primeira Edição. Lisboa: Lidel-Edições Técnicas, 2003. 438 p.
GUENTHER, R. D. Modern Optics. United States of America. John Wiley & Sons, 1990. 706 p.
HECHT, E. Óptica. Segunda Edição, Lisboa, Portugal. Fundação Calouste Gulbenkian, 2002. 790 p.
MARCHIORI, M. M.; DE SOUZA, A. J. Estudo para a proposição de um novo método de medição de rugosidade baseado em reflexão difusa de LASER. 7º Congresso Brasileiro de Engenharia de Fabricação. Associação Brasileira de Engenharia e Ciências Mecânicas, 2013.
MARTIN, C. C. Ensaio visual. 5º edição. Ed. Associação Brasileira de Ensaios não Destrutivos e Inspeção, 2013. 314 p.
MONTALVO, R. A. et al. Interferometria Speckle para evaluar la flexión de una barra de alumínio. Revista Mexicana de Física, v. 62, p. 125-134, 2016.
PAIVA JR, R. D.; MURAMATSU, M. Desenvolvimento de um rugosímetro a LASER. Revista de Física Aplicada e Instrumentação. v.17, n. 2, p. 60-69, 2004.
PRAZAK, D.; OHLIDAL, M. Laser speckle spectral correlation and surface roughness. In: 12th Czech-Slovak Polish Optical Conference on Wave and Quantum Aspects of Contemporary Optics. International Society for Optics and Photonics, p. 339-347, 2001.
VANIN, V. R.; GOUFFON, P.; HELENE, O. A. M. Tópicos Avançados em Tratamento Estatístico de Dados em Física Experimental. 2. Edição. São Paulo: Editora Edgard Blucher Ltda, 1991. 116 p.
VUOLO, J. H. Fundamentos da Teoria de Erros. São Paulo: Editora Edgard Blucher Ltda, 1992. 225 p.
Recebido: 08 de novembro de 2019. Aprovado: 15 de abril de 2020. DOI:
Como citar: PRADO, F. M., TOFFOLI, D. J., DA SILVA, S. L., Evaluation of the quality of the shielded metal arc welding process using speckle interferometry, Revista Brasileira de Física Tecnológica Aplicada, Ponta Grossa, v. 7, n.1, p. 22-36, abril. 2020.
Contato: Daniel José Toffoli: [email protected]
Direito autoral: Este artigo está licenciado sob os termos da Licença Creative Commons-Atribuição 4.0 Internacional.