Universidade de Lisboa
Faculdade de Ciências
Departamento de Biologia Animal
Tetracycline tagging in embryos of two gobiesocid species, L.
purpurea and L. lepadogaster – Application to fish population
dynamics studies
Ana Sofia Pires Rebelo
DISSERTAÇÃO
Mestrado em Ecologia Marinha
2012
Universidade de Lisboa
Faculdade de Ciências
Departamento de Biologia Animal
Tetracycline tagging in embryos of two gobiesocid species, L.
purpurea and L. lepadogaster – Application to fish population
dynamics studies
DISSERTAÇÃO
Orientada por Professor Doutor Henrique Cabral
e pela Doutora Ana Faria
Ana Sofia Pires Rebelo
Mestrado em Ecologia Marinha
2012
i
Acknowledgements
I would like to give an enormous thank you to my advisor Dra. Ana Faria for all her support, guidance and invaluable help in the field and laboratory day-to-day work. This work could not have been done without her.
To my advisor Prof. Dr. Henrique Cabral, for all his advice on the adequate statistical tests and procedures.
I would also like to thank Diana Rodrigues, for helping me carry all those heavy rocks with eggs up the hill into my car.
I am also very grateful to Dra. Rita Borges for all her help in the field work and for her very helpful and essential insight and recommendations in the otolith data analysis. I would also like to send a very grateful thank to Prof. Dra. Ana Amorim for allowing me use of the fluorescence microscope, and for all her patience explaining me how it worked.
This work was supported by MATRIX Project (PTDC/MAR/115226/2009), financed by Fundação para a Ciência e Tecnologia.
To my parents, for providing me with this wonderful opportunity for me to peek into the world of investigation science.
And finally, to my partner João, for all his love, dedication and for all those weekend mornings where he had to kick me out of bed in order for me to go tend to my larvae.
iii
Abstract
For the past few years studies of larval dispersal have been gaining notoriety, partially due to the innovating technologies that facilitate these kinds of works. Larval dispersal is crucial in the understanding of population dynamics and connectivity, which have important implications in the design and maintenance of Marine Protected Areas (MPAs). The marking of calcified tissues with the antibiotic tetracycline is a frequently used methodology in scientific studies, and in the past decades it has been used to study population connectivity through larval dispersal. The main goal of this work was to validate the procedure for tetracycline tagging of the otoliths of embryos of two gobiesocid species found in the Portuguese coast: Lepadogaster purpurea and Lepadogaster lepadogaster. This meant determining what would be the minimum tetracycline concentration needed to mark the larvae’s otoliths with an immersion time of only 30 minutes, and to assess if these immersions had any effect on the larvae’s survival rates. For this purpose, eggs, in the pigmented-eye stage, were immersed for 30 minutes in different concentrated tetracycline solutions, in order to determine the appropriate concentration for successful marking of otoliths. In addition, the possible effects of tetracycline in larvae’s survival rates were also analyzed. Observation of otoliths of larvae of different ages, under a fluorescence microscope, showed a high percentage of autofluorescence, both in control and treatment samples, with no otoliths being considered as truly marked. Comparison of results from 30-minutes immersions and longer ones indicate that for this tagging technique, the immersion time also plays a key role, having the 2 and 15-hours immersions produced positively- tagged otoliths. However, after statistical analysis, no correlation between the different tetracycline treatments and the levels of mortality was found, indicating that this immersion in tetracycline solutions for a time period of 30 minutes had no effect on the larvae’s survival rates.
v
Resumo
Recentemente, cada vez mais atenção tem sido dada à problemática da perda da biodiversidade dos ambientes marinhos, assim como da depleção dos stocks de pesca. Uma solução encontrada é a criação de Zonas Marinhas Protegidas (ZMP). Porém, para uma correcta criação e manutenção destas zonas, é necessário um profundo conhecimento da dinâmica existente entre as populações locais.
A conectividade entre populações é geralmente definida como a ligação demográfica existente entre populações através da dispersão de indivíduos sob a forma larvar. O nível de conectividade entre populações determina se estas serão consideradas como demograficamente “abertas” ou “fechadas”.
A maioria dos organismos marinhos possui um ciclo de vida bipartido, constituído por uma fase dispersiva, normalmente sob forma larvar pelágica, e uma fase bentónica, que geralmente se refere à fase adulta da vida do indivíduo. A fase dispersiva desempenha um papel fulcral na conectividade entre populações, sendo que a grande maioria da dispersão se dá nesta fase de vida. Assim sendo, é muito importante para uma correcta construção e manutenção das ZMP um bom conhecimento das ligações existentes entre as populações locais através da dispersão larvar.
Tradicionalmente, as larvas de organismos marinhos eram consideradas como partículas passivas, não tendo qualquer papel activo sobre a sua dispersão, sendo que esta era maioritariamente ditada pelo seu Período Larvar Pelágico e pelas correntes oceânicas superficiais. Assim sendo, os estudos de dispersão larvar eram bastante mais simples, bastando uma análise dos padrões das correntes oceânicas superficiais para se ter uma ideia da conectividade entre populações.
Porém, avanços recentes nos estudos de genética e comportamento larvar revelam que as populações não são tão demograficamente abertas como era de esperar se as larvas tivessem um papel completamente passivo na sua dispersão. Estes estudos permitiram concluir que as larvas desenvolvem capacidades que lhes permitem escolher a sua direcção, contrariar as correntes locais, e selecionar um habitat para assentar, tendo assim um papel activo na sua distribuição.
Por conseguinte, os estudos de dispersão larvar assumem uma complexidade que anteriormente não tinham. Com o objectivo de estudar a conectividade entre as populações através da dispersão larvar, inúmeras metodologias de marcação foram desenvolvidas. Estas técnicas de marcação podem envolver marcas naturais ou artificiais.
De entre as marcas naturais podem contar-se as marcas genéticas, que contam com a heterogeneidade genética naturalmente presente nas populações selvagens, ou as marcas geoquímicas, cuja identificação se baseia nas assinaturas isotópicas deixadas nos tecidos calcificados dos indivíduos pelas características fisico-químicas das diversas massas de água que atravessam durante a sua vida.
vi Já as marcas artificias, mais amplamente aplicadas, podem utilizar variados compostos químicos, desde os compostos fluorescentes, que serão utilizados neste trabalho, aos isótopos radioactivos estáveis que são transmitidos às larvas por via materna.
Este estudo fez uso do composto químico tetraciclina. Este composto químico pode ser administrado de várias formas aos indivíduos marcados. No presente trabalho que consistiu na marcação de ovos de peixe, o método de marcação escolhido foi a imersão das posturas em soluções com diferentes concentrações de tetraciclina. Este composto deposita-se nos tecidos calcificados dos indivíduos, como os otólitos, os quais são depois visualizados sob uma luz fluorescente, onde assumem o aspecto de um anel brilhante. A metodologia de imersão difere de estudo para estudo, sendo mais frequente uma imersão mais prolongada numa solução de tetraciclina com uma concentração reduzida.
O principal objectivo deste trabalho consistiu no desenvolvimento de uma metodologia de marcação dos otólitos das larvas destas espécies através da imersão numa solução de tetraciclina. Uma vez que esta metodologia tem como objectivo ser aplicada directamente no campo, na zona de entre-marés, durante a maré baixa, o tempo de imersão ideal seria de 30 minutos. Neste sentido, foram testadas imersões de 30 minutos em soluções com várias concentrações de tetraciclina, de maneira a determinar qual a concentração mínima necessária para efectivamente marcar os otólitos das larvas. Paralelamente, o efeito da concentração de tetraciclina na mortalidade das larvas foi avaliado.
Este trabalho teve como objecto de estudo duas espécies de Gobiesocidae frequentemente encontradas na costa Portuguesa: Lepadogaster purpurea (Bonaterre, 1788) e Lepadogaster
lepadogaster (Bonaterre, 1788). Estas espécies são morfologicamente muito semelhantes,
diferindo apenas nas épocas reprodutivas (L. purpurea reproduz-se durante o Inverno e L.
lepadogaster durante a Primavera). Possuem uma distribuição que vai desde a costa sul da
Escócia, no Mediterrâneo até ao Senegal. A ecologia destas espécies está muito parcamente estudada, provavelmente devido ao seu pequeno tamanho e ao seu habitat críptico, por baixo de rochas em praias de seixos rolados.
As recolhas de ovos e adultos de L. purpurea (recolhas de Janeiro a Março) e L. lepadogaster (de Março a Junho) foram realizadas na praia de Alpertuche, localizada no Parque Marinho Luiz Saldanha, na Arrábida. Após recolha, os ovos e adultos foram levados para as instalações laboratoriais no Instituto Superior de Psicologia Aplicada (ISPA) em Lisboa, onde foram mantidos em aquários. Após o estudo concluido, todos os adultos e juvenis sobreviventes foram libertados no local de recolha.
As posturas foram imersas em tetraciclina quando os ovos atingiram um estado de desenvolvimento em que era já possível reconhecer os olhos dos embriões pigmentados, pois é nesta fase que os otólitos iniciam a sua formação. Para L. purpurea foram realizadas imersões de 30 minutos em soluções com as seguintes concentrações: 400 mg.L-1; 600 mg.L-1; 800 mg.L-1; 1000 mg.L-1 e 1400 mg.L-1. Adicionalmente, várias larvas recém-eclodidas foram imersas em soluções de tetraciclina com 1000 mg.L-1 durante 1, 2 e 15 horas para efeitos de controlo positivo, e desta forma avaliar visualmente a marca de fluorescência. No caso de L.
vii mg.L-1; 800 mg.L-1 e 1000 mg.L-1. Para ambas as espécies, várias posturas foram deixadas sem tratamento a fim de servirem como grupos controlo.
Após marcação, as posturas foram colocadas em aquários separados, onde eclodiram e as larvas foram desenvolvidas. As larvas foram sacrificadas em diferentes estados de desenvolvimento, e conservadas em etanol a 96% a fim de posteriormente se extraírem os otólitos para observação ao microscópio. Diariamente o número de larvas vivas em cada tratamento e cada replicado foram contabilizadas, para avaliação de taxas de mortalidade. Depois da extracção, os otólitos foram montados em lâminas e observados num microscópio de fluorescência. Os otólitos do controlo positivo foram observados, de maneira a que uma caracterização da marca fluorescente pudesse ser realizada a fim de ser comparada com os resultados das outras observações. Após observação e dependendo do aspecto da sua marca fluorescente, os otólitos foram classificados em três categorias diferentes: 0 (“Sem fluorescência”), 1/0 (“Marca não nítida” ou “Com Autofluorescência”) e 1 (“Marca Nítida”). O tratamento com maior percentagem de otólitos classificados como 1 seria considerado o tratamento óptimo.
Em termos de eficiência de marcação dos otólitos, as imersões de 30 minutos revelaram-se infrutíferas, não tendo nenhum otólito ficado marcado, independentemente da espécie e da concentração aplicada. Porém, quando se comparou os resultados das imersões de tempos diferentes em soluções com 1000 mg.L-1, observou-se um melhoramento da qualidade da marca fluorescente com o aumento do tempo de imersão. Ou seja, pode-se concluir que, para estas espécies, o sucesso de uma marcação de otólitos de larvas através da imersão de posturas em soluções de tetraciclina não depende só da concentração da solução, mas também do tempo de exposição.
Porém, não foi encontrada nenhuma relação estatisticamente significativa entre as imersões de 30 minutos e as diferentes taxas de mortalidade dos respectivos grupos. Assim sendo, pôde-se concluir que imersões de 30 minutos em soluções de tetraciclina até 1400 mg.L-1 não afectam as taxas de mortalidade de L. purpurea, e imersões de 30 minutos em soluções com concentrações até 1000 mg.L-1 não têm efeito sobre as taxas de mortalidade de L.
lepadogaster.
Os resultados sugerem, desta forma, que imersões de apenas 30 minutos não marcaram os otólitos de larvas de L. purpurea nem de L. lepadogaster. Para o sucesso da marcação serão necessários tempos de imersão mais prolongados. Estudos futuros que testem diferentes métodos de marcação de larvas deverão ser levados a cabo.
Palavras-chave: Gobiesocidae, larvas, marcação com tetraciclina, otólitos, dispersão larvar
ix
Index
Acknowledgements ... i
Abstract ... iii
Resumo ...v
Index ... ix
Introduction ... 1
Materials and Methods
Collection and handling of breeding adults and eggs ... 9Experimental design and tetracycline marking ... 10
Larval rearing and sampling ... 10
Otolith extraction, preparation and analysis ... 11
Data Analysis ... 12
Results
Tetracycline marking ... 13Positive control otoliths ... 13
Treatment otoliths ... 14 Classification of samples ... 18 Mortality rates ... 20
Discussion ... 23
References ... 29
1
Introduction
Impact of human activities on fishing stocks and natural populations has been a pressing matter for quite some time, gaining more and more attention by scientists, politicians and the general public in the past few years (Sale et al., 2005; Cowen, 2007; Jones et al., 2007). The establishment of Marine Protected Areas (MPAs) has been pointed as a solution to contradict the global decline of fishery resources and biodiversity (Sale et al., 2005; Leis, 2006; Mora et al., 2006; Cowen et al., 2007; Jones et al., 2007). In order to correctly define the boundaries of these MPAs, a profound knowledge of the connectivity between local populations is needed.
Population connectivity usually refers to “the demographic linking of local populations through the dispersal of individuals among them as larvae, juveniles or adults” (Sale et al., 2005). The levels of connectivity among local populations will determine whether they function as essentially isolated, ‘‘almost closed’’ populations, or as a metapopulation, with the separate dynamics of individual populations being buffered by subsidy of recruitment from other populations (Sale 2004).
Therefore, the effectiveness of MPA’s as management tools is highly dependent on the scale of demographic connectivity of local populations. If the populations resident in the MPA are effectively open, they will be dependent on populations located in other areas to be seeded with new recruits. This way, the MPA’s populations may be vulnerable to events outside its borders and as a result, might not fulfill its biodiversity and conservation roles (Leis, 2006; Jones et al., 2007). However, the MPA may still be successful in fulfilling its fishery replenishment role if it exports propagules into the open populations of its associated fish species, thereby providing recruits to fished areas outside its borders. In contrast, if the fish populations of a MPA are largely self-recruiting (closed), then because it supplies most of its own young, the MPA should be able to fulfill its biodiversity role, but not a fishery replenishment role (it exports few propagules, thus the scale of demographic connectivity is too small) (Leis, 2003). A third MPA may fulfill both roles by having a moderate degree of self recruitment, yet still be exporting large numbers of propagules to fished areas (Leis & Carson-Ewart, 2003).
The vast majority of marine organisms have a complex life cycle involving a change between a dispersive stage and a relatively sedentary benthonic life stage (McCormick & Makey, 1997; Roberts, 1997; Leis, 2002; Leis, 2006; Pineda et al., 2007). This is the case with marine reef fishes. Their life cycles are bipartite, being composed of a dispersive pelagic larval stage and a sedentary benthonic adult stage (Leis, 2002; Jones et al., 2009).
2
The pelagic larval phase plays an extremely important role in population dynamics and connectivity, fact that has been recognized since early last century (Hjort, 1926 and Thorson, 1946 in Levin, 2006). In order to stipulate reserve location, size and spacing, it is very important to understand how different areas are connected through larval exchange, which populations serve as source and which serve as sinks (Levin, 2006). Therefore, there’s a general consensus on the importance of understanding fish population dynamics and connectivity in designing and maintaining MPAs (Jones et al., 2005; Levin, 2006; Roy, 2008; Jones et al., 2009), in order to maximize the protection to the nursery areas that provide larvae to the surrounding locations.
To fully understand larval dispersal and population connectivity, one needs to (1) understand the biological and hydrodynamic processes involved in the transport of larvae and (2) derive larval origins and dispersal pathways using geochemical, genetic or artificial markers (Cowen et al., 2007).
The time spent by the larvae in the pelagic environment is usually referred to as the Planktonic Larval Duration (PLD). This period starts at hatching and concludes days to weeks later when the larva settles and starts to adopt a benthic existence in a reef (Victor, 1983). The importance that the PLD phase has in the mechanisms of larval dispersal has been highly overestimated in the past decades (Cowen & Sponaugle, 2009). Traditionally, larvae have been considered as passive elements, flowing in the ocean currents with the plankton (Roberts, 1997; Fuiman, 2002; Leis, 2002; Levin, 2006). This being the case, it was assumed that all fish populations were demographically “open” populations, connected through larval dispersal (Roberts, 1997; Leis, 2002; Leis, 2006). This way, a simplifying assumption (Leis, 2006) presupposed that larval behaviour doesn´t have any significant effect on their dispersal, and fish larvae are planktonic animals with little control over their trajectories, rather than strong-swimming nektonic animals (Leis, 2006). Being so, larval dispersal would be primarily dictated by their pelagic larval-stage duration and ocean currents (Roberts, 1983; Leis, 2006; Cowen et al., 2007). With this assumption in mind, the analysis of larval transport routes was much simpler. Being larval dispersal completely dependent of oceanic factors, all that was needed was an analysis of the surface current patterns. The oceanographic models were then highly used in the design of MPA’s, to change the protection status of reefs, and to argue that marine reserves can maintain both local and outer biodiversity through the supply of propagules (Leis, 2002).
However, genetic and behavioural studies on reef fishes revealed that demographic connectivity and dispersal are not as largely-scaled as often assumed, presenting much more modest scales of dispersal (Jones et al., 1999; Swearer et al., 2002; Jones et al., 2005; Pineda et al., 2007). These studies show that there are some population-isolating mechanisms that enhance local retention (Katz et al., 1983). In the last decade,
3
research on the early life-stages of marine fish larvae has revealed behavioural abilities that dethrone the simplifying assumption about the passive nature of fish larvae (Leis, 2002; Leis, 2006).
It was concluded that larval behaviour plays a much more relevant role in larval dispersal than initially thought (reviews by Leis, 2006; Pineda et al., 2007). It was found that fish larvae develop both swimming and sensory abilities during their pelagic phase, as well as behavioural mechanisms to avoid stronger currents by occupying the epibenthic boundary layer (Leis, 2002; Leis, 2006). This way, they are able to actively influence their dispersal by escaping stronger surface currents and swimming at speeds greater than the mean speed of currents encountered in their oceanic environments (Leis & Carson-Ewart, 1997), and this behaviour may be triggered by a number of different stimuli, such as reef sounds, changes in light, chemical cues or even floating objects such as seaweeds (Leis, 2006; Pineda et al., 2007; Kohn & Clements, 2011). Therefore, the traditional assumption that all populations are “open” is discredited, with populations having higher rates of retention than suspected (Leis, 2002; Levin, 2006).
With the purpose of estimating the dispersal rates of larvae, efforts have been made to develop tagging strategies for use in the aquatic system (Thorrold et al., 2002). These methodologies use tags applied to egg batches or newly-hatched larvae, which can be of an artificial nature, inserted in the larvae, or natural markings (Thorrold et al., 2002; 2007; Levin, 2006). Later, these individuals are recaptured when they recruit to the adult population, and the marked individuals are identified and accounted for. After this, using an extrapolation of the percentage of the population’s total larvae that were effectively tagged, an estimate of self-recruitment is made from the percentage of marked recaptured individuals (Jones, et al., 1999; 2005; Thorrold et al., 2007).
In order to generate successful results, the tagging method has to fulfill certain prerequisites (Thorrold et al., 2002):
- Marked individuals must be unambiguously identifiable some time after the application of the mark. To do so, the mark has to have an appropriate retention time, and that all marked individuals are easily recognizable; - The tagging must not have any effects on the mortality, development and
behaviour of the marked individuals. Therefore, tags must be invisible to predators, non-toxic and have no potential effects on the individuals;
- The tagging techniques must allow the marking of multiple individuals at a time, preferably in a cost-efficient manner;
4
Both artificial and natural tags present advantages and disadvantages, but the only method for marking larvae that remains completely unequivocal is the presence of artificial tags in recaptured individuals (Thorrold et al., 2002).
Natural tags rely on natural genetic heterogeneity or differences in environmental conditions to generate population-specific tags. These tags always have a more equivocal interpretation but, being naturally present, eliminate the need to tag the individuals physically. Geochemical signatures of calcifying structures and genetic markers fall in the category of natural tagging. The geochemical markings are generated naturally by variations on environmental conditions, such as salinity, temperature and water chemistry. These variations in the environmental conditions the larvae faces are naturally “engraved” in its calcifying tissues in the form of differing isotopic signatures, structural attributes and trace elements (Leis, 2006; Thorrold et al., 2007). This way, as larvae travel through different kinds of waters, each with its particular profile of chemical and physical attributes, their travels are “recorded” in the calcifying structures (Thorrold et al., 2007). Therefore, one can deduce where the larvae originated from, or where it has passed, from the multi-elemental signatures induced by a certain quality of water. However, in order to correctly deduce the larvae’s origin or route, one must have knowledge and sampling of many elemental signatures, and their respective sources, and establish that these signatures are stable over time (Thorrold et al., 2002; 2007; Levin, 2006).
Methodologies for assessing larval dispersal based on genetic markers have many different approaches. They can use the genetic variability present in natural populations, paternal genetic analysis, natural spawning variation, or even use individuals that have been genetically modified in laboratory (Thorrold et al., 2002; Jones et al., 2009). However, these tagging methodologies present many disadvantages when compared with other marking methods. Besides being more costly to analyze and to apply, the information resulting from these methodologies is not easy to interpret and often is unpredictable (Thorrold et al., 2002).
The marking of the calcifying structures of larvae (otoliths, statoliths, shells) using chemical artificial markers is a methodology which has been frequently used in larval dispersal studies (Beltran et al., 1995; Jones et al., 1999; 2005; Almany et al., 2007). These marks can be produced by immersion in a solution containing the chemical marker, or through supply of food marked with the chemical compound (Thorrold et al., 2007). The markers more frequently used in this methodology are fluorescent compounds, such as tetracycline or oxytetracycline, calcein (Levin, 2006; Thorrold et al., 2007), radioactive isotopes, such as 137Ba (Almany et al., 2007; Roy, 2008), elemental markers (rare earth elements), or physical marks made through extreme environmental changes, such as thermal signals (Thorrold et al., 2002).
5
Rare elemental markers use natural elements that are usually found or present in very low concentrations in the natural environment and in the larval’s tissues (Thorrold et al., 2002). This method allows for an easy identification of the marked individuals, as well as a good application of the marking to a large number of individuals. However, most of the times the elemental tag does not get absorbed or does not have a retention time long enough for it to serve as a marker, making this tagging technique highly unreliable. Besides these disadvantages, the costs associated with preparation and analysis of the samples is very high when compared to other methodologies with a higher level of successful markings (Thorrold et al., 2002).
Thermal markings are usually applied to analyze hatchery grown fish, but it is being approached as a valid methodology to study marine organisms. This methodology exposes incubating larvae to extreme temperature fluctuations that result in distinctive structural banding in the otoliths (Volk et al., 1999). This methodology presents practically no costs at all for the preparation, and analysis has a cost similar to other methods using artificial marking and recapture of juveniles (Volk et al., 1999). Similarly to the other artificial marking methods, the radioactive isotope labeling methodology consists in an artificial marking of the larvae and posterior recapture, identification and accounting of tagged juveniles. In this methodology, gravid females are injected with trace amounts of rare, stable isotopes that are transferred to the offspring through the egg yolk (Thorrold et al., 2006; Almany et al., 2007; Roy, 2008). The retention time of most of these stable isotopes in the female’s body is long enough that, with a single injection, multiple batches of eggs are marked, producing a long-lasting mark in the center of the larvae’s otoliths. These marks can be identified through isotope ratios of the otoliths and are analyzed through Inductively Coupled Plasma Mass Spectrometry (ICP-MS) (Almany et al., 2007; Roy, 2008). Both Thorrold et al. (2006) and Roy (2008) studies did not detect any negative effects of the injection of low concentrations of stable isotopes on the reproduction rates of the females, or negative effects of the isotope labeling on the survival and development of the larvae. However, the materials needed for this methodology are very expensive and, adding to the laborious work of recollecting the otoliths from the recaptured juveniles, very specialized equipment and technicians are needed for the analysis of the isotopic ratios.
Tagging with artificial fluorescent compounds is the most widely used of the artificial -hn, 1992; Jones et al., 1999). The chemical compound tetracycline is a chemical artificial marker used to produce a fluorescent mark in the larvae’s otoliths. Tetracycline, as well as oxytetracycline, is an antibiotic and fluorescent compound that is integrated into the calcifying tissues of the fish, namely the otoliths. Its mark gets incorporated into the daily growth ring corresponding to the date of the tagging, being
6
visible under fluorescent light. In cases in which the tagging is done on fish embryos or larvae, the tagging is made through immersion of the individuals in a tetracycline containing solution during a preset period of time (Geffen, 1997). Tagging the larvae through tagged food is a problematic methodology since food intake may be irregular
and livi - hn, 1992).
Numerous authors have developed studies in which they use and/or analyze tetracycline tagging of larval calcifying structures by immersion in tetracycline solutions (Schmitt, 1984; Ts
- , 1992; Beltran et al. 1995; Jones et al., 1995; 1999; 2005; Reinert et al., 1998; Champigneulle & Cachera, 2003; Kingsford et al., 2010; Kohn & Clements, 2011). However, the methodology used for the immersion differs from study to study. In the vast majority, the tagging results from a long-term immersion in a low-concentration solution. The time of immersion vary from 1,5 to 24 hours, and the concentration of the solutions spans from 350 mg.L-1 to 1000 mg.L-1 (see Table 10) (Tsukamoto, 1985; Dabrowski & Tsukamoto, 1986; Reinert et al., 1998). There are also some works, that use shorter immersions of just a couple of minutes in a saline solution (to cause osmotic shock) with a high concentration of tetracycline (Alcobendas et al., 1991; 1992; Beltran et al., 1995; Champigneulle & Cachera, 2003), but these methodologies are usually employed in studies that focus in lacustrine species.
The species on wich this study focuses were chosen as model species as their life cycles’, ecology and behaviour have been studied and described in detail before (Gonçalves et al., 1998; Hofrichter & Patzner, 2000; Faria & Gonçalves, 2010; Tojeira et al., 2011). Both are benthic spawners, and present parental care behaviours, with the male providing protection and aeration of the eggs though fanning and rubbing behaviours. They are easily captured during the low tides and maintained and reproduced in controlled conditions, and larvae can be reared up to settlement. Distributional (Borges et al., 2007) and behavioural (Faria & Gonçalves, 2010) studies suggest these species may be retained close to shore. Taken together, these species are a promising model species to study larval dispersal and retention.
Lepadogaster purpurea (Bonnaterre, 1788) and L. lepadogaster (Bonnaterre, 1788) are
two abundant species of clingfish (Gobiesocidae family) with a very similar morphology. The similarity is such that until recently they were considered two subspecies of the same species (Lepadogaster lepadogaster purpurea and
Lepadogaster lepadogaster lepadogaster) (Henriques et al., 2002). They have a
distribution that ranges from the coast of Scotland to Senegal, the Canary and Madeira Islands and the Mediterranean (L. purpurea) and from the northern coast of Spain (Galicia) to northeast Africa, the Canary and Madeira Islands and the Mediterranean (L.
7
Knowledge of Gobiesocidae ecology and behaviour is relatively poor, particularly due to their small size, which enables them to occupy very cryptic microhabitats (Gonçalves et al., 1998; Hofrichter & Patzner, 2000). Both species are common in rocky shores and banks of large pebbles and boulder fields, being found underneath rocks. They adhere to the rocky substractum by means of a sucking disc, which gives an extra adaptation to small habitats and also allows them to resist to the high water currents typical of the sublitoral (Hofrichter & Patzner, 2000). Some species of Gobiesocidae are considered “amphibious fish”, being adapted to living conditions in a strongly exposed habitat, such as the upper sublitoral that gets exposed each low-tide period (Hofrichter & Patzner, 2000).
Although morphologically similar, these two species differ in their breeding season - L.
purpurea’s breeding season occurs mainly during the winter months until the
beginning of spring, while L. lepadogaster’s breeding season is during the spring, till the beginning of summer (Henriques et al., 2002).The main goal of this work was to validate the procedure for tetracycline tagging of the otoliths of embryos of these two gobiesocids. In particular, the minimum tetracycline concentration required to ensure the marking of the embryo’s otoliths was determined and the possible effect the different tetracycline concentrations have on the larvae’s survival was tested.
9
Materials and Methods
1) Collection and handling of breeding adults and eggs Lepadogaster purpurea egg
batches and adults were collected, during the low tide, between January and March 2012, and Lepadogaster lepadogaster eggs and adults
were captured between March and June 2012 at Alpertuche beach (38°28’ N; 8°59’ W) located at the Luiz Saldanha Arrábida Marine Park (Fig.1). The egg batches and adults were relocated and maintained in the facilities located in ISPA-IU (Instituto Superior de Psicologia Aplicada- Instituto Universitário), Lisbon. After the laboratory work was concluded, all the surviving adults and juveniles were released in the same area.
Egg batches, larvae and adults were kept at an average temperature between 14-16°C during the Winter months, and 15-17°C during the Spring and Summer months, with a photoperiod of 14L:10D. Adults were kept in larger aquariums, with a substratum composed of rocks gathered in Alpertuche beach, some opaque PVC tubes and roof tiles. This substratum mainly served as shelter and breeding sites for the adults. They were daily fed a mix of shrimps, clams and mussels. As hatching approached, rocks with eggs were removed from the parental aquaria and transferred to 30 l larval rearing tank.
2) Experimental design and tetracycline marking
Eggs were immersed in the tetracycline solutions, for 30 minutes, as soon as they reached the pigmented-eye stage, when the otoliths begin formation (Beltran, et al., 1995; Tojeira, et al., 2011). This time period was chosen as this is usually the time available between tides, and this methodology is meant to be used directly in the field during the low-tide period.
10
For L. purpurea egg batches, solutions with the following tetracycline concentrations were used: 400 mg.L-1; 600 mg.L-1; 800 mg.L-1; 1000 mg.L-1 and 1400 mg.L-1 (Table 1). In addition, and for validation purposes, newly-hatched larvae were immersed for longer periods of time (1, 2 and 15 hours) in 1000 mg.L-1 solutions. These batches worked as a positive control, and were used to ascertain the appearance of the fluorescent tetracycline mark. For L. lepadogaster egg batches, the following three tetracycline concentrations were used: 600 mg.L-1, 800 mg.L-1 and 1000 mg.L-1 (Table 1).
Six egg batches from L. purpurea and 5 egg batches from L. lepadogaster were assigned to a control group, being immersed in “clean” water for the same 30 minute period.
Table 1: Number of replicates (egg batches) for each treatment for Lepadogaster purpurea and L. lepadogaster.
3) Larval rearing and sampling
After immersion, eggs were placed back to the rearing aquaria, where larvae hatched. Aquaria were maintained at 14-15 ºC for Lepadogaster purpurea and 16-17 ºC for L. lepadogaster, which was consistent with the mean water temperature at the sampling area in the testing dates (Henriques et al. 2002). All tanks were maintained at a salinity of 34-35 PSU, with a photoperiod of 14L:10D. Larvae’s diary diet was composed of Artemia salina and rotifers (supplied by Aquário Vasco da Gama), and fed ad libitum. L. purpurea could not be reared until settlement, unlike
L. lepadogaster, which was successfully reared until the end of its pelagic phase.
Larvae were sacrificed in different developmental stages, and preserved in 96% alcohol.
To examine the effects of the different tetracycline concentrations on mortality rates, the number of live larvae was daily counted in each tank. Mortality rates were determined for two different development periods:
a) 5 days after hatching; b) 10 days after hatching.
Treatment Nº de Replicates L. purpurea L. lepadogaster Control 6 5 400 mg.L-1 3 - 600 mg.L-1 3 5 800 mg.L-1 3 3 1000 mg.L-1 3 3 1400 mg.L-1 5 -
11
These time limits were chosen as they represent critical steps in larval development: mortality is higher in the first 5 days (A. Faria personal observation), after which it starts to decrease; and larvae of L. lepadogaster start spending more time close to the bottom around 10 days after hatching (A. Faria personal observation).
4) Otolith extraction, preparation and analysis
Otoliths were removed and mounted in preheated microscope slides using CRYSTAL BOND™. Samples were kept in opaque boxes, in order to avert tetracycline degradation due to sunlight exposure. Otoliths were observed under a fluorescence microscope Olympus BX-50. Two different fluorescence filters were used, so that the presence or absence of fluorescence from tetracycline could be more accurately determined. Tetracycline has an excitation peak at 390 nm and an emission peak at 560 nm (Skinner & Nalbandian, 1975; Pautke, et al., 2010). The filters used had and excitement specter from 450 to 480 nm and an emission specter starting at 515 nm (Olympus U-MWB (WB)), and an excitement specter from 330 to 385 nm and an emission specter between 420 and 700 nm (Olympus U-MWU (WU)). After observation of the positive control otoliths (from larvae immersed in 1000 mg. L-1 tetracycline solution for 1, 2 and 15 hours), a characterization of the different ranks that would later on be used to categorize the other otoliths was made. This characterization would analyze the thickness and shape of the fluorescent marking and the contrast between the otolith and the surrounding medium. The measuring of the fluorescent marking was made using AxioVision V. 4.8.2.0. software.
Samples were classified in three categories, according to the visibility of the tetracycline marks: Clear marking (1); Not clear/ With Autofluorescence (1/0); No Fluorescence (0). The treatment with the biggest proportion of samples classified as 1, would be considered the most successful one. This analysis methodology is similar to the one used by Tsukamoto (1985) and by Dabrowski & Tsukamoto (1986).
5) Data analysis
The mortality rates were calculated from the percentage of total dead larvae from each day, for each replicate. When all the percentages were collected from each replicate, and these values used for statistical analysis.
In order to verify the existence of statistically significant relations between treatments applied to larvae and the tetracycline markings and the mortality rates, a variance analysis of the results was made. The assumptions for the ANOVA were verified for every set of data, having used the Shapiro-Wilk’s test to verify
12
normalcy, and the Lavene test for homocedasticity. When these prerequisites were not fulfilled, the non-parametric Kruskal-Wallis test was applied. When the requisites were fulfilled, a one-way ANOVA was used.
All statistical analysis were made using StatSoft Inc. (2011) STATISTICA software (version 10).
13
Results
1. Tetracycline marking
Testing began with immersion of L. purpurea larvae in low-concentration solutions (400, 600 and 800 mg.L-1). After viewing these samples in the fluorescence microscope and assessing that no markings or fluorescence were visible, immersions were made using higher-concentrated solutions (1000 and 1400 mg.L-1). The samples resulting from these immersions exhibited fluorescence, but no defined and clear tetracycline marking.
With these results in mind, when immersions of L. lepadogaster larvae began, high-concentrated tetracycline solutions were used from the start (800 and 1000 mg.L-1). A lower- concentrated solution was also used (600 mg.L-1) after viewing fluorescence in samples resulting from the 800 mg.L-1 immersions.
1.1. Positive control otoliths
For the validation of the marking technique, newly-hatched L. purpurea larvae were immersed in a 1000 mg.L-1 tetracycline solution for 1, 2 and 15 hours.
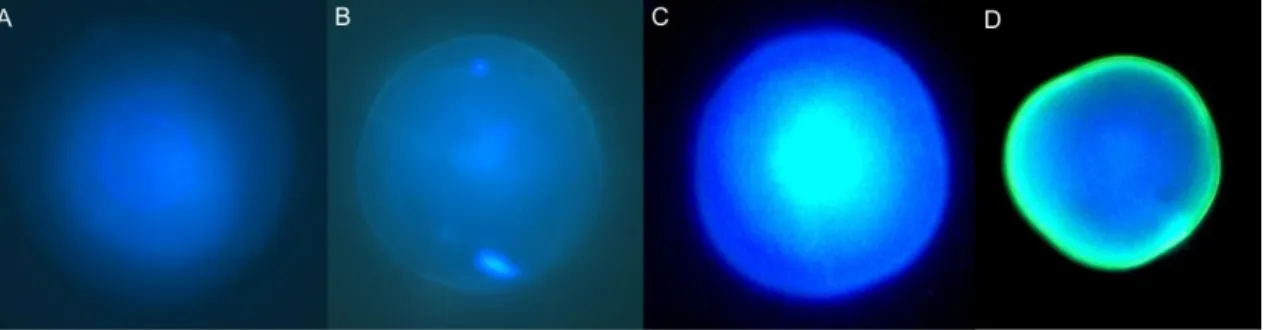
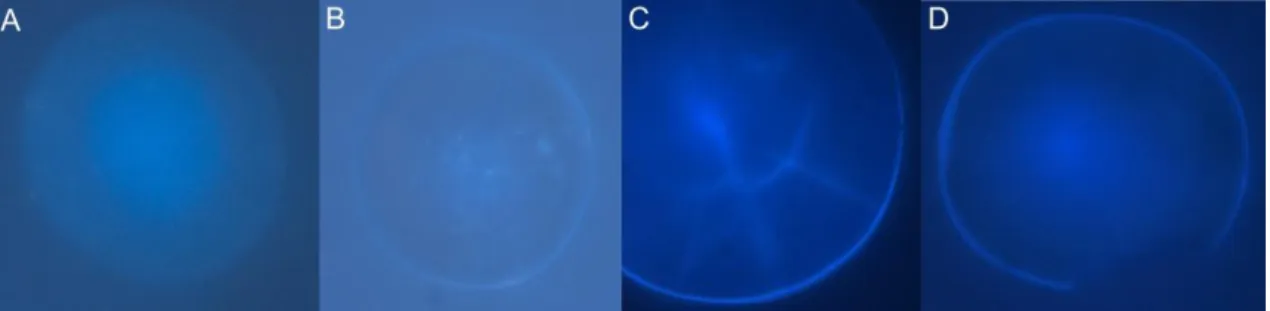
When observing otoliths from these treatments, a vast difference in fluorescence and marking quality was observed between the samples that came from the 1 and 2 hours immersion and the samples that came from the 15 hours one. The samples from the 15 hour immersion-period (N=2) displayed a much better and distinct tetracycline marking (Fig. 2). These samples were then used for validation purposes, by comparing the obtained fluorescence mark to the mark produced by the treatments being investigated.
In these samples, the tetracycline marking in the otoliths presented a minimum thickness of 2.0 µm. This kind of sample is an example of an otolith with a clear tetracycline fluorescent mark, and would be classified as 1 (“Clear Marking”) in the Marking Efficiency Analysis (see Methods). In this sense, in order to an otolith to be ranked as 1 (“Clear Marking”), its fluorescent mark must have a thickness of at least 2.0 µm. In order to determine if with a lower-concentration solution the tetracycline marking would be thinner, the markings present on the otoliths from the 2-hour immersion treatment (N=2) were also measured. Similarly to the other validation otoliths, the tetracycline markings found in the 2-hour immersion otoliths had a thickness bigger than 2 µm, not differing much from the measurements taken from the 15-hour immersion otoliths.
14
Fig. 2: Photographs of an otolith removed from a 4 days-old L. purpurea larva that had been immersed in a 1000
mg.L-1 solution for 15 hours. The larva was immersed right after hatching, and sacrificed 4 days after hatching. The
arrows indicate the tetracycline mark. The same otoliths were seen under fluorescent light using two different filters. A: WB (excitement specter from 450 to 480 nm and an emission specter starting at 515 nm); B: WU (excitement specter from 330 to 385 nm and an emission specter between 420 and 700 nm).
From these results, the characterization of the different ranks was as follows: Rank 1: “Clear Marking”:
o When observed under fluorescent light, the otolith shows a clear and discernible tetracycline marking in the form of a bright ring;
o The marking must completely surround the otolith (whole ring); o It has to have a good contrast with the surrounding medium; o The tetracycline marking has to have at least 2.0 µm thickness. Rank 1/0: “No Clear Marking” or “With Autofluorescence”:
o When observed under fluorescent light the otolith shows fluorescence, even in the control treatment;
o Does not show a visible and discernible tetracycline mark (< 2.0 µm). Rank 0: “No Fluorescence”:
o When observed under fluorescent light, the otolith is not visible.
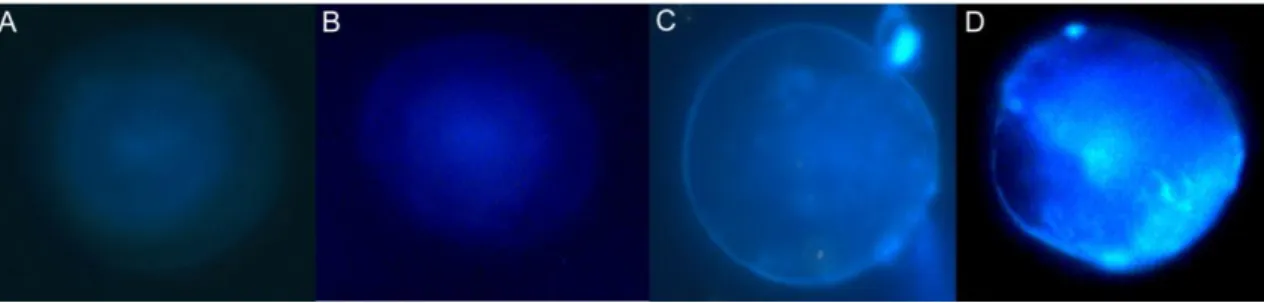
1.2. Treatment otoliths
A comparison of all otoliths was made through visual inspection of otoliths. In addition, a measurement of the thickness of tetracycline mark was made. For this visual analysis, the photographs used were the ones taken under fluorescent light using the Olympus U-MWU (WU) filter, as the tetracycline marks are more visible with this filter compared to the photographs taken using the Olympus U-MWB (WB) filter (Fig. 2). The positive control treatment enabled the visual comparison of L. purpurea otoliths exposed to the same tetracycline concentration (1000 mg.L-1), but increasing immersion times (30 minutes, 1, 2 and 15 hours). Otoliths from the 30 minute
15
immersion period (N=11) did not all display fluorescence; the ones that had fluorescence were blurry and did not present a distinct tetracycline mark. Nonetheless, there were some tetracycline marks, but none of them had a thickness larger than 2.0 µm (biggest had 1.31 µm).
The otoliths from the 1 hour immersion period (N=7) all presented strong fluorescence. However, none of them had a clear, distinct tetracycline mark.
The otoliths from the 2 hours immersion period presented a strong fluorescence and a good contrast with the background of the sample. The tetracycline mark is visible, but the autofluorescence is still present. In all samples the tetracycline fluorescent marking’s thickness is bigger than 2 µm (2.07 and 2.74 µm).
Fig. 3: Photographs of otoliths from L. purpurea larvae, using a fluorescence microscope with the WU filter. All
larvae were immersed in a tetracycline solution of 1000 mg.L-1 for different periods of time: A- immersion of 30
minutes (7 days-old larva); B- immersion of 1 hour (7 days-old larva); C- immersion of 2 hours (4 days-old larva); D- immersion of 15 hours (4 days-old larva).
Regarding the otoliths from the different concentration treatments (30 minutes immersion period), there was not a clear distinction between otoliths from control groups and otoliths from treatment groups. In addition, some control otoliths appeared to have a tetracycline mark (Fig. 4), but none of the so-called tetracycline markings had the necessary thickness in order to be considered a true fluorescent marking (0.76 µm for otolith C and 0.46 µm for otolith D).
16
Fig. 4: Photographs of otoliths from L. purpurea larvae, using a fluorescence microscope with the WU filter. All
otoliths come from control group larvae, i.e. larvae that did not suffer immersion in a tetracycline solution. Otoliths A and B are examples of how the vast majority of control samples look like. Otoliths C and D appear to have a tetracycline marking around the edge of the otolith. Otoliths were extracted from larvae with the following ages: A- 5 days; B- 7 days; C- 5 days; D- 1 days.
Despite this, an increase in autofluorescence with increasing concentration of tetracycline solution in which the larvae were immersed was observed (Fig. 5). Only the samples that came from treatment group with a T400 mg.L-1 did not display any signs of fluorescence. However, no sample showed signs of a distinct tetracycline marking and many preparations did not show a satisfactory contrast with the background.
Fig. 5: Photographs of otoliths from L. purpurea larvae, using a fluorescence microscope with the WU filter. All
larvae were immersed in tetracycline solutions of different concentrations, for a time period of 30 minutes. The
different concentrations were: A- 600 mg.L-1; B- 800 mg.L-1; C- 1000 mg.L-1; D-1400 mg.L-1. Otoliths were extracted
from larvae with the following ages: A- 0 days; B- 0 days; C- 7 days; D- 11 days.
Similarly to what was verified for L. purpurea, there was a lot of autofluorescence in all samples of L. lepadogaster, regardless of the provenience of the otolith (treatment or control) (Figs 6 and 7). There were cases in which some marks were observed, but none had the minimum thickness (2 µm) to be ranked as a “true” tetracycline mark. However, as the solution’s concentration increased, so did the intensity of the otoliths fluorescence. This increase in brightness translated in an increase of contrast between the sample’s otoliths (see Fig. 7).
17
Fig. 6: Photographs of otoliths from L. lepadogaster larvae, using a fluorescence microscope with the WU filter. All
otoliths come from control group larvae, i.e. larvae that did not suffer immersion in a tetracycline solution. Otoliths A and B are examples of how the vast majority of control samples look like. Otoliths C and D appear to have a tetracycline marking around the edge of the otolith. Otoliths were extracted from larvae with the following ages: A- 0 days; B- 0 days; C- 20 days; D- 12 days.
Fig. 7: Photographs of otoliths from L. lepadogaster larvae, taken using a fluorescence microscope with the WU
filter. Otolith A came from a control group larva, and otoliths B through D came from larvae that were immersed in tetracycline solutions of different concentrations, for a time period of 30 minutes. The different concentrations
were: B- 600 mg.L-1; C- 800 mg.L-1; D- 1000 mg.L-1. Otoliths were extracted from larvae with the following ages: A- 0
days; B- 0 days; C- 7 days; D- 8 days.
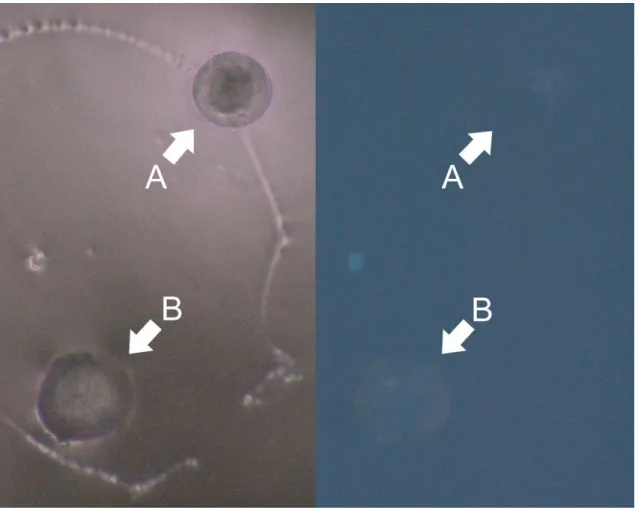
Figure 8 shows, in more detail, the comparison of a control otolith (A) and a treatment otolith, immersed for 30 minutes in a tetracycline solution of 600 mg.L-1 (B). As it can be seen, there is very little difference between the two otoliths.
18
Fig. 8: Photographs of otoliths from L. lepadogaster larvae, taken using a fluorescence microscope. The photo to the
left was taken using white light, and the one to the right was taken under fluorescence light with the WU filter. Otoliths marked with A came from a larvae belonging to a control group, and the otolith marked with B came from a
larvae that had been immersed in a 600 mg.L-1 tetracycline solution.
1.3. Classification of samples
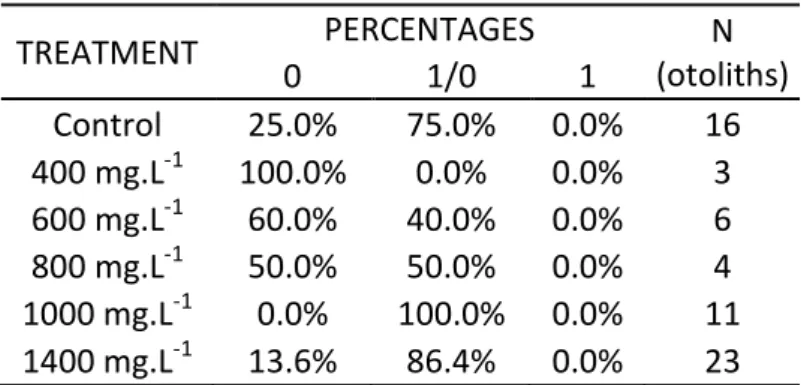
There were no L. purpurea otoliths showing a clear and obvious tetracycline mark (Table 2). There is a very high percentage of otoliths classified as 1/0 (“No Clear Marking” or “With Autofluorescence”), being the control, T1000 mg.L-1 and T1400 mg.L-1 groups the one with the higher percentages (75, 100 and 86,36%, respectively). The only group that showed no fluorescence whatsoever was the T400 mg.L-1 treatment group, with 0 otoliths ranked as 1/0 or 1.
19
Table 2: Result, in percentages, of classification of L. purpurea otoliths, where 0 is classified as “No fluorescence”;
1/0 as “No clear marking” or “With Autofluorescence”; and 1 as “Clear marking”.
TREATMENT PERCENTAGES N (otoliths) 0 1/0 1 Control 25.0% 75.0% 0.0% 16 400 mg.L-1 100.0% 0.0% 0.0% 3 600 mg.L-1 60.0% 40.0% 0.0% 6 800 mg.L-1 50.0% 50.0% 0.0% 4 1000 mg.L-1 0.0% 100.0% 0.0% 11 1400 mg.L-1 13.6% 86.4% 0.0% 23
From the otoliths classified as 1/0 (“No clear Marking” or “With Autofluorescence”), the otoliths with a possible tetracycline marking and their respective thickness are presented in Table 3.
Table 3: Thickness measures in µm of possible tetracycline markings in otoliths of L. purpurea larvae from the
different treatment groups and from the control groups.
L. purpurea
Treatment Nº of possibly tagged otoliths Average thickness (µm) Total otoliths % Control 2 0.61 16 12.5% 400 mg.L-1 0 - 3 0.0% 600 mg.L-1 0 - 6 0.0% 800 mg.L-1 0 - 4 0.0% 1000 mg.L-1 2 1.11 11 18.2% 1400 mg.L-1 1 0.92 23 4.4%In order to ascertain if a statistically significant relation between the different thickness measures and the treatments a statistical analysis of variance was made. Seeing as these data do not have the necessary homocedasticity to apply a one-way ANOVA, a non-parametric Kruskal-Wallis test was applied. This test produced a p value of 0.2326. Being large that 0.05, this means the H0 is accepted, and that no significant
differences between the variances were detected.
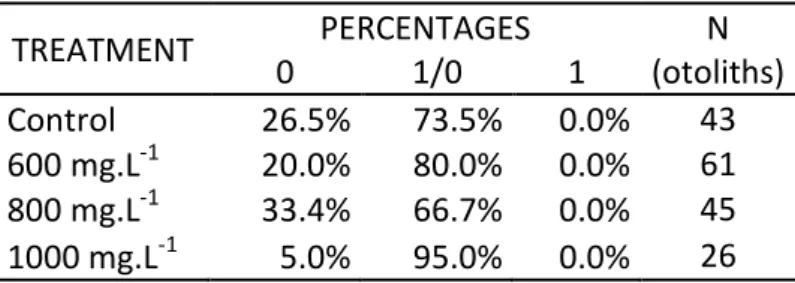
Similarly to the pattern observed for L. purpurea, there were no L. lepadogaster otoliths classified as having a clear and distinct fluorescent tetracycline marking (Table 4). The percentages of otoliths ranked as 0 and 1/0 in the control group are very similar to the ones observed in L. purpurea. The same applies to the other treatment, except for the T600 mg.L-1 group. While in L. purpurea the higher percentage of
20
otoliths from T600 mg.L-1 larvae did not display any fluorescence (and hence were ranked as 0), in L. lepadogaster most of the otoliths showed fluorescence, albeit not a true tetracycline marking.
Table 4: Result, in percentages, of classification of L. lepadogaster otoliths, where 0 is classified as “No
fluorescence”; 1/0 as “No clear marking” or “With Autofluorescence”; and 1 as “Clear marking”.
TREATMENT PERCENTAGES N (otoliths) 0 1/0 1 Control 26.5% 73.5% 0.0% 43 600 mg.L-1 20.0% 80.0% 0.0% 61 800 mg.L-1 33.4% 66.7% 0.0% 45 1000 mg.L-1 5.0% 95.0% 0.0% 26
As for L. lepadogaster, there were some otoliths classified as 1/0 (“No clear Marking”
or “With Autofluorescence”) that exhibited a possible tetracycline marking. The
thicknesses of these markings and their respective groups are presented in Table 5. Table 5: Thickness measures in µm of possible tetracycline markings in otoliths of L. lepadogaster larvae from the
different treatment groups and from the control groups.
L. lepadogaster
Treatment Nº of possibly tagged otoliths Average thickness (µm) Total otoliths % Control 7 1.06 43 16.3% 600 mg.L-1 2 1.03 61 3.3% 800 mg.L-1 4 1.44 45 8.9% 1000 mg.L-1 0 - 26 0.0%As these data fulfilled the necessary normality and homocedasticity assumptions, a one-way ANOVA variance analysis was performed. This analysis concluded that no statistically significant relation between the several treatment and control groups and the thickness of possible tetracycline fluorescent markings was present (F=2.8; p>0,05).
2. Mortality rates
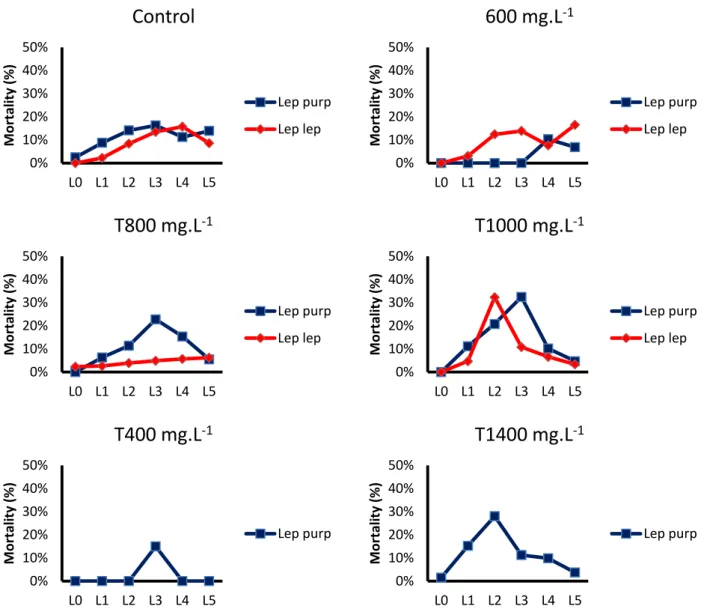
The effects of tetracycline concentration on the larvae’s survival rates in the first 5 days after hatching are shown in Fig. 9,
21
Fig. 9: Mortality rates up to 5 days post-hatching for Lepadogaster lepadogaster and Lepadogaster purpurea for each treatment.
There were no statistically significant effects of tetracycline tagging on the survival rates of L. purpurea (F=0.86; p>0.05) and L. lepadogaster (F=1.34; p>0.05) larvae up to 5 days post-hatching.
It was not possible to determine mortality rates up to 10 days post-hatching for L.
purpurea since out of the 25 different treatment groups, only 5 of them had larvae
that survived till that age. On the other hand, L. lepadogaster had 10 out of 16 different groups with larvae that survived, at least, until 10 days post-hatching. Therefore, it was only possible to determine and analyze mortality rates up until 10 days post-hatching for L. lepadogaster.
0% 10% 20% 30% 40% 50% L0 L1 L2 L3 L4 L5 M o rtali ty (% )
Control
Lep purp Lep lep 0% 10% 20% 30% 40% 50% L0 L1 L2 L3 L4 L5 M o rtali ty (% )600 mg.L
-1 Lep purp Lep lep 0% 10% 20% 30% 40% 50% L0 L1 L2 L3 L4 L5 M o rtali ty (% )T800 mg.L
-1 Lep purp Lep lep 0% 10% 20% 30% 40% 50% L0 L1 L2 L3 L4 L5 M o rtali ty (% )T1000 mg.L
-1 Lep purp Lep lep 0% 10% 20% 30% 40% 50% L0 L1 L2 L3 L4 L5 M o rtali ty (% )T400 mg.L
-1 Lep purp 0% 10% 20% 30% 40% 50% L0 L1 L2 L3 L4 L5 M o rtali ty (% )T1400 mg.L
-1 Lep purp22
Results show that there were no statistically significant effects of the tetracycline tagging on mortality rates of L. lepadogaster larvae up to 10 days post-hatching (F=0.25; p>0,05).
23
Discussion
In the vast majority of studies using tetracycline tagging, the mark has been described as a fluorescent ring present in the daily increment correspondent to the day the tagging occurred (Schmitt, 1984; Tsukamoto, 1984; Dabrowski & Tsukamoto, 1986). However, the markings observed from this work’s samples did not match the descriptions. Most observed otoliths presented a homogeneous fluorescence spread throughout the whole otolith, without any conspicuous fluorescent rings. Many otoliths presented the core as being a little brighter than the rest of the structure; in some of them, the fluorescence was blurry; and in others the otolith structure appeared vividly. There have been many studies of validation or daily increment deposit rates on the otolith that use a tetracycline fluorescent marking in the otolith as reference. In this case, all resulting fluorescence marks were so blurry and indistinct, the number of daily increments occupied by the tetracycline marking was not possible to validate.
In tetracycline tagging studies, observations of autofluorescence of otoliths are frequent (Schmitt, 1984; Tsukamoto, 1985). These studies described the autofluorescence as a faint fluorescence around the edges and occasionally along cracks and the surface of the otolith. In this work, autofluorescence was observed, but in a much more obvious mode. Most otoliths (12 for L. purpurea and 26 for L.
lepadogaster) that were extracted from control group larvae (without treatment)
showed, unexpectedly, clear fluorescence. In most of these cases, the fluorescence observed in control otoliths was stronger and more noticeable than fluorescence in treatment otoliths (Figs. 4 and 6). This autofluorescence in control group otoliths could, in fact, be mistaken for a true tetracycline marking. Therefore, it was concluded that autofluorescence was present in most otoliths, independently of the treatment. Neither of the 30-minutes immersion treatments yielded positive results, i.e. no otoliths displayed a clear and distinct tetracycline fluorescent marking. However, there is a very high percentage of otoliths classified as 1/0 (“No Clear Marking” or”Autofluorescence”), which could either mean autofluorescence or a weak and indistinct tetracycline marking. Statistical analysis of the otoliths that had a possible, but not clear tetracycline marking confirms that there were no significant relations between the thicknesses found in these indistinct marks and the treatment groups they belonged to (see Table 6). This facts, adding to the high number of false positives found in the control groups (see Tables 3 and 4) indicates that 30-minutes immersions, independently of the concentration of the tetracycline solutions, do not produce reliable markings.
When comparing control group otoliths and treatment group otoliths, most of the times they are indistinguishable from one another due to strong presence of
24
autofluorescence in the untreated otoliths. This would result in an inability to indentify the marked recruits from the unmarked ones, at the time of recapture and quantification, leading to extremely erroneous estimations of the self recruitment of the target population.
When comparing the visual aspect of otoliths from larvae that were immersed in a 1000 mg.L-1 tetracycline solution for different periods of time (1, 2 and 15 hours), an increase in the quality of the fluorescent marking and in the contrast between the otolith and the surrounding medium could be verified. Through this visual analysis, it was possible to see that, up to 2 hours of immersion in a 1000 mg.L-1 tetracycline solution, otolith tagging is extremely difficult. However, as the immersion time increased from 2 to 15 hours, the quality and intensity of the fluorescence of the tetracycline marking increased, reaching a fluorescent intensity that even masked the autofluorescence, translating in a better contrast between the otolith and the background (see Fig. 3). This comparison of effectiveness between longer and shorter periods of immersion was not accomplished for L. lepadogaster, and therefore a positive control treatment for this species is lacking. Taken together, these results suggest that the key-factor in a successful tagging of fish larvae’s otoliths is not only the concentration of the tetracycline solution, but mainly the immersion time. In most of the studies that make use of tetracycline tagging of larvae’s otoliths, the immersion time is never inferior to a 1,5 -hour period (see table 10).
Table 6: List of various authors and immersion times and tetracycline solution concentrations used in their
respective studies. All studies targeted marine fish species.
Author(s) Immersion time(s) Concentration(s) used Schmitt, 1984 12 h 250 mg.L-1 Tsukamoto, 1985 1,5 - 48 h 0 - 2000 mg.L-1 Siegfried & Weinstein, 1989 24 h 400 mg.L-1 Reinert et al., 1998 6 - 8 h 350 - 400 mg.L-1 Welsford, 2003 24 h 200 mg.L-1 Jones et al., 2005 2 h 250 mg.L-1 Kingsford et al., 2011 24 h 375 mg.L-1
As can be seen in Table 10, most of the authors use a longer immersion period and solutions with lower concentrations than the one used in this study. Tsukamoto (1985), for example, tested a vast array of immersion times and different concentrated solutions. The shorter immersion, of 1,5-hour, did not yield any positive markings, having his results pointed that, for egg marking, the tetracycline tagging starts to be effective only from a 6-hour immersion in a 300 mg.L-1 solution. Jones et al. (2005), on the other hand, use a fairly short-time immersion with a low-concentrated solution
25
(2h, 250 mg.L-1). These apparently contradictory results may be attributed to differences in seawater temperature in which the immersion was made. Dabrowski & Tsukamoto (1985) study the possible effects that temperature may have in the incorporation of the tetracycline mark. They concluded that lower temperatures result in a much thinner tetracycline marking, suggesting that this may be related to the different metabolism and growth rates that larvae have at different temperatures. Being so, this difference in immersion times and concentration may come from the fact that while Tsukamoto (1985) worked with ayu fish (Plecoglossus altivelis) using water at 20°C, Jones et al. (2005) worked with the tropical panda clownfish (Amphiprion polymnus) in Papua New Guinea where sea surface temperature goes from 24 to 31°C. Vigliola (1997) also considers the possibility that salinity might affect tetracycline incorporation as well. He states that one hypothesis for the difference verified in the successfulness of this marking method between freshwater and marine fish was the chelating reaction that tetracycline has with the divalent cations of seawater. However, when the marking immersion was tried using a NaCl solution instead of seawater
-(1992). In their work, they successfully tagged coregonid larvae’s otoliths with an immersion time of only one hour. However, they came to the conclusion that, in order to have a clear marking, the minimum concentration needed was 1000 mg.L-1.
So it seems that, in order to have successful markings, one needs to have several variables in mind, such as the nature of the species (marine vs lacustrine) and water temperature. Finally, the necessary concentration of the tetracycline solution will highly depend of the immersion times that will be applied.
One of the goals of this study was to assess the successfulness and reliability of this methodology to tag otoliths of gobiesocidae larvae using an immersion time of only 30 minutes. This immersion time limit was established in order to proceed with the tetracycline marking of egg batches directly in the field during the low-tide period. According to the results, an immersion of at least 2 hours is necessary in order to produce a clear and distinct tetracycline marking in the larvae’s otoliths. Being so, it can be concluded that this tagging methodology is not the best suited for this study’s needs. However, seeing as the 2-hour immersion produces good and clear tetracycline fluorescent markings, an alteration in the methodology is possible. Instead of proceeding with the immersions only during the low-tide period, a two-hour immersion in tetracycline would be made, and the egg batches would be returned to their original location through scuba-diving. It’s not as practical as the orginal methodology, but it’s a good alternative.