Introduction
Nitrate is, after carbon, the quantitatively most important element for nutrition of microalgae, since it plays an impor-tant role on their lipid profile: decreases in the nitrogen sup-ply actually enhance synthesis of lipidic reserves by several species of microalgae [1]. Determination of nitrate is, there-fore, very important in physiological studies encompassing microalgae, and the development of rapid and precise meth-ods for its quantification is thus relevant.
Quantification of nitrate is usually complex, and involves multiple procedures required by many interfering species, including (but not limited to) nitrite, which is often present in microalgal broths and may be toxic to cells if it exists at high concentrations [1]. The reference method for determi-nation of low concentrations of nitrate in sea water when nitrite is present as interferent [2] is based on the conver-sion of nitrate to nitrite using a copper-cadmium column; the concentration of nitrite is then determined by the Griess-llos-vay reaction, which consists in the sequential reaction of the nitrite ion with two aromatic amines, leading to colour development that can be spectrophotometrically assayed in the visible range at 540 nm. Although this method can be applied for concentrations as low as 0.1 mg L−1 and up to 1 mg L−1, the low flow rates through the column that must be used in order to ensure total conversion of nitrate to nitrite and the large volume of sample that percolates the column make this method time-consuming and cumbersome. Alternative methods, such as the UV spectrophotometric determination [3], were developed in attempts to surpass the issue of slowness for a wider range of concentrations (0 to 7 mg L−1), but interference of nitrite could not be overcome.
In order to develop a method for accurate and rapid deter-mination of nitrate in saline cultivation media containing nitrite, in view of its use as broth for cultivation of microal-gae, two spectrophotometric methods: (i) sulphamic/per-chloric acid method [4] and (ii) sulphamic acid method [5], were tested with standard solutions of nitrate and nitrite ranging in concentration from 0.05 to 3.00 mg L−1. Both methods are based on assumption that the addition of such strong acids as perchloric or sulphamic acids can reduce nitrite to gaseous nitrogen, thus eliminating nitrite interfer-ence [5]; however, at relatively high nitrite concentrations, this assumption was not met.
To overcome the problem of interference by nitrite, an improved method based on the Griess-llosvay reaction and on the UV spectrophotometric method for nitrate determi-nation was investigated: the nitrite concentration is first determined by the Griess-llosvay reaction, as in the cad-mium-column reference method, and this value of absorp-tion is then subtracted from the total absorpabsorp-tion due to nitrate plus nitrite, using calibration curves prepared in advance. All experiments were performed using standard solutions that mimic sea water to ensure that the high salin-ity of the culture media required by microalgae is taken in consideration during the development of an analytical method specifically designed for studies encompassing marine aqueous cultures.
The accuracy of the improved method was tested via comparison with the reference cadmium column method for calculation of nitrate and nitrite concentrations in equimolar standards and in various samples of microalgae culture medium. To confirm the precision of the method, three stan-dard samples with different nitrate and nitrite concentrations were also repeatedly tested.
347
Rapid spectrophotometric determination of nitrates
and nitrites in marine aqueous culture media
A.P. Carvalho, L.A. Meireles and F.X. Malcata*
Escola Superior de Biotecnologia, Universidade Católica Portuguesa, Porto, Portugal
Abstract. The spectrophotometric determination of nitrate in sea water broths for cultivation of, say, microalgae is complicated by the frequent presence of nitrite. Two methods - sulphamic/perchloric acid method (also known as Cawse method) and sul-phamic acid method - both claimed to be able to eliminate nitrite interference, were tested using a set of standards, but statisti-cal treatment of the results proved their limitations in nitrate quantification. An improved method, based on former published methods for quantification of nitrite and coupled determination of nitrate and nitrite, was designed and tested. This improved method was compared with the reference method (based on use of a cadmium column) using several standards and biological samples of two culture media for microalgae, in different phases of their growth curve. The results thus obtained have demon-strated that there is no statistically significant difference between them at the 5% level. The precision of the method was tested by repeating determinations with three sets of standard mixtures containing nitrate and nitrite. The method proposed has advan-tages over conventional methods in reduced time of analysis, as well as high precision and accuracy, so it may be a good alter-native for determination of nitrite and nitrate in marine aqueous media.
Key words. Enriched sea water microalgae broth −nitrate quantification −nitrite quantification −spectrophotometry.
* Correspondence and reprints.
Materials and methods
Standard solutions
Standard solutions were prepared using analytical grade potassium nitrate and potassium nitrite (Merck, Germany). Sodium chloride (Merck) was added up to 3% (w v−1) to simulate saline microalgae cultivation media. Bideionized water was used for preparation of all solutions.
The solutions used to confirm the precision of the improved method were as follows: A) 0.10 mg L−1of nitrate and 0.50 mg L−1 of nitrite; B) 0.50 mg L−1of either nitrate and nitrite; and C) 0.50 mg L−1of nitrate and 0.10 mg L−1 of nitrite.
Biological samples
Samples of two different culture media often used for microalgae growth – GPM [6] and ASW [7] – following sev-eral incubation times (early and late exponential phase) were taken.
Classical methods
All tests were performed at least in duplicate, and absorbance was measured with a Shimadzu UV-1601 UV/Visible spectrophotometer (Japan) using quartz cells for 1-cm optical path.
Sulphamic/perchloric acid method:
Samples with a volume of 1.5 mL were added to 0.1 mL of 20% (v v−1) sulphamic acid (Merck) and vortex shaken, allowed to rest for 2 min and vortex shaken once again; 0.4 mL of 10% (w v−1) perchloric acid (Merck) was then added and the solution was again vortex shaken. Absorbance was read at 210 nm.
Sulphamic acid method:
The samples were diluted with 0.05 M sulphamic acid in the volumetric proportion 1:1 and absorbance was read at 220 nm.
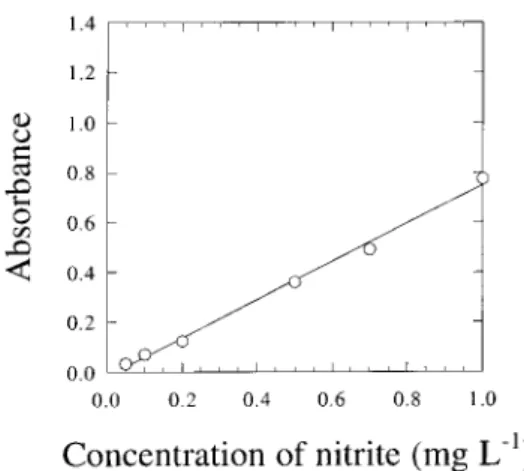
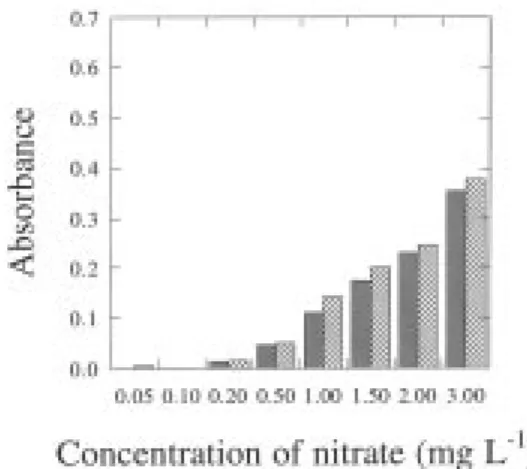
The reference method for nitrate determination in sea water involves its reduction to nitrite in the presence of a cadmium-copper active coating. The process is performed by pouring the samples into a glass column previously filled with cadmium-copper granules, and reduction occurs through the column. Since the reference method is recom-mended for use only with nitrate concentrations up to 1.0 mg L−1, the range of concentrations for the calibration curves was varied between 0.05 and 1.0 mg L−1; the bio-logical samples were diluted to as much as necessary and the efficiency of the column was tested, with typical yields in the range 80−95%. Calibration curves for nitrite at 540 nm, and both nitrate and nitrite at 220 nm are depicted in figures 1 and 2, respectively.
The cadmium column reference method and the UV-spec-trophotometric method were performed as previously described [2,3], without the organic matter elimination step of the UV spectrophotometric method (because all standard solutions used did not contain organic matter and the bio-logical samples were strongly diluted before analysis, thus minimizing such putative interfering effects). The cadmium
column used had a higher diameter than that described in the reference method, but the same height in terms of cad-mium-copper granules to ensure that the column efficiency was at least the same of that of the reference method.
Proposed method
Reagents:
Sulphanilamide solution: 5 g of sulphanilamide (Merck) were dissolved in a mixture of 50 mL concentrated HCl (Pronalab, Portugal) and 300 mL water, and it was diluted to 500 mL with water. This solution was stable for several months.
N-(1-naphthyl)-ethylenediamine (NED) solution: 500 mg of NED (Sigma) were dissolved in 500 mL of water. This solution was stable for about one month.
Ammonium chloride-EDTA solution: 13 g of ammonium chloride (Merck) and disodium ethylenediamine tetracetate
Fig. 1. Calibration curve described by equation A = – 0.0159
+ 0.766 C, where A is the absorbance of the standards (at 540 nm) and C is their nitrite concentration, for samples treated according to the cadmium column reference method.
Fig. 2. Calibration curves (at 220 nm) for standards of nitrate (●●) and nitrite (●), when treated according to the UV method, and described by equations A = – 0.00126 + 0.250 C and A = – 0.00760 + 0.0703 C, respectively, where A is absorbance and C is concentration.
(Merck) (1.7 g) were dissolved in 900 mL of water. The pH of this solution was adjusted to 8.5 by adding concentrated ammonium hydroxide (Merck) and the volume of the solu-tion was finally adjusted to 1 L.
Diluted ammonium chloride-EDTA solution: 300 mL of above solution was diluted to 500 mL with water.
1 M hydrochloric acid solution: 8.3 mL of 37% (w w−1) concentrated HCl (Pronalab) was diluted to 100 mL with water.
Procedure:
For nitrite determination by the Griess-Ilosvay reaction, 25 mL of each sample were diluted to 100 mL with diluted ammonium chloride-EDTA solution. For colour development and measurement of absorbance, 2 mL of sulphanilamide solution were added to 50 mL of the former solution, and 2 mL of NED solution were added, under stirring, after 5 min. Absorbance was measured at 540 nm after a reaction period lasting between 10 min and 2 h.
For total nitrate and nitrite determination, 1 mL of HCl solution was added to 50 mL of sample and mixed. Absorbance was then read at 220 nm.
Calibration curves for nitrate based on absorbance at 220 nm, and for nitrite based on absorbance at 220 and 540 nm, were generated with standards in the range 0.05 – 1.00 mg L−1. Values of nitrite concentration, obtained as described above, were then used to calculate the absorbance of nitrite at 220 nm. The nitrate absorbance was calculated via subtraction of the nitrite absorbance at 220 nm from the total absorbance at the same wavelength, and this value was then converted to nitrate concentration using the calibration curve obtained with the nitrate standards.
Statistical analyses
Unpaired Student’s t-tests within the dataset were performed using the software StatViewTM (from Abacus Concepts, Berkeley CA, USA).
Results and discussion
In order to quantitatively assay for nitrate in a sample when nitrite is present, one of two alternative routes ought to be followed: nitrite is removed from the sample or it is assayed in the sample itself. According to the first approach, and from a survey of literature concerning the elimination of nitrite, two methods were selected: (i) sulphamic/perchloric acid method, which uses both sulphamic and perchloric acids for nitrite elimination, followed by measurement of the remaining nitrate via absorbance at 210 nm, and (ii) the sul-phamic acid method, where nitrite is eliminated via the use of sulphamic acid, which promotes reduction of nitrite to gaseous nitrogen thus eliminating it from the sample, after which the remaining nitrate is quantified via absorbance at 220 nm. Two sets of experiments were then carried out, one with standards of nitrate and another with standards of equimolar solutions of nitrate and nitrite (mixed standards), using both these methods, with concentrations of each com-pound ranging in 0.05 – 3.0 mg L−1. The results produced are depicted in figures 3 and 4, for the sulphamic/perchlo-ric acid and the sulphamic acid methods, respectively. From
the absorbance values associated with the standard solutions of nitrate in the presence and absence of nitrite, as obtained by the sulphamic/perchloric acid method, it was apparent that both sulphamic and perchloric acids are not effective in eliminating nitrite from solution, since the absorbance of the mixed solutions was sometimes higher than that of the nitrate solutions as such; furthermore, absorption by nitrite is not even linear with concentration (results not shown). In order to determine whether the observed differences were statistically significant at the 5% level, an unpaired compar-ison was performed and has accordingly proven that the dif-ferences observed were indeed significant. With respect to the sulphamic acid method, elimination of nitrite occurred to approximately the same extent as that using the sul-phamic/perchloric acid method. In addition, the slope in the correlation between absorbance and nitrate concentration was rather low, which might pose problems with respect to analytical noise in the case of low nitrate concentrations.
Since either of these methods was unable to correctly pre-dict the concentration of nitrate in a sample also containing nitrite, a second approach was devised, viz. use of a poten-tiometric method [8], usually an easy and rapid protocol;
Fig. 3. Variation in absorbance (at 210 nm) of standards of nitrate
( ), and equimolar mixtures of nitrate and nitrite ( ), with con-centration, when treated according to the sulphamic/perchloric acid method.
Fig. 4. Variation in absorbance (at 220 nm) of standards of nitrate
( ), and equimolar mixtures of nitrate and nitrite ( ), with con-centration, when treated according to the sulphamic acid method.
however, it had to be discarded because chloride interfered with the linear response of the membrane electrodes. Finally, an improved method based on a mixed spectrophotometric determination was devised, with the goal of surpassing the problems associated with measurement of the amount of nitrate in solutions containing both chloride and nitrite. Nitrate has a peak of absorption at 220 nm, but nitrite also absorbs linearly at this wavelength. Therefore, an UV method, used for analyzing nitrate plus nitrite, was com-bined with another method, which enables analysis of nitrite. Our method involves three steps: (i) determination of nitrite by the Griess-Ilosvay method, using absorbance at 540 nm, (ii) determination of nitrite and nitrate by absorbance at 220 nm, and (iii) subtraction of the former value from the latter one to yield the amount of nitrate in solution.
The acidification of the samples with HCl, which occurs in the UV absorbance method, is executed to prevent inter-ferences by hydroxide or carbonate anions (but not by sodium chloride) during the spectrophotometric analysis, instead of eliminate nitrite; hence, for UV absorbance, nitrate and mixtures of nitrate and nitrite produce distinct curves, both possessing good linear correlation coefficients and relatively high slopes. When the calibration curve for absorption of nitrite at 220 nm was constructed, it was noticed that, for concentrations below 0.5 mg L−1, the con-tribution of nitrite for the absorbance of the sample was nil, in agreement with what was observed in the sulphamic/per-chloric acid and the sulphamic acid methods. Therefore, the calibration was only performed for concentration values between 0.5 and 1.0 mg L−1.
The improved method developed was compared with the reference method (cadmium reduction method) for precise determination of nitrate in sea water using equimolar stan-dards of nitrate and nitrite, as well as biological samples of microalgae culture broth. The average concentrations of nitrate for each equimolar standard, determined according to the reference and the improved methods, are plotted against the expected concentration values in figure 5. Since the nitrite concentrations are calculated in the same way in both methods, it is useless to compare them and they are thus not described. Comparison of the analytical results demonstrated that, at a significance level of 5%, there are no statistical dif-ferences between the reference method and the improved one. It is interesting to notice that the variance within repli-cates by the reference method is higher than that by the improved method, and also that the results obtained by the latter are more accurate than those obtained by the former method. These observations support claims by several groups that the reference method is prone to mistakes. The sole restriction to our improved method seems to be the lower sensitivity, since the 0.05 mg L−1concentration stan-dard could not be determined accurately by said method.
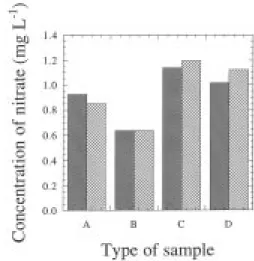
Nitrate concentrations in the biological samples deter-mined via the reference and the improved methods are depicted in figure 6. The four samples selected were obtained from GPM and ASW culture media, after inocula-tion with Pavlova lutheri, at early and late exponential stages, and hence characterized by substantially different concentrations of nitrate. Figure 6 indicates that there are no substantial differences in the results obtained by both meth-ods, a realization confirmed by the statistical analysis at a significance level of 5%.
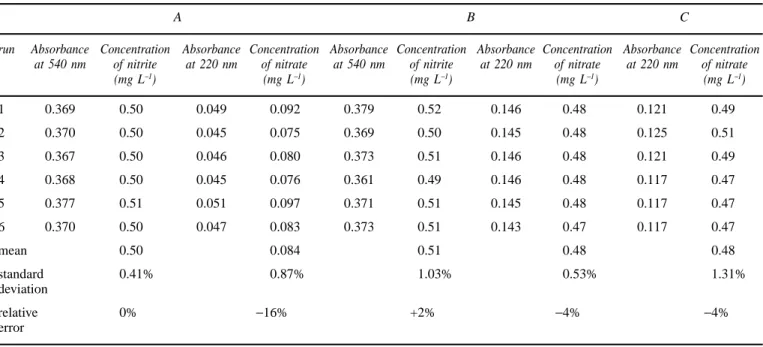
Finally, the precision of the results by the improved method was tested by performing the determination six times using three standard solutions containing different amounts of nitrate and nitrite: A, B and C. The results (mea-sured absorbance and final concentration) for both compo-nents are given in table I. Since the nitrite concentration in solution C is lower than 0.50 mg L−1, the absorbance of the solution measured at 220 nm is attributed to only nitrate. The standard deviation is low and always below 2%. Furthermore, the values for the nitrite and nitrate concentra-tions determined by the improved method are quite similar to the expected ones, with relative errors ranging from 2 to 16%. The error is higher for lower concentrations of nitrate.
Fig. 5. Expected concentration value (◆◆), and measured average concentrations of nitrate, when calculated according to the refer-ence method (●●) and the improved method (■■), for each equimo-lar standard of nitrate and nitrite.
Fig. 6. Variation in nitrate concentration for microalgae culture
samples treated according to the cadmium reference method ( ) and to the improved method ( ), for GPM media at early (A) and late (B) exponential incubation phases, and for ASW media at early (C) and late (D) incubation phases.
Conclusions
The reference method for determination of nitrate in marine aqueous media, e.g. those used for microalgal cultures, requires a cadmium-copper column when nitrites are pre-sent; the use of this column brings about several problems, viz. need for periodic regeneration, due to the presence of chloride anions, as well as presence of poisoning iron and copper soluble cations, always present in this kind of sam-ples. Furthermore, the method is time-consuming and cum-bersome. The improved method proposed here is a good alternative in terms of accuracy and precision, as well as time required for its performance. In addition, our method is not affected by the high concentrations of chloride, which are typical of sea water. Its major drawback is the impossi-bility to determine either nitrate/nitrite when their concen-trations are below the threshold of 0.05 mg L−1. Although relative errors observed at lower concentrations are consid-erable, recall that nitrate concentration in microalgal culture media is often relatively high. Therefore, the improved method can be used as an alternative for determination of nitrate and nitrite in marine media.
Acknowledgements
Financial support for author Carvalho (Ph.D. fellowship ref. BD/2838/93-IF, by PRAXIS XXI – Portugal) is hereby gratefully acknowledged.
References
1. Becker, E. W. Microalgae: Biotechnology and Microbiology, Cambridge University Press, Cambridge, Great Britain 1994, 3; pp 9-42.
2. Greenberg, A. E.; Clesceri, L. S.; Eaton, A. D. Standard Methods for the Examination of Water and Wastewater, American Public Health Association, Washington DC, USA, 1992, 18th edn, 418 C; pp 394-396.
3. Greenberg, A. E.; Clesceri, L. S.; Eaton, A. D. Standard Methods for the Examination of Water and Wastewater, American Public Health Association, Washington DC, USA, 1992, 18th edn, 418 A; pp 392-393.
4. Cawse, P. A. Analyst 1967, 92, 311-313.
5. Windholz, M.; Budavari, S.; Blumetti, R. F.; Otterbein, E. S. The Merck Index, Merck, Rahway NJ, USA, 1983, 10th edn; p 1279.
6. Anonymous, Microalgae Culture Collection – Solar Energy Research Institute, Golden CO, USA, 1986.
7. Borowitzka, M. A. Micro-Algal Biotechnology, Borowitzka, M. A.; Borowitzka, L. J. Eds., Cambridge University Press, Cambridge MA, USA, 1988; pp 456-465.
8. Greenberg, A. E.; Clesceri, L. S.; Eaton, A. D. Standard Methods for the Examination of Water and Wastewater, American Public Health Association, Washington DC, USA, 1992, 18th edn, 418 B; pp 393-394.
Table I. Determination of nitrate and nitrite in three different standard solutions by the improved method.
A B C
run Absorbance Concentration Absorbance Concentration Absorbance Concentration Absorbance Concentration Absorbance Concentration at 540 nm of nitrite at 220 nm of nitrate at 540 nm of nitrite at 220 nm of nitrate at 220 nm of nitrate
(mg L−1) (mg L−1) (mg L−1) (mg L−1) (mg L−1) 1 0.369 0.50 0.049 0.092 0.379 0.52 0.146 0.48 0.121 0.49 2 0.370 0.50 0.045 0.075 0.369 0.50 0.145 0.48 0.125 0.51 3 0.367 0.50 0.046 0.080 0.373 0.51 0.146 0.48 0.121 0.49 4 0.368 0.50 0.045 0.076 0.361 0.49 0.146 0.48 0.117 0.47 5 0.377 0.51 0.051 0.097 0.371 0.51 0.145 0.48 0.117 0.47 6 0.370 0.50 0.047 0.083 0.373 0.51 0.143 0.47 0.117 0.47 mean 0.50 0.084 0.51 0.48 0.48 standard 0.41% 0.87% 1.03% 0.53% 1.31% deviation relative 0% −16% +2% −4% −4% error