Characterization of DNS Usage Profiles
Joel Ferreira
Mestrado Integrado em Engenharia Informática e Computação Supervisor: Sérgio Nunes
Joel Ferreira
Mestrado Integrado em Engenharia Informática e Computação
Approved in oral examination by the committee:
Chair: Prof. dr. João Pedro Carvalho Leal Mendes Moreira External Examiner: Prof. dr. José Luís Guimarães Oliveira Supervisor: Prof. dr. Sérgio Sobral NunesOn the last few years it was possible to notice a sharp growth on the use of the Internet and also on its importance for the society. This growth was only possible due to the ability of the Internet to ease some tasks and to speed processes, but also because of the existence of some tools that made easy the navigation on the Internet. One of those tools is the Domain Name System (DNS), which allows the assignment of intuitive names to the Web pages and makes the correspondence of those names with the correspondent IP addresses.
With this growth, and according to the saying "if it is not on the Internet it doesn’t exist", may organizations started to use it for commercial activities. With the adoption of the Internet for this kind of activities, distance is no longer a market limitation and it enabled globalisation, since organizations are one click away from their customers, but also increased the number of competitors. With the increase of the market offer to customers, organizations felt the need of distinguish from their competitors in order to gain a competitive advantage. Theoretically it can be achieved in several ways, from a price reduction to the improvement of the quality of the product or serviced provided, however, this is not always possible. Another possibility of achieving a competitive advantage is with the improvement of the relation with customers.
When a user is surfing on the Internet, although without noticing, every time that he requests a Web site some records are created and stored on servers, like servers from the Web site or ISP. These navigational records, if properly analysed, may be the source of useful knowledge that may lead to the discovery of clients’ preferences and needs. With this information it is possible to im-prove the service provided, the relation between the organization and its customers, the business performance, and other aspects. This kind of studies involve the application of different method-ologies, from simple statistical analysis to more complex data mining techniques. Some fields of study already focus on the analysis of some types of navigational records, like the Query Log Analysis, which studies the queries made on search engines, or the Web Usage Mining, which analyses the navigation of the users on Web pages. However the analysis of DNS records is still a field scarcely explored, at least in relation to the number of published works.
On this work the DNS records made by the clients of the Internet service provided by SAPO were analysed. With them it was possible to make a characterization of those clients, according to the available information on the records. Some data mining techniques were also employed to discover association rules and sequential patterns among the domains requested by the clients.
Nos últimos anos foi possível assistir a um crescimento acentuado da utilização da Internet o que a tornou numa ferramenta praticamente indispensável para a sociedade. Este crescimento só foi possível porque a Internet, para além de ter a capacidade de simplificar tarefas e agilizar proces-sos, também tem ferramentas que tornam mais fácil a sua navegação. Uma destas ferramentas é o Domain Name System (DNS), que permite a atribuição de nomes às páginas Web e faz a correspondência entre esses nomes e os endereços IP respetivos.
Com este aumento de importância e utilização, e seguindo o lema “se não está na Internet é porque não existe”, muitas organizações passaram a utilizar esta plataforma para atividades com-erciais. Com a adoção da Internet para este tipo de atividades a distância deixou de ser um fator delimitador do mercado e permitiu a globalização, uma vez que as organizações passaram a estar a um clique de distância, o que aumentou, também, o número de concorrentes. Com o aumento da oferta para os clientes, tornou-se fundamental para as organizações distinguirem-se das de-mais, de modo a ganhar vantagens competitivas. Em teoria esta vantagem pode ser alcançada de várias formas, desde a redução de custos à melhoria da qualidade do produto transacionado ou serviço prestado, no entanto, isto nem sempre é possível. Resta às organizações distinguirem-se da concorrência através da melhoria da relação existente com os clientes.
Quando um utilizador está a navegar na Internet, apesar de não se aperceber, sempre que faz um pedido por uma página Web são criados vários registos, que são armazenados em vários servi-dores, como os servidores da própria página ou do ISP, por exemplo. Estes registos de navegação dos utilizadores caso sejam devidamente analisados podem levar à descoberta de conhecimento importante em relação às preferências e necessidades dos utilizadores. Com este tipo de infor-mação é possível melhorar o serviço prestado, a relação entre a organização e os seus clientes, a performance do negócio, entre outros aspetos. Este tipo de estudo envolve a aplicação de várias metodologias, desde simples análises estatísticas a técnicas de data mining mais complexas. Ex-istem algumas áreas de investigação que se dedicam à análise de certos tipos de registos, como o Query Log Analysis, que estuda as pesquisas feitas em motores de busca, ou o Web Usage Mining, que se dedica à análise da navegação feita em páginas Web. No entanto a análise aos registos DNS ainda é uma área pouco explorada, no que diz respeito a trabalhos publicados.
Neste trabalho foram analisados os registos DNS dos clientes do serviço de Internet do SAPO. Com estes registos foi possível fazer a caracterização dos clientes, de acordo com a informação disponível nos registos. Foram também aplicadas técnicas de data mining de modo a descobrir regras de associação e padrões sequenciais entre os domínios pedidos pelos clientes.
My special thanks to Prof. Sérgio Nunes for the precious insights provided but also for the chal-lenges posed during the different stages of this work. I want also to thank SAPO and FEUP, for the facilities provided for the realization of this study. Last but not least, I want to show my gratitude to my family and my friends for their support during the last five years.
1 Introduction 1
1.1 Context . . . 2
1.2 Structure . . . 3
2 DNS Usage Mining 5 2.1 Overview . . . 5
2.2 The Domain Name System . . . 5
2.3 Previous Work . . . 8
2.4 Query Log Analysis . . . 11
2.5 Web Usage Mining . . . 12
2.6 Stages . . . 13 2.6.1 Data Collection . . . 14 2.6.2 Data Preparation . . . 14 2.6.3 Data Analysis . . . 15 2.6.4 Post-Processing . . . 16 2.7 Challenges . . . 16 3 Data Analysis 19 3.1 Statistical Analysis . . . 20 3.2 Association Rules . . . 22 3.3 Sequential Patterns . . . 23 4 Methodology 29 4.1 Overview . . . 29 4.2 Dataset . . . 30 4.3 Dataset Preparation . . . 31
4.3.1 Preparation for the Discovery of Sequential Patterns . . . 32
4.3.2 Preparation for the Discovery of Association Rules . . . 36
5 Results 39 5.1 Characterization . . . 39 5.2 Association Rules . . . 50 5.3 Sequential Patterns . . . 59 6 Conclusions 65 6.1 Future Work . . . 67
A Number of Sequential Patterns 69
A.1 Media Requests . . . 69
A.1.1 MaxGap = 1 . . . 70
A.2 SAPO Requests . . . 70
A.2.1 MaxGap = 1 . . . 71
A.3 Social Networks Requests . . . 72
A.3.1 MaxGap = 1 . . . 73
B Number of Association Rules 75 B.1 Media Requests . . . 75
B.2 SAPO Requests . . . 76
B.3 Social Networks Requests . . . 76
B.4 Complete Log . . . 77
2.1 Example of the structure of the DNS tree [1]. . . 6
2.2 Scheme of the DNS resolution process [2]. . . 7
2.3 Request volume for one server before (left) and after (right) the application of the algorithm [3]. . . 11
3.1 Scheme of the generation of sequences with more that 2 elements [4]. . . 27
4.1 A sample of the dataset, before the preprocessing stage. . . 30
4.2 A sample from the file used to discover Sequential Patterns. . . 34
4.3 A sample from the file used to discover Association Rules. . . 36
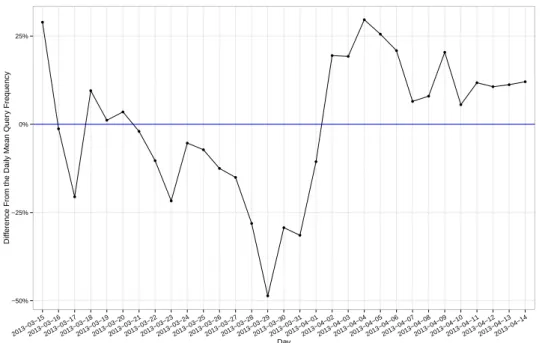
5.1 Difference between the number of requests of each day and the average number of daily requests. . . 40
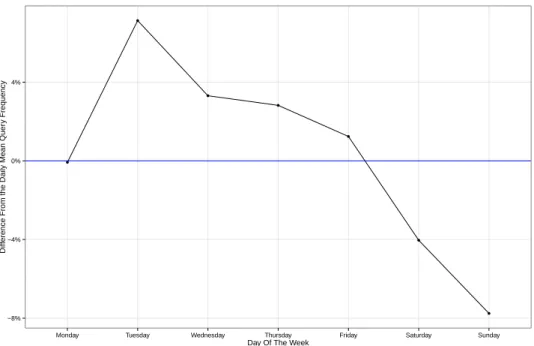
5.2 Difference between the number of requests per day of the week and the average number of daily requests. . . 41
5.3 Difference between the number of requests per hour and the average number of hourly requests. . . 41
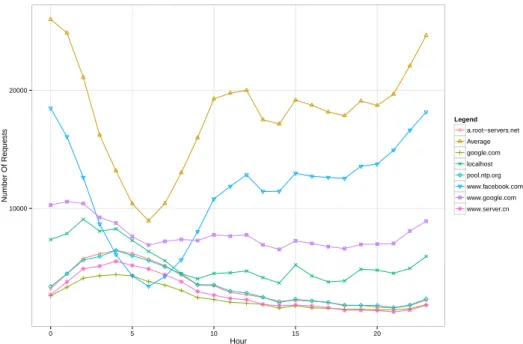
5.4 Evolution of the number of requests per hour. . . 42
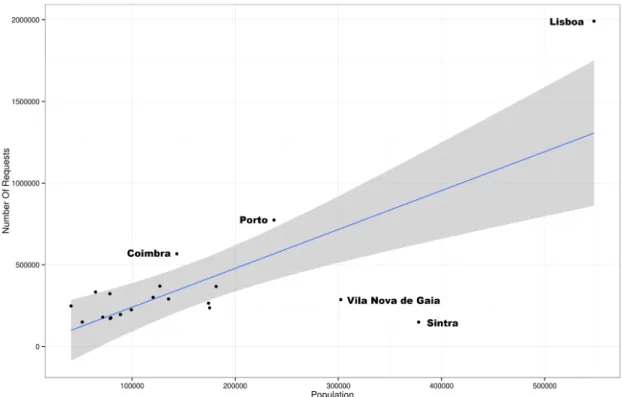
5.5 Correlation between requests and population of the 20 cities with more requests. . 45
5.6 Distribution of queries per IP, from 1 to 10. . . 46
5.7 Distribution of queries per IP, from 10 to 100. . . 46
5.8 Distribution of queries per FQDN, from 1 to 10. . . 48
5.9 Distribution of queries per FQDN, from 10 to 100. . . 48
5.10 Distribution of queries per FLD, from 1 to 10. . . 48
3.1 Levels of the Statistical Analysis. . . 21
3.2 Sequential Database. . . 26
3.3 Vertical Database. . . 26
3.4 Horizontal Database. . . 26
4.1 Domains used for the Media filter. . . 35
4.2 Number of different domains for each selection criteria. . . 36
4.3 Number of different domains for each selection criteria. . . 37
5.1 Basic Statistics. . . 39
5.2 Requests Per Type. . . 43
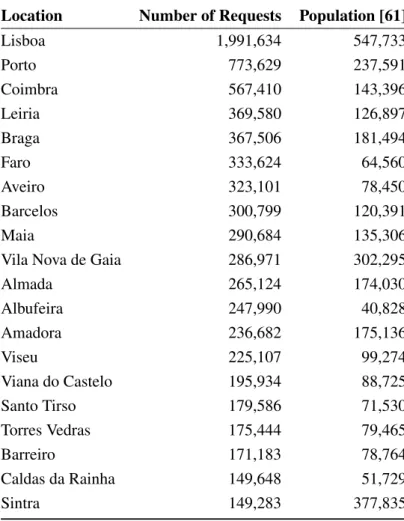
5.3 Requests and Population Per Location. . . 44
5.4 Deciles, Average and Median for the requests per FLD, FQDN and IP. . . 46
5.5 Characterization of the percentage of IPs with a minimum number of requests. . . 47
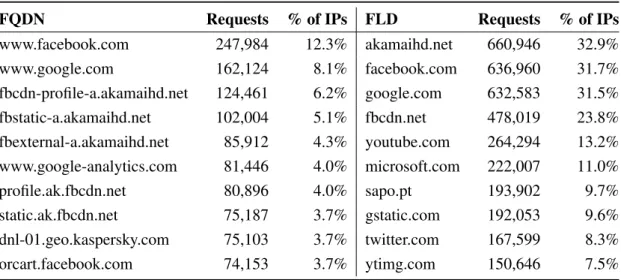
5.6 Top 10 requests for FQDN and FLD. . . 49
5.7 Top 10 requests for FQDN and FLD by Different IPs. . . 49
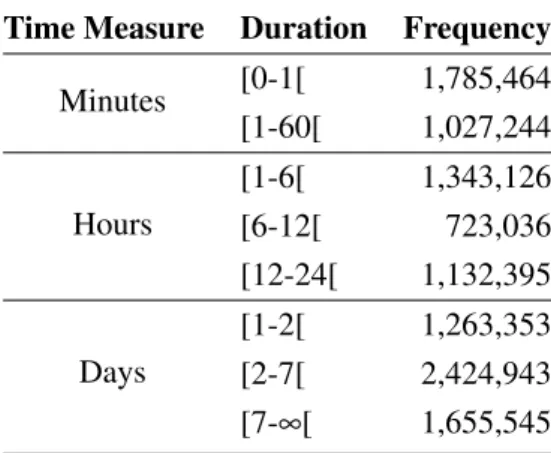
5.8 Distribution of time between consecutive requests. . . 50
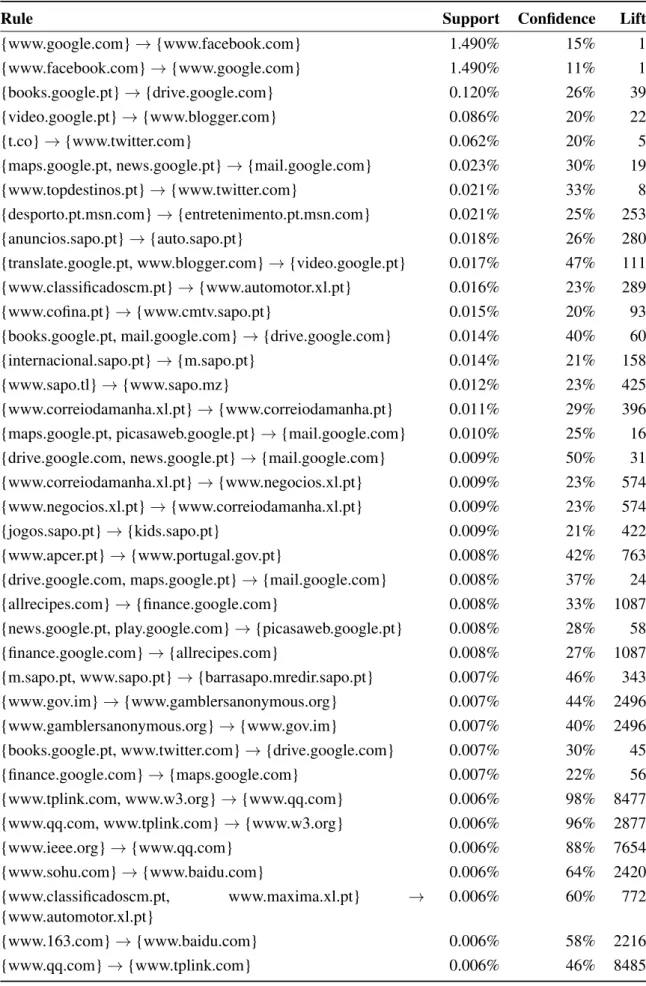
5.9 Sample of the association rules discovered on the complete dataset. . . 55
5.10 Sample of the association rules discovered on the Media dataset. . . 56
5.11 Sample of the association rules discovered on the SAPO dataset. . . 57
5.12 Sample of the association rules discovered on the Social Networks dataset. . . 58
5.13 Sample of the sequential patterns discovered on the Media dataset. . . 60
5.14 Sample of the sequential patterns discovered on the SAPO dataset. . . 61
5.15 Sample of the sequential patterns discovered on the Social Networks dataset. . . 62
A.1 Number of Sequential Patterns of Users with Media Requests - Full Query Domain Names. . . 69
A.2 Number of Sequential Patterns of Users with Media Requests - Second Level Do-mains. . . 69
A.3 Number of Sequential Patterns of Users with Media Requests - First Level Domains. 69 A.4 Number of Sequential Patterns of Users with Media Requests - Full Query Domain Names. . . 70
A.5 Number of Sequential Patterns of Users with Media Requests - Second Level Do-mains. . . 70
A.6 Number of Sequential Patterns of Users with Media Requests - First Level Domains. 70 A.7 Number of Sequential Patterns of Users with SAPO Requests - Full Query Domain Names. . . 70
A.8 Number of Sequential Patterns of Users with SAPO Requests - Second Level Do-mains. . . 71
A.9 Number of Sequential Patterns of Users with Media Requests - First Level Domains. 71 A.10 Number of Sequential Patterns of Users with SAPO Requests - Full Query Domain
Names. . . 71 A.11 Number of Sequential Patterns of Users with SAPO Requests - Second Level
Do-mains. . . 71 A.12 Number of Sequential Patterns of Users with SAPO Requests - First Level Domains. 72 A.13 Number of Sequential Patterns of Users with Social Networks Requests - Full
Query Domain Names. . . 72 A.14 Number of Sequential Patterns of Users with Social Networks Requests - Second
Level Domains. . . 72 A.15 Number of Sequential Patterns of Users with Social Networks Requests - First
Level Domains. . . 72 A.16 Number of Sequential Patterns of Users with Social Networks Requests - Full
Query Domain Names. . . 73 A.17 Number of Sequential Patterns of Users with Social Networks Requests - Second
Level Domains. . . 73 A.18 Number of Sequential Patterns of Users with Social Networks Requests - First
Level Domains. . . 73 B.1 Number of Association Rules of Users with Media Requests - Full Query Domain
Names. . . 75 B.2 Number of Association Rules of Users with Media Requests - Second Level
Do-mains. . . 75 B.3 Number of Association Rules of Users with Media Requests - First Level Domains. 75 B.4 Number of Association Rules of Users with SAPO Requests - Full Query Domain
Names. . . 76 B.5 Number of Association Rules of Users with SAPO Requests - Second Level
Do-mains. . . 76 B.6 Number of Association Rules of Users with Media Requests - First Level Domains. 76 B.7 Number of Association Rules of Users with Social Networks Requests - Full
Query Domain Names. . . 77 B.8 Number of Association Rules of Users with Social Networks Requests - Second
Level Domains. . . 77 B.9 Number of Association Rules of Users with Social Networks Requests - First
Level Domains. . . 77 B.10 Number of Association Rules on the Complete Log - Full Query Domain Names. 77 B.11 Number of Association Rules on the Complete Log - Second Level Domains. . . 78 B.12 Number of Association Rules on the Complete Log - First Level Domains. . . 78
DNS Domain Name System FLD First Level Domain
FQDN Fully Qualified Domain Name HTML HyperText Markup Language HTTP HyperText Transfer Protocol ISP Internet Service Provider IP Internet Protocol
IPv4 Internet Protocol version 4 IPv6 Internet Protocol version 6 OS Operating System
PT Portugal Telecom RFC Request For Comments
SAPO Serviço de Apontadores Portugueses Online SSH Secure Shell
TLD Top Level Domain TTL Time To Live
Introduction
In the last 15 years the Internet became an essential tool for most of the people and changed many established routines and procedures. This can be easily understood from the significant growth in the number of Web sites and visitors. The number of active Web sites in the end of 2012 was more than 140 million [5], and the number of users by June of 2012 was more than 2.4 thousand millions, which is approximately 34.3% of the world population [6]. Although a considerable part of the world does not have access to the Internet in regular basis, it is already the biggest collaborative repository of knowledge. This was only possible because of the numerous contributors that, explicitly or implicitly, made information available [7].
Although the process of requesting a page may look simple for most of the people, it involves many actions in the background. Since the Web sites are identified by the IP address and con-sidering that nobody, or almost anybody, knows the IP addresses of the pages that use to visit, it is necessary the interpretation of the name in order to the discover of the IP address. Only after retrieving the IP address it is possible for the browser to download the content of the page, which will be shown to the user. This mapping, between the names of the Web sites and their correspon-dent IP address, is made by the Domain Name System (DNS). The Domain Name System is a hierarchical naming system built on distributed databases for computers, services or any resource connected to the Internet or to a private network. DNS provides critical information for the oper-ation of most of the Internet applicoper-ations and services [8], since it transforms queries for domain names into IP addresses and can be seen as a bridge between users and network applications [9]. A typical analogy to explain the DNS is comparing it to a phone book, that relates names of people to its corresponding telephone number. However, unlike the phone book, the update of the DNS can be done quickly without drawbacks for the users. As a distributed system, the DNS delegates the responsibility of assigning and mapping a set of domain names to IP addresses to authoritative name servers, which can do the same with a subset. Each DNS request has a specific type, that can distinguish the types of resources that are required, for instance records of types A or AAAA refers, respectively, to an IPv4 or IPv6 address, while an MX record is related with the exchange of emails.
files and all their content, there is also some implicit knowledge that is generated automatically from the navigation of the user on the Internet. This data is represented on log files and, according to its nature may be used for different purposes. For example a log from a e-commerce Web site, may record the transactions made by the users to have a backup of the data and prevent hypothetical situations of data loss that could lead to failures of the service. However, the same log may be the source of of precious information about the preferences, interests and behaviour of groups of clients [10]. To acquire this knowledge, logs need to be properly analysed [11] with data mining and statistical techniques. These techniques, instead of looking for the behaviour of each user, consider the whole picture and try to detect patterns. When it comes to characterizing the navigation and behaviour of users, those patterns are called usage patterns. The discovery of these patterns can be very important for companies, and give them a competitive advantage over their competitors. The knowledge produced by the mining of Web logs can be used for various purposes: to create marketing strategies, and determine their effectiveness, to personalize the delivery of content, to enhance the performance of applications, to improve the customer’s satisfaction, and others [12]. However this process has also some difficulties. The discovery of patterns from log files is a data intensive problem, since a very large amount of data may be generated in a very short period of time [3].
The process of analysing a DNS query log looking for behavioural patterns of the users is called DNS Usage Mining. This is a process derived from Query Log Analysis, that studies the queries made on search engines, and Web Usage Mining, that aims to discover navigational patterns from the users’ navigational records. The DNS usage mining includes statistical analysis on the features of the log and the application of data mining techniques. Despite the existence of different types of data mining technique (association rules, sequential patterns, clustering and classification) the goals of the analysis are an important factor to chose the more suitable technique. As an example, while association rules are better for the discovery of co-occurrences, clustering is used to group objects according their levels of similarity. Although the analysis of the DNS logs is not common, according to the published work about the subject, it is possible to obtain benefits from it. From the characterization of the users it is possible to discover what are the days of the week, and the periods of the day, with more traffic. With this knowledge it is possible to optimize the resources in order to provide a service with good quality. With the knowledge about the domains that appear frequently on the same session and the most frequent sequences of domains may be used as the basis for a system that predicts the behaviour of the clients and pre-loads the page that is more likely to be required next. Other applications are also possible, like grouping users according their preferences and develop marketing strategies according to their preferences.
1.1
Context
Servidor de Apontadores Portugueses Online (SAPO) [13] is an affiliate company of the Portugal Telecom (PT) group [14]. SAPO is an Internet Service Provider (ISP) but is also a company that
provides services through the Internet, having also the biggest Portuguese Internet portal.
The scope of this dissertation is to analyse logs composed by DNS queries, made by clients of the Internet service provided by SAPO, and discover navigational patterns on them in order to characterize the users. The characterization of users is done with a statistical analysis to the features of the log, like the most popular queries, the periods of time with more activity, the average duration and number of queries of a session, and many others. From the application of data mining techniques it was possible to discover association rules and sequential patterns between queries, which gave information about the most common co-occurrences of domains on sessions and the most frequent sequences of requests, respectively.
1.2
Structure
After this introductory chapter, this document is organized as follows: in Chapter 2 the theory about the DNS and its operation is explained. The DNS Usage Mining topic is also introduced along with the explanation of the fields of study that are used as a reference and the description of the work done, so far, on the subject. Next, the stages of the analysis process (data collection, data preparation, data analysis and post processing) are described. The chapter ends with the presentation of some challenges, related with this type of study. In Chapter 3 the types of analysis chosen to be applied on the dataset (statistical analysis, association rule discovery and sequential patterns discovery) are introduced and described. In relation to the data mining techniques for this study, besides the previous work made on the subject, the algorithms used on the analysis are also explained. In Chapter 4 the main features of the dataset provided by SAPO are presented and the preparation tasks necessary for the different types of analysis are described. The results of the analysis are presented and discussed in Chapter 5. This chapter is subdivided in three sections, each one covering one type of analysis performed (statistical, association rules and sequential patterns). Finally, Chapter 6 contains a summary of the findings of this work and some proposals for future work.
DNS Usage Mining
2.1
Overview
The main goal of DNS Usage Mining is to discover and study patterns about the users’ navigational behaviour, in order to know more about them. With that knowledge, companies are able to define better strategies for their products or services, to personalize the contents for the users, to optimize the functionality of DNS applications or improve their security [9]. Despite the increase on amount of DNS usage data collected by ISPs, the study of this kind of logs is not very common and there are a very few published works about this specific type of analysis, when comparing with other types of usage analysis or the DNS protocol [9].
The DNS Usage Mining process includes the same four stages of Query Log Analysis and Web Usage Mining: data collection, data preparation, data analysis and post-processing. This is also a domain dependent process, since the most appropriate tasks for a problem may be different from others. It may also happen that a stage does not need to be performed, typically this is most likely to happen with the data collection stage [9].
While on other types of problems, related with the pattern discovery on a single Web site, it is possible to know the structure of the Web site and with that complete the users’ path [12], for studies that aim to discover and characterize the navigational patterns of users, over the Internet, it is not common to have the structure of the whole set of visited websites. This happens for two reasons, the first one is because Web site owners may not be willing to provide the structure of their websites, and it would be necessary use some crawlers to discover it, and the second reason is that if the goal of the analysis is the extraction of global navigational patterns, the structure of each Web site may be a unnecessary.
2.2
The Domain Name System
The Domain Name System (DNS), defined in RFC 1034 [15] and RFC 1035 [16], is a hierarchical, distributed database which translates domain names to the numerical IP addresses, necessary to locate computers and services on the Internet [17, 8]. The structure of the DNS database can be
seen as a tree, similar to Figure 2.1, and compared to a filesystem. The top of the tree, called root, manages the top level domains (TLD), which, manage their subdomains and so on. In DNS, the domain name is the sequence of labels, separated by dots, from a certain node to the root of the tree, and are always read on that direction. Similarly to a filesystem, where is possible to have a folder with files and other folders, in DNS it is also possible for a domain to contain both hosts and subdomains (i.e. google.com and maps.google.com). The only restriction is that there are no repeated names among the hosts and subdomains of a certain domain [18].
Figure 2.1: Example of the structure of the DNS tree [1].
The data associated with domain names is contained in resource records (RRs), that are the basic data element in DNS. Each record has a type, and a correspondent syntax, which reflects the intentions of the user. Some of the most common types of records are [19, 20]:
• A - Address record that translates a hostname to an IP address of 32 bits (IPv4 protocol). It is the most common DNS query performed [17];
• AAAA - Similar to an A record, but returns an address of 128 bits (IPv6 protocol);
• CNAME - Record that points to other domain name, unlike A or AAAA records that point to an address. After getting the response, a lookup is done to the new domain name. It may be useful if a user owns the domains foo.bar.pt and foo.bar.com instead of keeping the domain name’s records in sync with each other so they resolve the same IP address, he can create a CNAME record for foo.bar.pt that mimics the foo.bar.com records;
• MX - A record for mail exchange, which contains the information about the destination server;
• NS - A record that indicates the authoritative name servers of for a particular domain; • PTR - A record that translates an IP address to the correspondent canonical name (reverse
lookup). A PTR record is easily identified, since it is started with an IP address and followed by the the suffix .in-addr.arpa, for IPv4, or .ip6.arpa, for IPv6. Unlike CNAME records,
the lookup does not proceed when domain name is returned. These queries usually are used by network services like SSH and SMTP to validate connecting clients [17];
• SOA - A SOA (State of Authority) record is a way for the Administrator of the domain to give information about the it. It contains information about a domain, like the email of the Administrator, the domain serial number and others. A domain can contain only one SOA record;
• SRV - A record that for a known domain and service, finds the host name that provides the service. The host may be on the current domain, or in a subdomain;
• TXT - This type of record is used to get information about the domain. It is commonly used to define the Sender Policy Framework, which specify the email servers that are allowed to send mail for the domain;
Each DNS record has a time to live (TTL) field that works as a caching mechanism for the DNS. When someone requests the resolution for a certain domain the answer is stored while the TTL is above zero. Whit this, if other user asks for the resolution of the same domain (the type of the record must be also the same), the DNS instead of executing a lookup returns the stored answer [21].
The resolution 2.2 of a DNS query is done from the root nameserver to the lower levels of do-mains. Given the address of a root nameserver, it queries the address of address of the next author-itative nameserver. This process will be recursively performed through the tree, until the resolver reach the desired nameserver. For example, if a user wants to resolve the ’www.wikipedia.org’ domain the root nameserver would start to look for the ’org’ nameserver. Then, the ’wikipedia’ nameserver would do the same to find the host ’www’. When the desired host is found, the answer to the query is retrieved by the resolver and sent to the user [17].
2.3
Previous Work
Although there are not many publications about the subject, Wu et al. [9] used DNS queries to cre-ate a recommendation system and detect domains with malicious activities. For the experiments, the authors collected logs from a 48-hour period, composed by 150,000,000 queries (around 868 queries per second) that, after pre-processing, originated 12,000 transactions, which can be seen as a sequence pairs that have the domain name and its weight on the transaction1. The number of different domains of the dataset was over 700,000. Then, the collected data was randomly divided in two sets, which both cover a 24 hour period.
Clustering techniques were used to identify groups of users that have similar preferences and from that provide dynamic recommendations on DNS applications. With the clustering tech-niques, transactions can be grouped according their similarity. However, by themselves, those clusters are not enough to capture the aggregated view of common user patterns. Hence, the goal is to transform transaction clusters into weighted collections of domain names, named aggregate usage profiles. To do that it is used a method called Profile Aggregations based on Clustering Transactions (PACT) that considers the centroids of each transaction cluster and the significance, or weight, of domains in each transaction. Since the weight of domains may be calculated using different algorithms (i.e. the time spent on a page or the frequency of a page in a transaction, it is useful to normalize the weights) to a range of values from 0 to 1, in order to avoid misunderstand-ings and have a better idea of the actual relevance of a domain from a transaction. For the PACT method, domains with a normalized value below µ are not included, in order to avoid domains visited a few times to interfere with the pattern extraction.
A profile P, can be represented as a vector: ~P= (vd1, vd2, ..., vdn) where di is a domain, vdiis
the weight of the domain i in the profile P if di∈ P, otherwise vdi = 0. This vector can be used
directly as a predicative model to a recommendation system. A transaction made by a user can also be represented as a vector ~S = (s1, s2, ..., sn), where siis the weight of a query for the domain
di in the case of the user has queried for di, and si= 0, otherwise.
A recommendation involves a set of calculations that are done with the knowledge about a transaction and the existing profiles. In order to determine which names can be suggested, a recommendation score is calculated for each domain, which considers two factors: the similarity of the transaction to a profile and the weight of the domain in the profile. After this step, the recommendation set is obtained by selecting the recommendation scores that are above a minimum threshold.
On the experiment the authors used three different clustering techniques to create partitions of the user transactions: k-means algorithm, clique-based (or graph partitioning) clustering and clustering with self-organizing feature maps (SOFM), that allowed the comparison of the most effective techniques for the recommendation process.
1In the published work it is common to find different authors with different interpretations for the same term, some
authors do not have a distinction between user sessions and transactions, while others define a session as a group of one or more transactions, where each transaction is associated to the execution of an action, like buy a product.
The discovered clusters, and subsequent profiles, were evaluated with a metric named Average Visit Percentage. This method computes the probability of a user, that queried a name on the profile, queries the rest of the names in that profile, in the same transaction. Higher values imply a better quality of the clusters. It is stated that beyond 9 profiles the k-means algorithm performs better than the other algorithms but for less profiles the best option is the SOFM algorithm.
Given a sequence of queries, seq, a window, win, is used to produce recommendations, Rec. The effectiveness of the recommendation set, can be evaluated also with the notion of precision and coverage measures:
E f f ectiveness(Rec, seq) =2 × pre(Rec, seq) × cov(Rec, seq)
pre(Rec, seq) + cov(Rec, seq) (2.1) Precision is the degree of accurate recommendations are made, while coverage is the ability to produce recommendations to every domain that is likely to be queried by the user. The recom-mendation set is most effective when both values are maximized.
pre(Rec, seq) =| Rec ∩ (seq − win) |
| Rec | (2.2)
cov(Rec, seq) =| Rec ∩ (x − win) |
| seq − win | (2.3)
Like was said before, a domain is only recommended if its recommendation score is above a minimum threshold. To discover the most effective clustering algorithm for the recommendation the authors tested different threshold values, from 0.1 to 1, and different window sizes. It was pos-sible to find that the SOFM algorithm has a better performance that the other two, and it increases along with the change of the window size from 8 to 10, and the clique-based method has the worst performance. It was also possible to state that higher thresholds origin fewer recommendations, and higher coverage results are achieved if it has a lower value.
The second study of the same paper is about the detection of domains with malicious net-work activities like zombie netnet-work or phishing, that are difficult to identify. In the context of DNS query behaviour, each query is assumed to be created based on a set of hidden variables, also known as purposes, that are responsible to the page seen by the user. Since a user sends queries to more than one domain, it is reasonable to assume that each user is associated with many hidden variables. The Probabilistic Latent Semantic Analysis (PLSA), allows the discover of hid-den variables underlying the co-occurrences between two sets of items (in this case domains and transactions), with the use of Expectation Maximization algorithm to estimate the type of relation existing between the hidden variables and the two sets of objects.
The PLSA model can generate the probability of choosing a certain purpose, P(zk), the
proba-bility of observing a transaction given a certain purpose, P(ti| zk), and the probability of a domain
name being queried given a certain purpose, P(tj| zk). Applying Bayes’ rule to these probabilities
it is possible to compute the probability of a purpose given an observer transaction, P(zk | ti), or
as its primary purposes. After the purpose identification stage, a domain can be represented as: d= h(z1, P(z1| d)), (z2, P(z2| d)), ..., (zk, P(zk| d))i (2.4)
For examining the purposes of the domains present on the dataset, a Bayesian clustering al-gorithm is applied. For this method the number of clusters should be computed, each one corre-sponding to purpose of the domain names. The Akaike Information Criterion was chosen for this task and, after processing almost 40,000 domain names it stated the need of 38 clusters. After calculating the P(pur pose | name) it was possible to group domain names at a purpose level and, despite the lack of semantic knowledge the purposes could be easily identified by the content of the Web site. Besides that, domain names in the same cluster share the same dominant purpose, therefore only a small set of names need to be analysed.
In order to extract correct patterns from the DNS log data is important to guarantee that the whole set of records created due to the users’ activity is analysed. In the case of DNS Usage Mining, one of the problems that is frequently verified on the collected data is the existence of holes, that may happen due to the unavailability of the server or simply because the log data is not available for study. Although being possible to discover the origin of a hole in the log data, the completion of the log is not an easy task, since some methods, like interpolation, fail to preserve features of the DNS traffic. Snyder et al. [3] propose an approach that aims to ensure the quality of the log data, with the filling of holes on the collected data and the preservation of the traffic features, before the patterns analysis.
For this study the authors collected DNS logs from 26 servers over a 10 day period in January 2004. The raw data had a size of over 400 GB, that corresponded to around 1.5 GB of data gen-erated on each server, per day. It was possible for the authors to observe a statistical correlation between days and the traffic on DNS servers, while during the week the traffic volume is very similar, it drops sharply on weekends on every server. Giving this, the authors proposed an impu-tation mechanism that allowed the completion of the logs with this business knowledge, allowing the preservation of peaks and valleys on the traffic volume.
The algorithm to adjust the requests starts to count all traffic that each server received on each day and hour of the analysis period. Then it identifies the hours with complete data, the missing hours, and the ones that had partial data. On the third step days are ordered by its overall reliability (from the most complete to the days with more holes) and, finally, scaling factors are calculated to compute the adjusted traffic values for the missing periods. Figure 2.3 shows the evolution of the number of requests of a server during a day, before and after the application of the algorithm.
On this work the traffic was analysed either on the client and server perspectives. While on the client analysis they were studied according the traffic made by IPs, the server analysis considered the domain names. The client analysis is more challenging since there are 2.5 million clients, that theoretically may use any server, and only 26 servers. For this analysis clients were grouped according their traffic volume, and assigned to percentiles, each one representing 10% of the total volume requests (decile). It was possible to discover that the first decile, composed by 2,477,307
Figure 2.3: Request volume for one server before (left) and after (right) the application of the algorithm [3].
clients had the same volume of requests than the last one, composed by just 440 clients. From the server analysis it was possible to discover that the top three deciles have, each one, only one domain, while the tenth decile was composed by 3,044,001 domains.
2.4
Query Log Analysis
The process of extracting useful knowledge from search engine logs is called Query Log Analy-sis [22, 10, 11, 7] and is inspired by the purposes of Web Analytics and Web Usage Mining, to discover patterns and business intelligence from query logs. It is possible to apply several, and distinct, types of analysis. The goal of the analysis is useful to select the most useful processes and algorithms. A statistical analysis besides being one of the simplest processes is also one of the most used, while it can help the discovery of important variables, like the popularity of queries, the distance between its repetition, the average number of queries made by a user, the time of the day where queries are more frequent, and so on. Keeping a statistical analysis over time may also help the discovery of trends and changes on users’ habits. A deeper study over users’ pref-erences may be done to provide personalized content to them, either to groups of users or single users. If the systems knows the preferences of a user and its behaviour it can help completing queries, suggesting similar content and those preferences may be used to advertise related prod-ucts. The knowledge of the preferences and behaviour of users may also help the improvement of the system’s performance, with the use of caching mechanisms, to decrease waiting times, and the availability of more resources during peaks of utilization [22, 10].
The inspection and interpretation of user interaction may have different goals from company to company, however those goals have a common point, understand users’ needs and improve the service provided to them in order to build a stronger relationship.
Despite the stronger focus on queries made on search engines, this process can also be applied to logs with other types of queries. Although the nature of the logs is not the same the goals are similar, making possible the adaptation of the techniques used in other scenarios.
Silvestri [22] proposes an enhancement to the search systems’ effectiveness with methods of query expansion and query suggestion, resultant from the study of the most common queries made on the system. But, if the system knows what are the general preferences of a user, or a group of
users, it can try to predict the next queries, and improve the performance of the search engine. On the same work, Silvestri proposes also a caching mechanism and querying distributed system, in order to avoid overloads, to achieve a better performance.
The construction of graphs from the content of logs is also a possible application for the Query Log Analysis process [10], where each query made corresponds to a node on the graph and the edges, connecting a query qi to qj, correspond to the probability of the first node precede the
last one. From the graph analysis it is possible to relate similar searches, and find sequences of searches, from a general term to a more refined one, made by users.
With queries from search engines it is also possible to perform semantic analysis in order to relate keywords and determine the similarity of different searches, using semantic distance functions and a clustering algorithm. With this analysis is possible for the service providers to identify trends but also to provide a better service, because they are able to identify pages with keywords that are different from the ones on the query but have a similar meaning [11].
2.5
Web Usage Mining
Web Usage Mining refers to the automatic discovery and analysis of user access patterns in usage data, collected or generated as a result of user interactions with Web resources on one or more Web sites and servers [23, 24, 25], using data mining techniques or machine learning techniques [26]. The goal of this process is to capture, model, and analyse the behavioral patterns and profiles of users interacting with one, or more, Web sites [23]. Although the goal of a Web Usage Mining is the extraction of usage patterns, it is not confined to the data analysis process, it also includes data collection, data preparation and data post-processing tasks, similar to the ones addressed on Section 2.6.
According to the goals of the study, different types of algorithms are available to be applied to the pre-processed data, keeping in mind that each one of them is more suitable for certain situations [27], i.e. if the analyst wants to know what is the most common sequence of pages visited he should look for sequential patterns, but if he wants to group users, he may use clustering or classification algorithms.
The analysis of usage data has many benefits for the organizations’ business, either in a direct or indirect way. Direct benefits are related with the knowledge about the lifetime of their cus-tomers, the possibility to create more effective marketing strategies, the evaluation of promotional campaigns, to provide personalized content and recommendations for users, to target advertise-ment to specific groups of users, among other things [24, 28, 23, 12, 29], and may raise the rev-enues and profits of organizations. Indirect benefits may be seen as a way to improve the quality of the service and can be achieved with a reorganization of the Web site, in order to improve its usability by changing its linking structure, or with the implementation of pre-fetching or caching mechanisms, to improve the performance of future accesses [23, 28, 30, 12].
Usually, studying data from short periods of time may not be enough for an effective, and reliable, pattern extraction because the navigation of users may be affected by trends or deviations from the usual behaviour [31].
Such as most Web sites are dynamic, since their content and structure evolves over time, the same can happen to the interests and navigational behaviour of users. Due to this reason it is important to keep track of the evolution of usage patterns, and make the Web Usage Mining an iterative process, in order to adapt to the users’ needs [26].
Although the DNS logs available for this work have less information that the ones that are typically used for Web Usage Mining, it is still possible to apply the algorithms of this process in order to find patterns over the DNS requests.
2.6
Stages
Before the extraction of knowledge from the query logs some tasks need to be done, either to enable the analysis or to improve its performance. This activity can be subdivided into three stages [32]:
• Data Collection - data that describes the user interaction with the system [33], on a specific period of time, is gathered in a log;
• Data Preparation - the raw data is pre-processed, cleaned and restructured, for analysis; • Data Analysis - prepared data is studied trying to find some meaningful knowledge; • Post-Processing - the discovered patterns are put in a for that is easily understandable for
humans.
This analysis, usually, deals with a huge number of queries from a specific time period and consequently it requires the use of efficient data structures and techniques for the analysis [22]. From the raw data collected some records or features may not be useful for the purposes of the analysis, some others may be ambiguous or corrupted [10] therefore keeping them would fade its performance and difficult the extraction of relevant knowledge. Considering this, a pre-processing stage is indispensable for achieving a successful log analysis [25].
A simple analysis can be the statistical study of the queries, that is the most common anal-ysis [11], to discover the popularity of the queries, the average time between two queries, and other measures [22]. Despite the value of this analysis, this is a limited study and the extracted knowledge is superficial. If the analyst wants to mine structured intelligence he needs to use other techniques, like the ones related with Web Usage Mining [34], that will be addressed later on this report.
However, from the extracted knowledge, some of it may not be relevant for the business and it can be discarded. Moreover the mined intelligence is not on a easily perceptible form, and it requires some effort to understand, consequently it need to be rearranged with the help of data visualization tools [35].
2.6.1 Data Collection
Before the analysis of the navigational behaviour of users it is necessary to gather a set of relevant data, from a selected time period in order to provide useful information about users’ behaviour [35]. However this data collection should not interfere with users nor influence them, like ob-servation does, to avoid deviations from the normal navigation patterns that would lead to the discovery of knowledge that is not related with the reality [32].
An effective way to avoid influences on users is to use automated mechanisms, like logs or cookies, to collect data. As these mechanisms are transparent for users they tend to "forget" that their activity is being monitored so, consequently their navigation will not be influenced [23, 35]. Each query creates a relevant piece of information that can be collected from DNS servers.
Servers are the most common sources of data for usage mining studies, since a wide and diverse dataset can be collected from a single place with an easy and transparent process, unlike data collected directly from users [12]. There are different standards of logs, like the Common Log Format2or the Extended Log Format3. Even though these are not specific types of DNS log it is important to know that different servers may have logs with different structures and features. Typically a query log has recorded the query that was made, its id, the user that made the request and a timestamp but it may have some extra information like the location of the user. Although logs are widely used they should not be considered a reliable source of information, because of the existence of caching mechanisms on Web browsers that keeps copies of the requested that are shown to users if it is requested again within a defined period of time, and the possibility the ISP assign different IP addresses to the same user [35].
2.6.2 Data Preparation
Most of the time, the collected data is not in a proper state to be used for pattern extraction because records are not organized properly for this task, may have useless information, missing values or inconsistencies and information might be disperse in several files [35]. These characteristics, be-sides decreasing the performance of the knowledge extraction process also difficults the extraction of useful knowledge. The transformation of the raw dataset into a suitable one is a critical process for the successful extraction of useful knowledge and commonly the most time consuming step of the log analysis process [23].
This step is domain-dependent, it depends on the analysis’ goals and on the format and quality of data, and there is not a defined procedure that determines when a dataset is properly prepared, it is up to the analyst to decide having in mind that an insufficient execution will make the extrac-tion of meaningful knowledge more difficult and an extreme pre-processing may remove useful information and make impossible the extraction of meaningful information [35].
A preparation process may involve data cleaning, user identification, session identification and data integration tasks. However due to the nature of the logs available for this work, composed
2http://www.w3.org/Daemon/User/Config/Logging.html
solely by DNS requests, some of these tasks, like user identification, are harder while others, such as data integration, might not be necessary. This happens because IP addresses, by themselves are not sufficient for mapping log entries onto the set of unique visitors [23]. From the current structure of records that will be available for this work, described on Section 4.2, only the IP Hash is a useful feature to identify users. The presence of other features on each record, like the user’s location or OS, would be a precious help for this task.
Data cleaning consists on the removal of irrelevant data that is not helpful to discover patterns from users and may be the cause of a performance loss [35, 28]. Records may have some features that are not important for the analysis purposes, but some of them may also be completely mean-ingless due to the type of request that is made, like a query for the signature of the website, or its origin, such as records created because of crawler activity [23, 35]. While a filtering according the type of DNS request is possible, the detection of crawler navigation may be harder to perform because logs might not record if a request is made by a human or a crawler. When the origin of records is not specified, some algorithms that consider the nature of crawlers can be applied. When on a Web page, a crawler detects the existing links and requests all of them, doing the same in all of the requested pages. This breadth-first searching nature is exploited by Tan and Kumar [36] when trying to detect crawler navigation.
The identification of users is another difficult process with the available information. A naive approach is to assume that a user corresponds to an IP address [23, 35], however this is not an accurate approach since the ISP may assign the same IP address to different users over time. A better solution would need the location of users to identify users from their IP address and current locations, however it is still not perfect because the same machine can be used from different persons in a short time period.
Although the identification of users being limited for DNS logs, sessions can be identified using time-based or structure based heuristics if temporal or contextual information is available. Time-based heuristics consist on grouping on the same session pages that are requested by the same user within a time period, while structure-based heuristics use information about the Web site structure, that is not available on DNS requests, to build sessions [23]. In this stage the assembled information may not match with the real navigation, due to browser caching.
In some studies, in order to discover patterns more effectively, it is needed to integrate data from different sources. It might happen due to various reasons, however the goal of this integration is always the same, to have more data about each user and to be able to extract more detailed and complex knowledge [23].
2.6.3 Data Analysis
As there are only a few works on the DNS Usage Mining context it is not a defined guide to characterize its users, but it is possible to use some of the most common analysis procedures of the related areas. For this reason data mining techniques and statistical analysis may be employed to DNS Usage Mining.
From Query Log Analysis it is possible to adapt statistical analysis to the DNS queries made by the users in two different levels: query level and session level [32]. A DNS query is a request for a domain and, a set of domains requested on a certain time period, by the same user, compose a session. On the query level analysis it is possible to discover what are the most popular domains, the first query made by a user, the queries that are repeated and those who are requested only once, the periods of time with more requests, among other things. The session level analysis can help the discovery of the average time of sessions and queries made on each one.
From the Web Usage Mining it is possible to apply data mining techniques that allow the discovery of relations between the occurrence of queries and group similar items, users or queries. The application of Web Usage Mining techniques is a source of business intelligence that may be used to have a stronger presence on the market, personalize content to users and improve the performance of applications.
The techniques that may be used to perform the analysis will be further explained on Chapter 3.
2.6.4 Post-Processing
After analysing the data, the analyst gets knowledge about the collected data, but the discovery of that knowledge may not be the end of the DNS Usage Mining process. From the discovered knowledge, some may not be relevant for the goals of the study, and it is usually represented on a form that is not easily understandable by humans [35]. In order to provide a better understanding of the results, the extracted knowledge should be used as an input to visualization tools to generate visual models of it [27]. Graphics, tables, diagrams or infographics are some of the most used models to represent information and, as information may be represented using different models, there are also situation where a model is more suitable that others. Data visualization tools may be software application, that only requires the input of data and the choice of the visualization model, or libraries for some programming languages.
2.7
Challenges
Over the years the collection and analysis of log data, enabled the discovery about users’ needs and allowed the improvement of systems to fulfil those needs. However this knowledge has some costs, and some users may be giving away, without their knowledge, some personal information to make possible this analysis. Information about users is valuable for some companies and its collection rises some concerns about their usage and sharing [37]. Although service providers want to keep that information private and use it only for the analysis purposes, they cannot guarantee that a fail or a bad decision affect its privacy, like it happened to AOL when they made available more that 20 million search queries from more that 650,000 users. Despite of the user names being replaced by numbers some queries allowed the identification of some of them [22].
Comparing with other types of log analysis, like Web Usage Mining, the knowledge that, potentially, can be discovered is very low because of the nature of the log and the information that
is available on it. While logs of interactions capture every clickstream activity and may contain several informations about the user’s OS and browser, IP address, location, the requested and previous pages and other informations, a record from a query logs may contain only the request, the IP address and its timestamp. Although this information allows a study, its potential will be reduced and it may be an harder task to extract useful relations from it [37, 10].
When doing a log analysis the scale factor has a huge impact. Although a single record has only a few bytes, the server may be recording thousands of records per second which, after a day, has a considerable size and it might be an obstacle for a good behavioral study. To perform an effective study on the behaviour and preferences of the users it is important to have a considerable time period, in order to have a strong and reliable support for the conclusions and decrease the influence of occasional visits on them. Often the ideal time period comprises several GB of data that consequently, require more resources for the analysis and they may not be available. With this limitation two approaches can be taken: consider a smaller time period in the study or don’t change the time and consider only parts of logs for the study, using data streams algorithms.
Data Analysis
When considering the data analysis stage, there is no golden rule or cookbook to apply. Depend-ing on the nature of the problem, there are several approaches that can be applied to the same situation[38]. However different approaches produce different types of results (i.e. while cluster-ing techniques group elements from the dataset sequential patterns techniques discover frequent transaction sequences) that are more suitable for certain types of problems. Considering this, the choice of the technique, or techniques, for the analysis must be done considering the ultimate goal of study.
Sometimes, before the analysis, the analyst may not be familiar with the dataset and not know exactly where to start the analysis. Hence, it is common that the first stage of the analysis has an exploratory context, where he tries to discover some statistical information to describe the dataset. In relation to the data mining techniques, as stated above, different types of data mining lead to different types of results. For the usage analysis there are four different types of data mining techniques: association rules, sequential patterns, clustering and classification. Association rules and sequential patterns are similar, since they both discover frequent co-occurrences of elements. However, while association rules look for co-occurrence of elements on the same transaction, sequential patterns look for them on different transactions and considers their order. An example for the application of these techniques may be a video club. While association rules would look for movies that are frequently rented together, sequential patterns look for movies that are frequently rented in a specific order. Clustering techniques allow to create groups of objects that are similar to each other at some extent, but different from objects of other groups[35]. This is useful if the analyst wants discover the different types of objects that exist on the dataset and/or study more deeply a specific group of objects. Finally, classification techniques are used to identify the distinguishing features of classes of objects, based on a set of training data[35]. On this context, the application of classification techniques could be used to predict the behaviour of SAPO’s clients.
For this work besides a descriptive statistical analysis two data mining techniques were applied to the dataset. Association Rules, with the use of the Apriori algorithm, and Sequential Patterns, with the application of the SPADE algorithm were, the chosen ones.
3.1
Statistical Analysis
The analysis of query logs is not only about the application of data mining techniques. The use of statistical methods is also a very common procedure on academic studies and commercial appli-cations [12]. Statistics may help to understand users and their preferences and be used to predict their behaviour in the future [3]. If statistics are kept and compared over time, it is also possible to see the evolution of the preferences of the users. There are two types of statistic analysis: descrip-tive statistics, which are used to describe and summarize the features of a dataset in a study, and inferential statistics, which aims to extract conclusions from the data and/or prove propositions.
The descriptive analysis may be done to the complete dataset but, in some cases, it is also common to only consider a sample for the analysis. A statistical analysis on a dataset has the advantage of reducing large amounts of data into simple summaries. The creation of graphics with the results is often associated with this analysis. Due to this process it is easier to have a better understanding about the main features of the dataset. However, despite the benefits of this type of analysis the way how the results are presented is very important in order to avoid their distortion by the people who read them. Descriptive statistics are distinguished from inferential statistics since the latter type tries to extract conclusions from the data and/or prove propositions.
A typical analysis may lead to the discovery of the most popular Web sites, the periods of the day with more requests made, the average time of sessions, and so on. Considering the nature of this study it is possible to characterize users in several domains, like session, domain, location or day. Table 3.1 has some of the types of statistical analysis that can be applied to DNS queries.
Besides the prediction of users’ behaviour in future sessions, that may be used to save some waiting time to users with caching and pre-fetching mechanisms, the statistical analysis may also be useful to achieve a better use of resources, i.e. if during the day period the traffic is twice the traffic during the night period, some servers may not be used during the night to save some resources.
Table 3.1: Levels of the Statistical Analysis.
General
Number of Requests
Number of Requests per Type Number of Requests per Day
Number of Unique Domains (FQDN and FLD) Number of Sessions/IPs
Number of Requests per Hour (total and average) Number of Locations
Number of Days
Average Number of Requests per Day Average Number of Requests per Week Day Number of Locations
Domain1
Number of Requests per Domain Number of Different Visitors Domain Frequency Distribution Average Number of Requests per Hour
Session/IP
Number of Requests Number of Locations per IP
Distribution of the Time Between Two Consecutive Requests Distribution of the Number of Requests per IP
Daily
Number of Requests
Number of Requests per Hour
Number of Requests per Domain, either FQDN and FLD
Evolution of the Number of Requests per hour, for the 10 domains with more requests
Location
Number of Requests
Average number of requests per hour Number of IPs from the Location Number of requests per Domain Number of visitors per Domain
Correlation of Population and the Number of Requests Daily Analysis, for the location
3.2
Association Rules
Association rules are probably the simplest data mining technique and, at the same time, one of the most used in the analysis of Web log data [12]. This technique is usually applied to databases of transactions where, for Web Data Mining purposes, each transaction consists on a set of vis-ited pages, that allows the discovery of unordered relations between queries according to their co-occurrence in user sessions [35, 28, 27]. In order to discover an association rule two pieces of information are needed: support, the frequency with which the items appear on the same trans-action, and confidence, the probability of Y being part of the transtrans-action, given X [35]. With the confidence value it is possible to in represent an association rule as "N% of the users who visit the page X also visit the page Y". As the confidence value may be misleading, since it ignores the support of the second part of the rule, the lift may also be used to classify association rules. Higher lift values are mean that the elements of the rule are not statistically independent and some relationship exists between them [39].
When two domains, A and B, are frequently associated on the same session two candidate rules are created, A → B and B → A. However not all rules appear on the final result, due to confidence restrictions. The association rule A → B may be interpreted as "when a client’s session contains the domain A, it is likely to contain the domain B". However if the domain B is present in many sessions where A is absent, it is possible that the rule B → A does not have the minimum support and is, consequently, excluded from the results
Before the execution of this procedure, the collected data needs to be prepared for it. The creation of transactions is a very important task for this. A transaction, which is composed by several elements, may be part of a user session but it is also possible that a single transaction composes the session. As association rules are unordered, the data cleaning stage is also important because besides the irrelevant information, timestamps and repeated requests can also be removed. The discovery of these associations may be seen as useful intelligence for the creation of effective marketing strategies [28] but also for the reorganization of the Web site in a more effective way [27]. Although the wide application of this technique, due to its simplicity, its application is limited on the prediction of interesting Web pages for users, primarily [35].
Although there are a large variety of algorithms to discover association rules, many of them are derived from the Apriori algorithm [40], either to adapt to other conditions or to improve its performance. The Apriori algorithm has two steps: the generation of the frequent itemsets (the ones whose support is above the minimum value, defined by the analyst), and the generation of the association rules, from the frequent itemsets, with a confidence above a certain value. The generation of frequent itemsets is based on a simple downward closure principle (or simply, apriori principle): if an itemset has minimum support, then every non-empty subset has minimum support. The algorithm starts with a scan of the database to find the set of all 1 sequence itemsets F1,
based on the minimum support. Then, if the frequent itemset is not empty the algorithm generates a candidate itemset Ck, otherwise the first stage of the algorithm ends and the last non-empty
with the joining of all pairs of frequent itemsets that only differ on the last element (i.e. the joining of the itemsets {A B} and {A C} results in the itemset {A B C}). However not all results from the joining stage are considered as candidates. If an element of a candidate itemset, Ck, has a subset
that is not frequent according to the downward closure property, in other words, it is not present on Fk−1, it is removed from Ck. After this, the database is scanned again to discover the support of
the remaining items of the candidate itemset. The ones with a value below the minimum threshold are excluded, and the result is used to discover a new candidate itemset.
The frequent itemsets give an insight about the items that appear on transactions more than a certain number of times. However, these are not association rules since that, at this stage, they do not have an associated confidence value. From each itemset is generated a set of all possible rules. As an example, for the itemset {A B C} the rules (A, B → C), (A,C → B) and (B,C → A)) are generated. From the candidate rules, the ones with a confidence value below the value defined by the user are discarded, while the others are returned to the user as the final result of the algorithm [23].
Agrawal and Srikant [41] compared the SETM, AIS, AprioriTid and Apriori algorithms in order to discover the most effective. Six datasets were analysed, with sizes comprehended from 2.4 MB to 8.4 MB, but with the same number of transactions. It was possible to state that SETM algorithm is the one with the worst performance (when compared to Apriori algorithm it can be up to 85 times longer) and in five out of six tests, the Apriori algorithm had the best performance, being beaten once by the AprioriTid.
Chen et al. [42] propose a new algorithm to extract frequent paths. After having the transac-tional database, two iterative algorithms can be used to process the maximal forward references and find the most common paths: the Algorithm on Full Scan or the Algorithm on Selective Scan. The first algorithm scans the database in order to apply a hash technique to generate candidate itemsets and pruning techniques to reduce the size of the database. The second approach also uses hashing and pruning techniques to reduce processing and I/O costs but, instead of scanning the whole database in every iteration to create the candidate k-references, uses the previous candidate sets for that. The authors compare both algorithms with their application to a 30 MB log, and it was stated that the Algorithm on Selective Scan achieved an improvement of the performance on the order of 30%.
3.3
Sequential Patterns
Sequential patterns are similar to association rules, since they are extracted from large amounts of sequential data, i.e. user sessions, using similar algorithms [12]. It is also possible to extract sequential patterns after the application of clustering techniques to the log data [43]. In fact, sequential patterns can be seen as an evolution of association rules, since they aim to discover frequent subsets among the whole dataset, but considering the element of time [35, 30, 12]. With the knowledge of timestamps of the events it is possible to discover if there exists any specific order among them [30], and it is useful for the recognition of navigational patterns [35]. Similarly
![Figure 2.1: Example of the structure of the DNS tree [1].](https://thumb-eu.123doks.com/thumbv2/123dok_br/15145491.1012292/24.892.216.629.327.562/figure-example-structure-dns-tree.webp)
![Figure 3.1: Scheme of the generation of sequences with more that 2 elements [4].](https://thumb-eu.123doks.com/thumbv2/123dok_br/15145491.1012292/45.892.195.755.130.563/figure-scheme-generation-sequences-elements.webp)