1 INTRODUCTION
The dynamic behaviour of small to medium span railway bridges for high speed traffic is still difficult to foresee during the design, since the influence of the non-structural environment and of the super-structure composed by rails, sleepers and ballast is not well known. This conditions the practical use of the norms, namely the eurocode 1 part 2, not only for the design of new structures but especially when existing bridges must be checked for increasing traffic speeds [1,3].
A number of such bridges in the track between Linz and Wels in Austria had to be reevalu-ated [6] in order to permit the increase of train speeds up to 200km/h in accordance with guide-lines shown in the ERRI report [2]. In a preliminary numerical evaluation very high vertical ac-celerations were computed for those structures using the software system RM2000, showing the need for better estimates of the natural frequencies and viscous damping. Resonance under train speeds between 200km/h and 240km/h led to maximum accelerations of up to 20 m/s2 in some cases.
An experimental program was therefore implemented, which included the measurement of the vertical accelerations at up to eight points under the bridge decks during normal railway op-eration and its modal identification based on those measurements. Two to four hours of con-tinuous data recording, depending on the structure under consideration, was considered to be sufficient for the dynamic identification. This included a number of at least ten train passages, which were considered to be the most important source of excitation for the modal identifica-tion.
In this way the first natural frequency and the corresponding modal damping could be esti-mated for all structures. For the more flexible structures, with longer spans, higher natural fre-quencies, mode shapes and damping could be obtained as well. In some cases measurements of
Vibration measurements on small to medium single-span railway
bridges
C. Rebelo
Civil Engineering Department, University of Coimbra, Portugal
L. Simões da Silva
Civil Engineering Department, University of Coimbra, Portugal
M. Pircher
Centre for Construction Technology & Research, University of Western Sydney, Australia
C. Rigueiro
Civil Engineering Department, Polytechnic Institute of Castelo Branco , Portugal
M. Heiden
TDV – Graz, Austria
ABSTRACT: Due to the need for increasing train speeds several existing small to medium span bridges in the track Linz-Wels (Austria) were re-evaluated. In a preliminary numerical calcula-tion, considering conservative values for the dynamic parameters, very high vertical accelera-tions were computed for some of those structures. An experimental program was thus carried out in order to get a better estimation for the dynamic behaviour of the bridges, concerning mainly the first vertical eigenfrequency and the corresponding viscous damping. The paper ports on the results of this experimental investigation and identifies some areas where further re-search is necessary.
the accelerations on the rails and in the ballast were also carried on, although those results are not presented here.
2 DESCRIPTION OF THE BRIDGES
2.1 Reinforced concrete frames
A set of four monolithic reinforced concrete frames with spans varying from 2.5 to 5.0 meters were measured. The corresponding geometrical characteristics are shown in Table 1 and Fig. 1. Bridge 2 is the only one of the ‘box’ type and is composed by two twin boxes laying side by side, one for each direction of railway traffic. The other bridges are of the ‘frame’ type and are composed by only one monolithic structure for both railway tracks.
Table 1 – Geometrical characteristics of the reinforced concrete frames according to the structural layout
Bridge Span L [m] Width B [m] Thickness dRF [m] Thickness dRR [m] Thickness dS [m] Structural Type 2 2.50 2x4.25 0.18 0.18 0.18 box 4 2.50 9.30 0.30 0.25 0.25 frame 5 5.00 9.0 0.40 0.38 0.40 frame 10 5.00 9.0 0.32 0.32 0.32 frame
(a) box type (b) frame type
Figure 1 – Structural layout of small span bridges
2.2 Single-span slabs
Another set of six bridges with spans varying from 5.75 meters to 23.5 meters have the common characteristic of being composed of single-span simple supported twin slabs, laying side by side, one for each track. The geometric characteristics are summarized in Fig. 2 and in Table 2.
The ballast depth has an average of 0.60 m, varying between 0.55 m and 0.65 m depending on the slab thickness, and spans over the entire width of the twin decks.
The structural layout of the prestressed concrete decks (Bridges 1, 3, 8 and 12) corresponds to one-span simply supported slab with slightly variable depth. In the case of Bridge 7 the simply supported slab is made of HEB360 steel bars filled with concrete. Bridge 11 is also simply sup-ported and made of reinforced concrete.
The support conditions, although defined generally as simple supports, are of two types. In bridges 1, 3, 8 and 12, the bearing supports, two at each extremity of the deck, are made of steel pots filled with rubber material and can be considered free to rotate. For the other structures no specific apparatus have been used and the slab lies directly on the top of the abutment.
There is no continuity of the slab over the supports to the abutments, except the one material-ized by the superstructure composed of ballast, sleepers and rails. It is also to emphasize the fact that in bridges 1, 3 and 8 the line of supports is not collinear when considering both decks, as il-lustrated in Figure 2-b, and that the line of supports in Bridge 12 is skew relatively to the axis of the bridge.
Table 2 – Geometrical characteristics of the slab-type bridges Bridge Span [m] Width [m] HL [m] H [m] HR [m] α αα α [º] Type 1 23.50 5.14 0.92 1.14 0.91 90º Prestressed 3 19.50 6.49 0.97 1.10 0.84 90º Prestressed 7 9.00 4.52 0.43 0.43 0.43 90º Mixed 8 21.00 4.23 1.05 1.15 1.05 90º Prestressed 11 5.75 4.44 0.40 0.40 0.40 90º Reinforced 12 11.44 4.54 0.7 0.90 0.70 63.9º Prestressed span width α=90° HL H HR
(a) Sinle-span slab (TW1 or TW2) (b) Plan view of the twin slabs Figure 2 – Structural layout of generic medium span bridges
3 MEASUREMENT PROCEDURES
3.1 Measurement layout
The main concern of the measurements was to identify the first eigenfrequency for which the respective eigenmode is characterized mainly by vertical deflections of the deck. Although for the slab-type bridges this corresponds to the lowest frequency, it would not be the same for the frame-type bridges, as it was already evidenced in the numerical models.
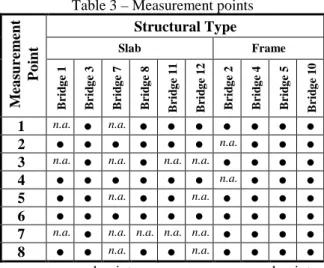
In that sense, for the frame structures, the vertical accelerations along the middle span line (Fig. 3-a) and the horizontal acceleration at about middle height of the vertical slabs were meas-ured. For the slab type structures, according to the expected eigenforms and to the symmetry conditions, only one half-side of each deck was instrumented (Fig. 3-b). Although a maximum of eight channels were available only a number of them were used to capture the vertical accel-erations of the deck at mid-span and at ¼ of the span (see Fig. 3-b and Table 3). In this case the remaining sensors were used to measure accelerations on the rails, in the ballast and under the twin deck.
The response data was acquired using the Brüel & Kjær PULSE® multi analyser platform and recorded for post processing [4]. In addition, the type of train, number of carriages and velocity measured with a speedometer were manually recorded [8].
MP1 MP2 MP3 MP4 MP5 MP6 MP7 MP8 w id t h BM span MP1 ½ span ¼ span MP2 MP3 MP4 MP5 MP6 MP7 MP8 w /2 w /4 w /4
(a) box/frame type (b) slab type Figure 3 – General scheme of the measurement locations
Table 3 – Measurement points Structural Type Slab Frame M ea su re m en t P o in t B ri d g e 1 B ri d g e 3 B ri d g e 7 B ri d g e 8 B ri d g e 1 1 B ri d g e 1 2 B ri d g e 2 B ri d g e 4 B ri d g e 5 B ri d g e 1 0 1 n.a. ● n.a. ● ● ● ● ● ● ● 2 ● ● ● ● ● ● n.a. ● ● ●
3 n.a. ● n.a. ● n.a. n.a. ● ● ● ●
4 ● ● ● ● ● ● n.a. ● ● ●
5 ● ● n.a. ● ● n.a. ● ● ● ●
6 ● ● ● ● ● ● ● ● ● ●
7 n.a. ● n.a. n.a. n.a. n.a. ● ● ● ●
8 ● ● n.a. ● ● n.a. ● ● ● ●
● measured point n.a. non measured point
3.2 Identification methods
Two methods were considered for the identification of eigenfrequencies, eigenforms and damping: (i) free vibration after train passages and (ii) natural ambient vibration between train passages. It was decided to capture and record the signal during enough time in order to obtain a significant number of at least ten train passages, corresponding to two to four hours of continu-ous signal recording.
The signal post processing consisted of two types of power spectra analyses. On the one hand the free vibration immediately after each train passage was collected for all trains and used to build the average spectra. Time histories with a fixed time length were considered, starting from the instant when each train leaves the bridge. Considering the longest eigenperiod expected for the structures, that time length should be enough for the free response to decay significantly.
Taking into account for each structure the entire sequence of all the time histories described above, it is possible to use a method for the parameter identification in the frequency domain such as the Peak Picking Method implemented in the software ARTeMIS®.
However, attention had to be paid to the effective time after which there is no more excitation on the bridge in order to prevent the distortion of the results and the erroneous identification of load harmonics. This was particularly sensitive in the case of the small span bridges, for which the free decay is quite short.
On the other hand, the ambient free vibration caused by unidentified natural excitation during the interval of train passages was collected and analyzed using the frequency domain decompo-sition method implemented in the referred software.
Although for the medium span bridges both procedures were able to identify the first natural frequency and damping, for the smaller bridges the measurement duration was not enough in order to allow for the natural ambient vibration to build significant spectral peaks. Besides that, the higher natural frequencies and modes could only be reliably identified for the medium span bridges.
As a complement, after the modal identification, selected measured responses during train passages were analyzed and compared with numerical results obtained for equivalent load sets crossing the bridge at about the same speed as it was registered for the respective train during the measurements (see [7,8]).
4 MEASUREMENT RESULTS
4.1 Free decay analysis
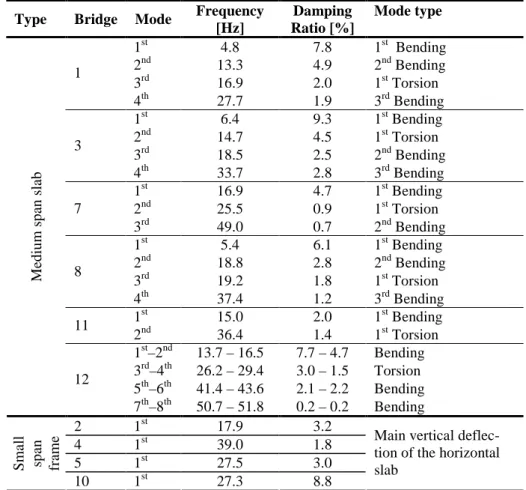
Examples of the modal identification in the frequency domain are show in Fig. 4 and the es-timated values for the eigenfrequencies and damping ratios resulting are summarized in Table 4.
During the identification process it was noticed that both the natural frequencies and the damping ratio varied according to the amplitude of vibration, that is, for the same structure sig-nificantly different values were obtained if time shifts of up to 1,5 seconds were introduced in the starting point of the time histories, maintaining the same total time length, when comparing with the original time histories defined in the paragraph above. This effect is most probably due to non-linear effects provided mainly by the track, ballast and supports.
When the modal parameters obtained from the time shifted response histories are compared with those from the non-shifted histories two tendencies can be recognized: (i) the frequency in-creases and (ii) the damping factor dein-creases. These results are more evident in the lower modes and must be, therefore, related to the amplitudes of vibration. In fact the higher amplitudes in the lower modes mobilize mechanisms of energy dissipation related to friction in the supports and internal friction in the ballast in a stronger way than they are mobilized in the higher modes, for which the amplitudes of vibration are much lower. This also stresses the idea that the friction forces, probably mainly inside the ballast, become more important for lower amplitudes having an effect of increasing the overall stiffness of the structure. Again, this effect is less important for the higher modes.
Table 4 –Eigenfrequencies and damping considering non-shifted time series
Type Bridge Mode Frequency
[Hz] Damping Ratio [%] Mode type 1st 4.8 7.8 1st Bending 2nd 13.3 4.9 2nd Bending 3rd 16.9 2.0 1st Torsion 1 4th 27.7 1.9 3rd Bending 1st 6.4 9.3 1st Bending 2nd 14.7 4.5 1st Torsion 3rd 18.5 2.5 2nd Bending 3 4th 33.7 2.8 3rd Bending 1st 16.9 4.7 1st Bending 2nd 25.5 0.9 1st Torsion 7 3rd 49.0 0.7 2nd Bending 1st 5.4 6.1 1st Bending 2nd 18.8 2.8 2nd Bending 3rd 19.2 1.8 1st Torsion 8 4th 37.4 1.2 3rd Bending 1st 15.0 2.0 1st Bending 11 2nd 36.4 1.4 1st Torsion 1st–2nd 13.7 – 16.5 7.7 – 4.7 Bending 3rd–4th 26.2 – 29.4 3.0 – 1.5 Torsion 5th–6th 41.4 – 43.6 2.1 – 2.2 Bending M ed iu m s p an s la b 12 7th–8th 50.7 – 51.8 0.2 – 0.2 Bending 2 1st 17.9 3.2 4 1st 39.0 1.8 5 1st 27.5 3.0 S m al l sp an fr am e 10 1st 27.3 8.8
Main vertical deflec-tion of the horizontal slab
The effect of coupling between both twin plates originated by the ballast was clearly identi-fied in Bridge 12, which is skew. The influence of the interaction between the plates is shown in the duplication of the frequency peaks(Fig. 4) corresponding to symmetrical and non-symmetrical shapes with reference to the contact plan between the plates. This effect allows the quantification of the ballast shear stiffness since this depends only on the frequency gap be-tween the peaks [5].
A consequence of this effect of coupling between the twin plates is the overestimation of the damping ratio when both frequency peaks are closer than the frequency resolution of the auto-spectra. This is probably the reason for the high first damping ratio measured in Bridges 1, 3
and 8 (see Table 4), whose line of bearing supports is not collinear (see Fig.2-b) inducing a skew type effect between the twin slabs.
d B | ( 1 .0 m /s ²) ² / H z Frequency [Hz] 0 20 40 60 -40 -30 -20 -10 0 10 20 d B | ( 1 .0 m /s ²) ² / H z Frequency [Hz] 0 20 40 60 -21 -14 -7 0 7 14 . Bridge 1 Bridge 7 d B | ( 1 .0 m /s ²) ² / H z Frequency [Hz] 0 20 40 60 -36 -27 -18 -9 0 9 d B | ( 1 .0 m /s ²) ² / H z Frequency [Hz] 0 20 40 60 -32 -24 -16 -8 0 8 Bridge 10 Bridge 12
Figure 4 – Peak Picking method applied to bridges 1, 7, 10 and 12 (Frequency Domain Decomposition - Peak Picking; Average of the Normalized Singular Values of Spectral Density Matrices of all Data Sets)
4.2 Ambient vibration
Ambient vibration methods are based on the assumption that all the dynamic excitation in the structure is of such a random type that all modes in the relevant frequency range are excited in the same way. Although this is not a typical problem for the application of such methods, the length of the time histories corresponding to the free vibration considered before can be ex-tended for several minutes, depending on the railway traffic, so that the effect of the free vibra-tion induced by the train passage is dimmed.
The results are summarized in Table 5. Because of the insufficient total measuring time and the fact that the maximum signal peak input had to be set up for the expected maximum accel-eration during the train passages, conditioning the goodness of the signal for low amplitudes, the results are limited to the first natural frequency and to the longer span bridges.
Table 5 – Eigenfrequencies and damping for Bridges 1, 3, 8 using ambient vibration
Bridge Mode Frequency [Hz] Damping Ratio [%] Mode type
1 1st 5.2 2.0 1st Bending
3 1st 8.6 1.9 1st Bending
8 1st 5.8 2.7 1st Bending
Comparing these results with those given in Table 4, the difference is to be found in the damping ratio, resulting from the ambient vibration much lower damping values, and in the ei-genfrequencies, which are higher then those given in Table 4. Both tendencies are in accordance with the explanation given above, concerning the probable influence of non-linear effects.
4.3 Response to train passages
The maximum acceleration measured during train passages is highly dependent on the fre-quency window used. Since the phenomenon under consideration is the risk of ballast desegre-gation in consequence of vibration, a frequency window of 0-25 Hz was used to investigate whether that limit was exceeded during the measurements.
For the dynamic structural identification the measured response to train passages is not of much use, unless a numerical structural model is fitted according to the identified modal charac-teristics and the numerical response to the real train is computed and compared with those meas-urements. This was done for several trains and bridges [7,8].
The comparison between the measured and the computed acceleration at the mid-span, shown in Fig. 5, concerns the passage of a locomotive over Bridge 1. Analysing the evolution of the time histories, it is obvious that, during the load application the initial part fits very well but the final part shows some differences. They are probably related to the interaction between train, superstructure and structure as shown e.g. in the UIC leaflet [10], which was not considered in the computations. With respect to the free vibration, the initial close correspondence between the two lines is lost because of a higher damping in the measured response than the one assumed in the computations, and because of the variation of the first natural frequency in the measured time series, as discussed above.
Figure 5 - Computed and measured response for Bridge 1.
5 CONCLUDING REMARKS
The main difficulty concerning dynamic measurements is usually the excitation. In the present case the vibration provided by the train passages could be used successfully. The resulting free vibration proved to be sufficient for the parameter identification methods to be applied.
The results show the existence of important non-linear effects, since the natural frequencies vary according to the amplitude of vibration, that is, growing amplitudes of the free vibration signal correspond to the decrease of the first natural frequency.
Damping factors are always difficult to be estimated exactly, since the sources for energy dis-sipation are various and different from the viscous type used in the theoretical formulation of the vibration problems. Particularly the damping due to friction between ballast particles and eventually the friction in the supports can play an important role in the type of structures under analysis. The tendency for the damping to increase with the vibration amplitude could be ob-served in the analysis. Also, the coupling effect between twin slabs developed through the bal-last was clearly identified in the skew bridge and is most probably the responsible for the high measured damping ratios in the first eigenmode of bridges 1, 3 and 8.
The contribution of the ballast to the overall dynamic behaviour of this type of bridges is not yet well known. Since the problem of excessive accelerations in railway bridge results, in many cases, from a resonance situation in one of the lower natural frequencies, a better understanding of the damping mechanisms could be very useful for a more precise evaluation of the dynamic response during the design.
AKNOWLEDGEMENTS
The authors would like to thank Austrian Railway Authorities ÖBB for the technical support and the facilities needed for the measurement setup, as well as Eng. Helena Gervásio from GI-PAC, Lisbon for the experimental support.
REFERENCES
[1] BUCKNALL, I. (2003) New Eurocode Requirements for the Design of High Speed
Railway Bridges, IABSE Symposium, Antwerp
[2] ERRI D 214/RP9 (1999) Rail bridges for speeds over 200Km/h, Final Report [3] prEN 1991- EUROCODE 1 – Part 2 (2002) Traffic loads on bridges, July 2002
(Conversion of ENV-1991-3 into 1991-2) (final draft)
[4] Rebelo, C. & Gervásio, H. (2004) Final report on the dynamic measurements and
system identification of plate and frame railway bridges between Linz and Wels, Austria, ACIV/GIPAC, Coimbra, Portugal
[5] Rebelo, C. Rigueiro, C., Simões da Silva, L. (2005) Modal Identification of
Single-span Railway Viaducts, 1st International Modal Analysis Conference - IOMAC, April 26-27, Copenhagen
[6] Rebelo, C. et al. (2005) Vibration measurements on existing single-span concrete
railway viaducts in Austria, EURODYN, 4-7 September, Paris
[7] Rigueiro, C. et al. (2005) Comportamento dinâmico de pontes ferroviárias com
pla-taforma balastrada, Congreso de Métodos Numéricos en Ingeniería, 4 a 7 de Julio,
Granada
[8] TDV-Austria (2004) Final Report of the Rolling Stock Investigations of Plate &
Frame Bridges between Linz and Wels , May 2004, Austria
[9] TDV. 2004. RM2004 – Software & Technical Description, Graz, Austria
[10] UIC leaflet: UIC 776-2R(2002) Design requirements for rail-bridges based on
in-teraction phenomena between train, track, bridge and in particular speed. (July
2002)
[11] Zacher, M. (2000) Dynamic of Railway Bridges, 5th ADAMS/Rail Users' Confer-ence Haarlem, The Netherlands
![Table 1 – Geometrical characteristics of the reinforced concrete frames according to the structural layout Bridge Span L [m] Width B [m] Thickness dRF [m] Thickness dRR [m] Thickness dS [m] Structural Type 2 2.50 2x4.25 0.18 0.18 0.18 box 4](https://thumb-eu.123doks.com/thumbv2/123dok_br/16096451.1107574/2.892.123.768.381.704/geometrical-characteristics-reinforced-structural-thickness-thickness-thickness-structural.webp)