I
Industry Differences in
Mergers and Acquisitions
M&A Performance and Synergies Assessment
Internship Report
presented to Catholic University of Portugal for the master degree in Business Economics
by
Ana Carolina Carvalho de Azevedo
Supervised by
Professor Paulo Alves and Ms. Cidália Santos
Católica Porto Business School May, 2016
II
III
A
CKNOWLEDGMENTS
I would like to acknowledge some people that have helped me to conclude the present dissertation throughout the semester.
First, I would like to express my gratitude to my supervisor, Professor Paulo Alves for his support and orientation.
Second, this project would not have been possible without PwC’s Portugal and the people in the M&A team help, especially to Ms. Cidália Santos. Thank you for providing me the databases needed and supporting me during the internship.
Finally, I am also thankful to my family and friends, with special attention to my parents and my boyfriend who have contributed dearly to this dissertation.
IV
V
“To know, is to know that you know nothing. That is the meaning of true knowledge.”
VI
VII
S
UMÁRIO
E
XECUTIVO
Apesar da já extensa pesquisa sobre as sinergias geradas e a performance pós-aquisição em atividades de M&A, não existem muitos estudos na literatura sobre as diferenças de performance entre indústrias e tipos de sinergia.
Este relatório, preparado em colaboração com a PricewaterhouseCoopers, durante um estágio curricular em Corporate Finance, no departamento de Fusões e Aquisições, tenta preencher esta lacuna existente na literatura e examinar assim três questões. Em primeiro lugar, perceber quais as indústrias que conseguem obter, de um modo geral, mais sinergias após uma aquisição. Em segundo lugar, são analisadas quais os tipos de sinergias que se destacam mais em cada indústria. E finalmente, em terceiro lugar, verificam-se quais as indústrias que têm o melhor desempenho em cada tipo de sinergia.
Deste modo, é apresentada uma nova abordagem na avaliação do desempenho das empresas, através da análise das medianas e taxas de crescimento do valor residual (diferença entre o valor real e o valor previsto). Usando indicadores contabilísticos pós-fusão como medidas de desempenho e proxies para sinergias operacionais, financeiras e fiscais, este ensaio conclui que a indústria de Transporte, Armazenagem e Serviços de Viagem é o setor, em geral, com o melhor desempenho, e que a eficiência fiscal é a sinergia com maior criação de valor entre os outros tipos de sinergias. Conclui-se também que nas sinergias operacionais de vendas e nas sinergias fiscais, o sector da construção apresenta-se como a indústria onde houve maior criação de valor e que nas sinergias financeiras, foi o setor de Serviços Imobiliários. Limitações sobre a dissertação e orientações para futuras pesquisas também são discutidas no final.
Palavras Chave: Fusões & Aquisições; Diferenças nas Industrias em F&A; F&A; Performance pós-aquisição; Sinergias em F&A
VIII
IX
A
BSTRACT
Despite the extensive research about post-acquisition synergistic performance in M&A, there are not many studies about industry differences in each type of synergy.
This report, prepared in collaboration with PricewaterhouseCoopers, during an internship in the Corporate Finance - M&A department, attempts to fill this gap in the literature and examine three issues. First it is examined which industries are more successful in M&A in general. Secondly, it is analysed which synergies standout the most inside an industry. And thirdly, it is studied which industries have the best performance in each type of synergy.
It is also provided a new approach for examining performance, by analysing the medians and growth rates of the residual values (difference of actual and the predicted values) of the performance measures. Using post-merger, accounting-based indicators as a measure of performance, and proxies for operating, financial and tax synergies, this essay concludes that Transport, Freight, Storage & Travel Services is the industry with the best performance in general and the tax efficiency is the synergy with most value generation across the other types of synergies. It is also concluded that in the revenue-enhancement synergies and in tax synergies the Construction sector was the industry with more synergistic value creation and in financial synergies, was the Property Services sector. Measurement issues and directions for future research are also discussed in the end.
Keywords: Mergers & Acquisitions; Industry differences in M&A; M&A; Post-deal performance; Synergies in M&A
X
XI
T
ABLE OF
C
ONTENTS
1 | Introduction ... 1
2 | PricewaterhouseCoopers... 3
2.1 | PwC in the world & the Corporate Finance division ... 3
2.2 | PwC Portugal & the Corporate Finance division ... 5
3 | The Literature in Mergers & Acquisitions ... 7
3.1 | Key concepts in M&A ... 8
3.1.1 | Stages ... 8
3.1.2 | Methods ... 9
3.1.3 | Why do firms engage in M&A Transactions ... 10
3.1.4 | Classifications ... 13
3.2 | Mergers & Acquisitions phenomena and post-performance ... 14
3.2.1 | Cultural fit... 15
3.2.2 | Conglomerate diversification ... 17
3.2.3 | Theory of motives and implications ... 17
3.2.4 | Measuring post-performance in M&A studies ... 20
4 | Methodology & Approach ... 26
4.1 | Research question, design & analytical framework ... 26
4.2 | Sample and data description ... 28
4.3 | Research strategy & analysis ... 32
4.3.1 | Accounting-based performance measures ... 34
5 | Findings and Discussion ... 39
XII
5.2 | Synergy creation on each industry ... 41
5.3 | Top industry performance by type of synergy ... 43
5.4 | Discussion ... 47
6 | Conclusion ... 50
6.1 | Theoretical and practical contribution ... 50
6.2 | Limitations ... 51
6.3 | Suggestions for future research ... 52
References ... 53
Annexes ... 61
Annex I – Gains in M&A activity... 61
Appendices ... 63
Appendix I – Description of the sample by industry classification ... 63
Appendix II – Average deal value by industry classification ... 67
Appendix III – Types of M&A per industry classification ... 68
Appendix IV – Zephus industry classification ... 71
Appendix V – Sample distribution by accounting-based measures and industry classification ... 72
XIII
L
IST OF
F
IGURES
Figure 1 – PwC Global Presence ... 4
Figure 2 – Number of employees by world region in the Corporate Finance Division 5 Figure 3 – Employees in Portugal by functional division ... 6
Figure 4 – Takeover activity by type ... 9
Figure 5 – Number of M&A deals per year ... 14
Figure 6 – Percentage of executives who have rated the explanations of post-deal underperformance as major or very major on a scale of 1 to 5 ... 15
Figure 7 – Acquisition Integration Matrix ... 16
Figure 8 – Cumulative Abnormal Returns (CAR) of Acquiring Firms ... 19
Figure 9 – Number of deals concluded per deal announcement year ... 29
Figure 10 – Sources of gain in M&A (Part One) ... 61
XIV th
XV
L
IST OF
T
ABLES
Table 1 – Number of deals ranking made in the World and Europe by financial
consultancy companies ... 4
Table 2 - Number of deals ranking in Portugal made by financial consultancy companies ... 6
Table 3 – M&A Waves throughout the years ... 8
Table 4 – Theories of Merger Motives ... 12
Table 6 - Pattern of Event Returns ... 20
Table 5 - Implications of different hypotheses about the target gains and acquirer gains ... 20
Table 7 – Sample construction taken from Zephyr BvD ... 28
Table 8 – Number of deals per EU-15 countries by acquirer and target ... 30
Table 9 – Percentile division of the deal value in thousands of euros ... 30
Table 10 – Number of transactions per deal type ... 31
Table 11 – Number of deals per industry of the acquirer and weight in the total deals ... 32
Table 12 – Descriptive statistics on the several financial performance measures in thousands of euros ... 38
Table 13 – Number of deals per industry with available financial information for ROE. Rate of failure and possible synergies of the financial performance measure ROE ... 40
Table 14 - Number of deals per industry with available financial information for ROS. Rate of failure and possible synergies of the financial performance measure ROS ... 41
Table 15 - Residual from the growth rates of each financial performance measure by industry ... 42
XVI
Table 17 – Operating Synergy: Cost-based Synergy Analysis ... 44
Table 18 – Financial Synergy Analysis ... 45
Table 19 – Tax Synergy Analysis ... 46
Table 20 – Profit after Tax Analysis, in thousands of euros. ... 47
Table 21 – Number of deals, number of conglomerates, number of deals performed in the same industry and number of deals made in the same country or outside by the industry classification Zephus of the acquirer (Part One) ... 63
Table 22 – Number of deals, number of conglomerates, number of deals performed in the same industry and number of deals made in the same country or outside by the industry classification Zephus of the acquirer (Part Two) ... 64
Table 23 – Number of deals performed in each year from 2005 till 2014 by industry Zephus Classification (Part One) ... 65
Table 24 – Number of deals performed in each year from 2005 till 2014 by industry Zephus Classification (Part Two) ... 66
Table 25 – Average deal value of the initial sample by acquirer’s Zephus Industry in thousands of euros ... 67
Table 26 – Number of deals per deal type and industry Zephus classification (Part One) ... 68
Table 27 – Number of deals per deal type and industry Zephus classification (Part Two) ... 69
Table 28 – Number of deals per deal type and industry Zephus classification (Part Three) ... 70
Table 29 – Zephus industry classification and corresponding NACE Rev. 2 Codes .. 71
Table 30 – Number of deals per performance measure and Zephus industry and weight per Zephus industry in the total sample. Number of deals after leaving only deal types acquisition, MBI, MBO and BIMBO and taking repeating companies (Part One) ... 72 Table 31 – Number of deals per performance measure and Zephus industry and weight per Zephus industry in the total sample. Number of deals after leaving only
XVII
deal types acquisition, MBI, MBO and BIMBO and taking repeating companies (Part Two) ... 73 Table 32 – Number of deals per performance measure and Zephus industry and weight per Zephus industry in the total sample. Number of deals after leaving only deal types acquisition, MBI, MBO and BIMBO and taking repeating companies (Part Three) ... 74
XVIII
XIX
L
IST OF
A
CRONYMS AND
A
BBREVIATIONS
# - Number of something ^ - Predicted Value AT – Austria b – Billion BE – Belgium
BIMBO – Buy-In Management Buy-Out CAGR – Compound Annual Growth Rate Com. – Communications
DE – Germany DK – Denmark
EBIT – Earnings before Interest and Tax EBITDA – Earnings before Interest and Tax
EU – Fifteen member states of the European Union ES – Spain
EY – Ernest & Young FI – Finland
FR – France
GB – United Kingdom
GDP – Gross Domestic Product GR – Greece
H&R – Hotel & Restaurants IE – Ireland
IPO – Initial Public Offer k – Thousand
m – Million
XX MBI – Management Buy-In
MBO – Management Buy-Out
NACE – General Name for Economic Activities in the European Union OE – Operating Expenses
PPP – Purchasing Power Parity ROA – Return on Assets
ROE – Return on Equity ROI – Return on Investment ROS – Return on Sales BvD – Bureau van Dijk
1
1
|
I
NTRODUCTION
Throughout the years, M&A activity has increased considerably, boosted by great change forces in the world economy, such as: accelerated technological pace, reduced communication and transportation costs, expanded and intensified sources of competition and emergent industries and less barriers to capital and investment transactions (Copeland et al., 2014). This kind of investment has always received much attention from the public as well as the academic world, making big headlines and creating lots of controversy around the theme for their possible synergistic outcomes and their huge deal values (Johnson et al., 2009; Hoang & Lapumnuaypo, 2007).
Throughout the literature, there is quite of empirical evidence that M&A on average creates synergistic value (Seth, 1990). There was always the need to measure firms post performance to justify their M&A activity. Nonetheless there is not much evidence whether a company in a specific industry should engage in M&A, and what type of gains will earn the most.
In an attempt to shed some light in this debate by exploring the importance of an industry on the synergistic value creation after an M&A deal, the current paper aims to evaluate the possible outcomes per industry and per synergy type. But measuring these possible outcomes that mergers and acquisitions create is an inexact science, where the most common method is to compare pre and post-deal share prices incorporating investors’ expectations (Rehm et al., 2012).
Therefore, this essay was divided into five chapters. First, because this dissertation was made in a corporate environment, since it is connected to an internship in PwC Portugal in the Advisory - Corporate Finance (M&A) department, the company is introduced along with the motivations for the internship. Second, it is reviewed the context, the key concepts and the post-performance measuring methods in M&A
2
present in the literature. Third, it clarifies and describes the data, the three research questions, the performance measures and the research design and strategy. Because the lack of data and the fact that relying on market expectations skews the results by representing only large companies, the methodology used has focused on accounting based measures using an exploratory approach when assessing synergistic post-performance. Five synergy types and eleven from twenty five general industry classifications were chosen.
Fourth, in chapter five, the results are presented and discussed, and finally, in chapter six the conclusion along with the contribution and limitations of this dissertation and the directions for future work are addressed.
3
2
|
P
RICEWATERHOUSE
C
OOPERS
This dissertation was developed during the internship in the Mergers and Acquisitions department at PricewaterhouseCoopers Portugal. Developing the present study along with this internship and the curiosity to learn and understand M&A activity and its behaviour in each different industry, has played a crucial role and incentive in the choice of this theme.
2.1 | PwC in the world & the Corporate Finance division
PricewaterhouseCoopers has resulted from a merger between Price Waterhouse and Coopers & Lybrand in 1998. Both companies were from London and had its origins in the mid-1800s.
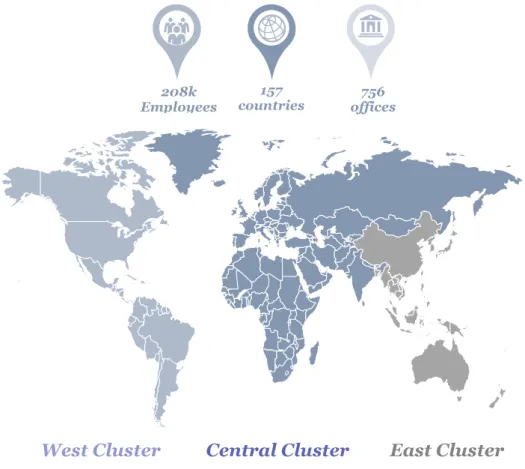
PwC1 is one of the largest consulting company in the world. With a total revenue
of $35.4b in the fiscal year of 2015, PwC is considered one of the “Big Four” together with Ernest & Young, KPMG and Deloitte. It has offices in 157 countries and in 756 different locations, more than 208,109 employees (Figure 1) and was considered in 2015 the 2nd most powerful brand in the world according to Brand Finance Global
500.
PwC clients include 418 firms in the list Fortune Global 500 and 443 firms from FT Global 500. It offers multiple services in the segments of Audit & Assurance, Tax, Advisory, Consulting, Deals, Entrepreneurial & Private Clients, Family Business Services, IFRS, People & Organisation, Legal, and Sustainability & Climate Change.
4
In 2015 and 2014, PwC was the number one company in the world and Europe in terms of number of M&A transactions, being ahead of its competitors (Table 1). Furthermore, in the last ten years, PwC has advised more than 4,000 transaction worldwide with a total value of more than €460b.
World Rank Advisor Nr. Deals 2015 Nr. Deals 2014 Europe Rank Advisor Nr. Deals 2015 Nr. Deals 2014 1 389 398 1 262 266 2 Goldman Sachs 349 376 2 Rothschild 242 220 3 Morgan Stanley 329 288 3 KPMG 205 242 4 KPMG 323 365 4 EY 196 217 5 JPMorgan 303 274 5 Deloitte 175 197
Table 1 – Number of deals ranking made in the World and Europe by financial consultancy
companies | Source: PwC’s internal source
West Cluster Central Cluster East Cluster 208k
Employees offices756
157 countries
5
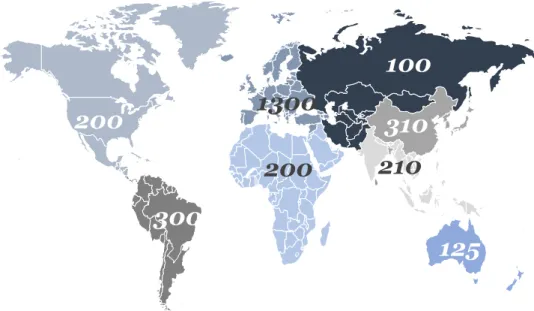
The Corporate Finance division in the Deals department has 2,500 employees spread worldwide (Figure 2). The department Deals is divided in Transactions and Corporate Finance.
2.2 | PwC Portugal & the Corporate Finance division
PwC is present in Portugal for more than fifty years and its activity is split by the following entities:
Auditing: PricewaterhouseCoopers & Associados - Sociedade de Revisores de Contas, Lda (PwC SROC);
Advisory: PricewaterhouseCoopers / AG - Assessoria de Gestão, Lda (PwC AG);
Financial Services: PricewaterhouseCoopers / MFAS – Management, Finance & Accounting Services, Lda.
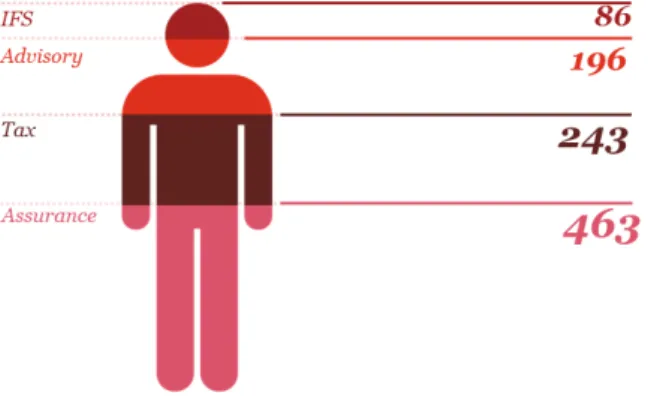
PwC has two offices in Portugal – Lisbon and Oporto – and other two in Angola and Cape Verde, with 38 partners and about 1,300 employees in total (Figure 3). The services offered are Assurance, Tax and Advisory. In advisory, there is the
100
310
210
1300
200
300
125
200
Figure 2 – Number of employees by world region in the Corporate Finance Division
6
subdivision named Corporate Finance and therefore the divisions of M&A, Funding/ IPO’s, Privatizations, Project Finance, Revision of Financial Models and Public Private Partnerships.
In terms of number of deals made in 2015, Portugal also stands out in first place, with seven deals made in the last year (Table 2).
PT Rank Advisor Nr. Deals 2015 Nr. Deals 2014 1 7 3 2 EY 4 1 3 Deloitte 1 1 4 Citi 1 1 5 KPMG - 4
Table 2 - Number of deals ranking in Portugal made by financial consultancy companies
Source: PwC’s internal source
Figure 3 – Employees in Portugal by functional
7
3
|
T
HE
L
ITERATURE IN
M
ERGERS
&
A
CQUISITIONS
M&A, an alternative approach to organic development (Johnson et al., 2009), is
considered a form of investment and a way to grow quickly by external means (Copeland et al., 2014; Rappaport, 2006; Cusatis & Blumberg, 2009).
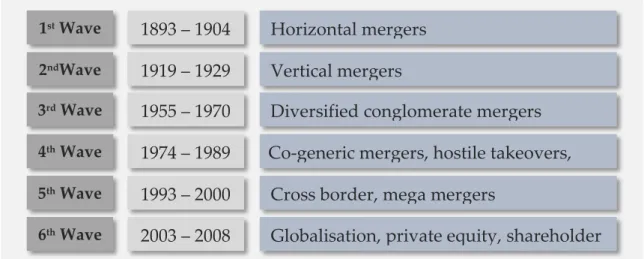
Back in early 1900s, M&A activity began to rise, first at a domestic level, and later, with the help of technology, communication and transport advances, at an international level (Grave et al., 2012). As it is shown in Table 3, there are six waves in the history of takeovers (Weston & Weaver, 2001; KPMG, 2011):
1st Wave: Characterised by the creation of giant companies through
horizontal mergers ending later with the World War I.
2nd Wave: Marked by the flourishing of the automobile sector and vertical
integrations. This wave has ended with the great depression.
3rd Wave: Witness the rise and fall of the trendy (at that time)
conglomerates, where the share prices crashed later in most of these diversified companies.
4th Wave: This wave has involved extremely leveraged acquisitions and
hostile transactions that led banks to bankrupt due to their excessive lending activity.
5th Wave: Size was the key word at that time and ended because of the
millennium bubble and some controversy around some companies (e.g. Enron).
6th Wave: Boosted by globalisation, this wave accentuated the Private
8
All waves coincide with favourable economic/political environment, stock exchange booms and easy loans, and are followed by technological or industrial shocks in the economy. In the end of which wave, the decisions made by the managers are irrational and vanity/self-related (Martynova & Renneboog, 2008).
3.1 | Key concepts in M&A
This section provides a summary of the stages, methods, motives, gains and classifications of mergers and acquisitions.
3.1.1 | Stages
The M&A process might have five (Cusatis & Blumberg, 2009) or three different stages depending on streams in the literature (Kusstatscher & Cooper, 2005; McCarthy & Dolfsma, 2013). The three stages view is divided in pre-merger, during-merger and post-during-merger stages.
The first step underlines the planning process, where potential candidates are identified, biddings and negotiations are made and a due-diligence and valuation is performed to the target company. Financial and economic motives are also assessed in this screening phase.
1st Wave 1893 – 1904 Horizontal mergers
2ndWave
Wave
1919 – 1929 Vertical mergers
3rd Wave 1955 – 1970 Diversified conglomerate mergers
4th Wave 1974 – 1989 Co-generic mergers, hostile takeovers,
corporate raiders 5th Wave
6th Wave
1993 – 2000 2003 – 2008
Cross border, mega mergers
Globalisation, private equity, shareholder activism
9
The during-merger phase is the bureaucratic part, comprising the validation, formalization and announcement of the transaction.
The last stage is characterised by the integration or implementation phase of the strategic capabilities. These strategic competences might be deeply embedded in the organisation’s culture, making it more difficult to transfer the potential synergies and value added from one company to another (Barney, 1991; Weston & Weaver, 2001). Therefore, to achieve a successful integration, the process must not be too slow and changes have to be made at three different levels: strategic/corporate, administrative/business and operative (Kusstatscher & Cooper, 2005).
3.1.2 | Methods
For a company to buy another there are three possible legal methods (Figure 4): the merger or consolidation, the acquisition of stock and the acquisition of assets. When a merger occurs, the target ceases to exist and is incorporated in the acquirer firm (assets and liabilities of the target are absorbed by the acquirer), while in a consolidation both target and bidder cease to exist and create a new firm. In the second legal method, the acquisition of stock, the acquirer purchases the target’s voting shares using stocks, cash or other securities. It can be performed by a tender offer – a public offer to purchase shares – that usually is perceived as hostile. Finally, in the acquisition of assets, the buyer acquires most or all assets of the target company (Ross et al., 2002).
Takeover Acquisition Proxy Contest Going Private Merger or Consolidation Acquisition of Stock Acquisition of Assets
10
Concerning the acquisition of stock or assets, there are several ways to enter or control the capital of another firm. The most important ones are the following (Ross et al., 2002; APCRI, 2006; Weston & Weaver, 2001):
Capital Increase: the existing shareholders subscribe additional shares; IBO: the acquisition is performed by a private equity or venture capitalist
firm (institutional investor);
MBI: external management team becomes the company’s new management by acquiring the firm;
MBO: internal management team financially supports the firm by acquiring it;
BIMBO: is the combination of the two methods described before, where an external management team supports the internal management team that controls the firm;
Minority Stake: acquisition of a stake in the company lower than 50%; Share buyback: repurchased outstanding shares from the stock market.
3.1.3 | Why do firms engage in M&A Transactions
Mergers and Acquisitions may allow several possible gains2 (Lynch & Lind, 2002;
Palepu et al., 2013; Ross et al., 2002; Weston & Weaver, 2001):
New capabilities
Access to new markets
Additional value to shareholders
Revenue enhancements such as marketing gains, strategic benefits and increased market power
Cost reductions through economies of scale, economies from vertical integration and/or complementary resources between firms
Lower taxes
11 Synergies
One example of synergy gains can be observed in the Zon and Optimus merger in 2013. Zon, a big Portuguese cable telecoms firm offering a triple-play service3, when
has merged with Optimus, mainly a mobile telecom company with mobile telephony and internet, both firms were able to take advantage from the combination of their related business and become a much greater company providing a broader telecommunications service and offer a quadruple-play service4.
Concerning the motives, Johnson et al. (2009) consider strategic, financial and/or managerial motives in an acquisition of a firm. The first motive includes the extension to new geographies, the consolidation of competitors – increasing market power and efficiency – and the acquisition of new capabilities. The financial motives comprise: the financial efficiency that happens when a company with a great amount of cash joins another firm with high debt5; the tax efficiency and the asset stripping or unbounding that happen when assets are more valuable than the entire business together, making it possible for the acquirer to split the firm in several business units and sell it separately (Palepu et al., 2013). Finally the managerial motives, usually value destroyers, consist in personal ambition and bandwagon effects. This last one happens when lots of transactions are taking place in the industry and managers are pressured to also acquire.
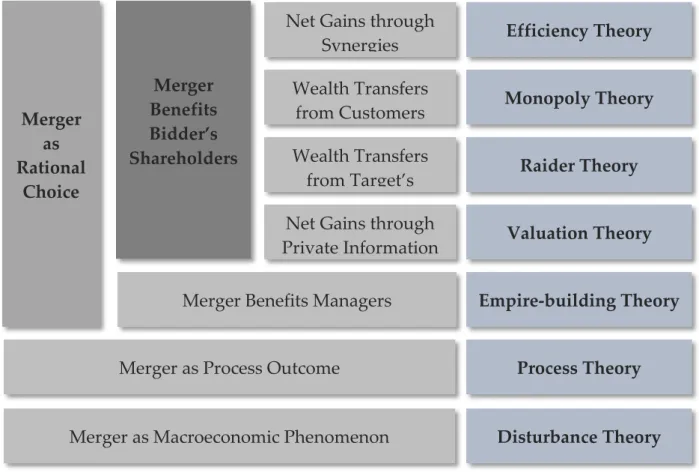
Trautwein (1990) reviews several other theories about takeover’s motives and provides a summary identifying seven major theories in this matter (Table 4).
3 Internet, television and fixed phone services. 4 Includes mobile phones.
5 In this way one can finance the other and the firm with strong balance sheet probably will get a cheap deal
12
The first theory referred is the efficiency theory, which incorporates three types of synergies: operational, financial and managerial6.
The monopoly theory translates the seeking for market power and the raider theory explains the wealth transfer form target’s shareholders in the form of greenmail or excessive compensation.
In the valuation theory and empire-building theory managers perform and plan the transaction. The first theory considers that the manager has more information about the enterprise value than the shareholders, and the second theory considers that the manager plans and performs the acquisition taking into account his own utility maximisation, and not the shareholders’ utility.
6 Will be discussed later in this chapter.
Merger as Rational Choice Merger Benefits Bidder’s Shareholders
Net Gains through
Synergies Efficiency Theory
Monopoly Theory Raider Theory Valuation Theory Empire-building Theory Process Theory Disturbance Theory Merger as Process Outcome
Wealth Transfers from Customers
Merger as Macroeconomic Phenomenon Wealth Transfers
from Target’s Shareholders Net Gains through Private Information
Merger Benefits Managers
13
The process theory assumes that decisions of a transaction are a result of past processes and influences and not rational strategic choices, and finally the last theory assumes that Mergers and Acquisitions waves are caused by economic instabilities with consequences as uncertainties and shaken expectations.
3.1.4 | Classifications
According to several authors (Ross et al., 2002; Rosenbaum & Pearl, 2013; Iannotta, 2010) there are three M&A classifications, namely horizontal, vertical and conglomerate acquisitions.
The horizontal acquisition, ponders the same industry for the target and buyer involving competitive or complementary products. The Walt Disney Company – a television and film producer mainly focused on a young audience – buying Lucas Films – a film producer of a fiction blockbuster – makes a good example for horizontal integration, since both are in the same level in the value chain and may take some synergy gains out of the transaction.
Vertical acquisition considers a different phase of the supply chain for each the acquired firm and the acquirer. It may be backwards or forwards, depending if the target is a supplier or a buyer.
The conglomerate acquisition happens when the acquirer wants to diversify his portfolio. The target’s and bidder’s businesses are unrelated, meaning that the two firms existing businesses don’t have any relationship with each other.
14
3.2 | Mergers & Acquisitions phenomena and post-performance
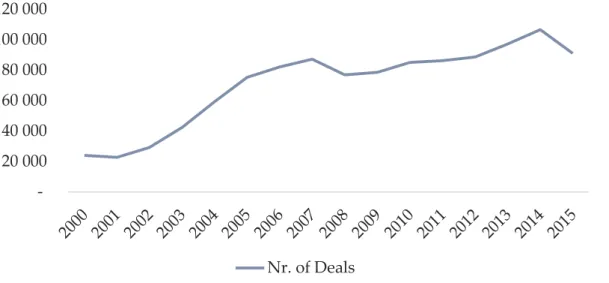
Mergers and acquisitions have been gaining popularity throughout the years, being something very common nowadays. Figure 5, clearly shows the pronounced increase of deals in the last 15 years. However the intense M&A activity diverges sharply from post transaction performance.
Accordingly to the results of a major study7 by Hay Group in 2007, 90% of Mergers & Acquisitions are not a success. Nonetheless M&A activity reaches every year new peaks in terms of number of deals and value (Weber et al., 2013).
Along the M&A history several studies demonstrate an high rate of failure and present various explanations for these disappointing performances. Some theoretical and empirical explanations for these failures can be found in Lynch & Lind (2002) and Cusatis & Blumberg (2009), such as lack of cultural fit, hubris and overvalued8
companies, conglomerate transactions (diversification) or exaggeratedly overconfident expectations from synergies (Roll, 1986; Johnson et al., 2009). By conducting a survey where 352 executives in Europe, North America and Asia were
7 Performed over 200 major European M&As transactions for three years. 8 Explained later in 3.2.3 | Theory of motives and implications.
20 000 40 000 60 000 80 000 100 000 120 000 Nr. of Deals
15
asked to designate the causes for unsuccessful acquisitions, Miles et al. (2012) describe the top five root issues appointed in Figure 6.
Figure 6 – Percentage of executives who have rated the explanations of post-deal underperformance
as major or very major on a scale of 1 to 5 | Source: Economist Intelligence Unit on behalf of Bain & Company, 2012
Some of these aspects will be explained in the following subchapters along with the explanation of some methods of post synergistic performance measuring.
3.2.1 | Cultural fit
The culture aspect is one of the most debated post-merger problems of mergers and acquisitions (Datta et al., 1991; Weber & Tarba, 2012; Weston & Weaver, 2001).
Culture stands for beliefs, values, procedures, management styles, traditions and other behavioural patterns of one company that may be formal or informal. When cultures are combined from different companies in the integration stage, confusion, disbelief, antagonism and resistance can be generated from one or both sides. These cultural differences are boosted when the transaction is cross border.
0% 20% 40% 60% 80%
Due diligence failed to highlight critical issues
Overestimated synergies from combining the companies Failed to recognize insufficient
strategic fit
Failed to assess cultural fit during due diligence
Hit problems integrating management teams and retaining key talent
16
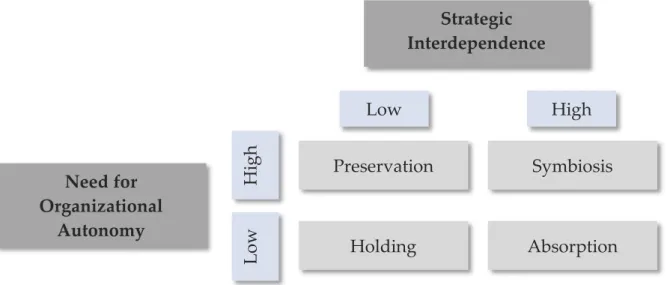
According to the model created by Haspeslagh & Jemison (1991), integration has to be made giving some conditions (Figure 7). For companies with high interdependence, the authors believe that tight integration is needed in order to exchange capabilities. In the case of conglomerates this strategic interdependence will be low due to the low level of relatedness in the business. Companies with a strong and different culture, or ruled by strong characters or even geographically distant should be slowly and carefully integrated or left alone, like in the case of conglomerates that suit better the preservation category.
Even so, many firms when performing or planning a transaction ignore these cultural factors preventing integration benefits and damaging the performance of the firm. However Stahl & Voigt (2008) and also Datta et al. (1991) found that these differences can have a positive or a negative impact on performance depending on the degree of relatedness and the dimension of cultural differences between firms, leading the present revision for one of the explanations for failure mentioned before about conglomerate transactions.
Need for Organizational Autonomy Preservation Low Strategic Interdependence Symbiosis Absorption High Holding Hi g h Low
17
3.2.2 | Conglomerate diversification
Conglomerate (unrelated) diversification through acquisitions, meaning that the acquirer buys a firm that does not offer the same products or does not serve the same market, can be also a cause for disappointing performances (Johnson et al., 2009). According to Federal Trade Commission and Ansoff (1988), related strategies involve horizontal/vertical integration and product or market extension acquisitions leaving all other transactions to the category of (pure) conglomerates.
These kind of transactions may have the wrong motives like spread the risk, respond to market decline and managerial ambition (Johnson et al., 2009). There is evidence that shareholders can reduce and spread risk more effectively on their own by investing in different businesses than the company by diversifying (Seth, 1990). There is also evidence that related businesses bring more synergistic value than unrelated ones (Stahl & Voigt, 2008; Lubatkin, 1983; Seth, 2002). Porter (1967) found that the more differences exist between the two value chains9 of the two companies,
the more difficult will be to transfer skills and create synergies.
3.2.3 | Theory of motives and implications
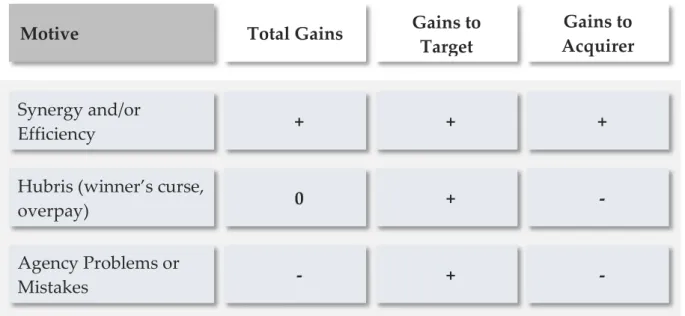
Another theory explaining failure and success was developed by Berkovitch & Narayanan (1993), where they introduce a pattern of gains to the acquirer and target according to the acquirer’s motivations. Therefore this theory explains three motivations for M&A: efficiency gains (restructuring) or synergies, Hubris or Winner’s Curse and Agency Problems or Mistakes.
The concept of synergy is the most cited motivation for a takeover. (Corporate) Synergies occur when beneficial financial effects from two or more companies combined exceed the sum of the value created by the same number of companies on their own if the acquisition have not taken place (Ross et al., 2002; Bradley et al.,
18
1987). According to Iannotta (2010) and McSweeney & Happonen (s.d.) it can take the form of operating or financial synergies.
Financial synergies aim to improve the cost of capital by, for example, combining a target with a weak balance sheet, with an acquirer with a strong one. Operating synergies measure cash flow boosts and can be divided into four types: cost synergies (e.g. economies of scale or scope and increased bargaining power with suppliers), asset/ investment synergies (e.g. use of common equipment), tax synergies (e.g. tax savings) and revenue synergies (e.g. cross selling and pricing power).
Another classification made by the authors Wind & Mahajan (1985) consider operating, investment, sales and management synergies. The first two fit in the operating synergy description made above. Sales refer to advertising, common market and distribution channel gains. And managerial synergies refers to risk reduction, shared resources and when the acquirer possess greater planning and management capabilities that improve the target's performance (Jensen & Murphy, 1990).
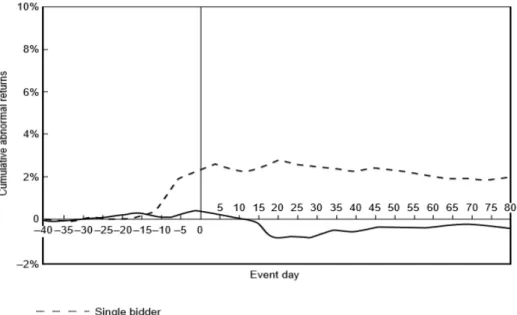
Regarding the hubris hypothesis, this motive is explained by the winner’s curse theory10, where overpayment is implicit. This theory applied to M&A activities,
explains that the bidder, when facing lots of other bidders – and taking into account that the value of the target is uncertain – in order to win, the firm has to present an higher bid than all the other bids (Figure 8), probably making it an over valuated offer (Roll, 1986).
19
About the last motivation, Jensen & Meckling (1976) clarify consequences in the concept of agency costs, explaining that because managers do not own a considerable stake in the company, have incentives to put less effort and consume more available perks provided by the firm. In an event of a merger or acquisition the manager may try to increase his perquisites or to target companies on businesses very well known by him to make him indispensable and less substitutable in the eyes of the shareholders (Berkovitch & Narayanan, 1993).
The total gains resulting from these three motives can be observed in Table 5 and 6, showing that the target always gain (Weston & Weaver, 2001; Iannotta, 2010; Lubatkin, 1983; Hackbarth & Morellec, 2008) and only in the synergy and efficiency hypothesis the gains are positive to the acquirer (Berkovitch & Narayanan, 1993). Some evidence shows that the target and acquirer returns have increased and decreased respectively over the last decades due to greater government regulation and more sophisticated defensive strategies from the targets (Weston & Weaver, 2001).
Figure 8 – Cumulative Abnormal Returns (CAR) of Acquiring Firms | Source:
20
3.2.4 | Measuring post-performance in M&A studies
In the literature, there are several empirical studies evaluating the creation and destruction of synergistic economic value of mergers and acquisitions (Bradley et al., 1987; Eckbo, 1981; Seth, 1990; Berkovitch & Narayanan, 1993).
Zollo & Singh (2004) and Zollo & Meier (2008) define the post-performance studies in M&A as having “(…) much heterogeneity both on the definition of the performance of M&As and on its measure” showing that performance measurement is a multidimensional evaluation where the available methods only cover parts of it.
Total Gains Motive Gains to Target Gains to Acquirer + Synergy and/or Efficiency + + - Agency Problems or Mistakes + - 0 Hubris (winner’s curse,
overpay) + -
Mergers Tender Offer Targets Buyers Positive 20-25% Positive 1-2% Positive 30-40% Negative 1-2%
Table 5 - Pattern of Event Returns | Source: Weston & Weaver, 2001
Table 6 - Implications of different hypotheses about the target gains and acquirer gains | Source:
21
They suggest that when measuring performance, decisions about some perspectives have to be made on whether to be: subjective or objective, expected returns or realized returns, short-term or long-term, public or private information and acquired separate returns or combined returns.
One of the most used methods to assess the performance of firms involved in M&A activity is the event studies (Eckbo, 1981; Seth, 1990; Weston & Weaver, 2001; Berkovitch & Narayanan, 1993; Iannotta, 2010; Wang & Moini, 2012). In the meta-analytic review of Datta et al. (1992), the authors identify more than forty studies using this methodology alone. The empirical evidence in synthesis from most of this studies shows that the acquirer does not get any gains from the transaction at the time of the announcement.
The event studies by measuring the abnormal market based return at the time of the deal announcement assesses the impact of an event – in this case a merger or an acquisition – on the value of the firm. Usually, the most common way to calculate abnormal returns is to estimate, with a regression, the stock returns and compare with the market index. The abnormal return is the difference between the expected and the actual stock.
The researchers usually define a period of time of days, months or years (event window) before and after the event that can be categorised as short-term – ex-ante approach – or long-term – post-ante approach – event study, where short-term represents future returns assuming that financial markets have a forward vision and long-term assumes that the stock price does not capture instantly the deal effect (Wang & Moini, 2012).
This statistical approach is considered a market based measure since it comes from stock returns based on market expectations, reflecting the future value of a firm (Gentry & Shen, 2010; Schoenberg, 2006).
22
On the other hand, accounting based measures appear has another option to assess firm’s performance after a deal. As it happens in long-term event studies, accounting measures also have a long run perception, although it considers realized and past returns. This measure comprises post and pre-deal values from firm’s accounting statements where subsequent values are assumed to reflect any benefits or costs from takeovers (Gentry & Shen, 2010; Masa’deh et al., 2015).
This method is based on financial accounts from the Balance Sheet, Income Statement and Cash Flow Statement of a company and usually uses cash flow, employment earning and innovation measures, and productivity and growth rate of assets or sales. Researchers frequently apply financial ratios like ROA, ROE, ROS and ROI and also sales growth and cash flow to analyse the performance of the firm (Wang & Moini, 2012; Masa’deh et al., 2015; Barber & Lyon, 1996). Empirical results may differ across all studies in the literature according to the definition of performance provided, the choice of book or market values and the methodology chosen (Wang & Moini, 2012).
According to Cording et al. (2010) and Zollo & Meier (2008), event studies and accounting measures represent 92% of the empirical studies, where 41% of the articles use short-term event studies, 31% use long-term event studies and 28% use accounting based measures. Besides accounting and market performance measures, Wang & Moini (2012) define other three11 commonly used approaches: managers’
perceived performance, expert informants’ assessment and divestment measures.
Managers’ perceived performance use interviews and surveys to extract data from top executives of the acquirer firm12, where they rate the completion of their
pre-M&A objectives (in the form of financial or non-financial ratios) of several years after the deal is complete. Zollo & Meier (2008) found out that 14% of the papers reviewed used management’s perception. In this approach several advantages come to light as
11 Zollo & Meier (2008) identified twelve distinct approaches on total. 12 Sometimes the target firm is asked to share its perspective.
23
the diminished external noise, the usage of private and accurate information13 and
the multidimensionality character (Wang & Moini, 2012; Schoenberg, 2006).
Very similar to the managers’ perceived performance approach, expert informants’ assessment use the same elements, but instead of extracting information from top executives, researchers ask experts (e.g. security analysts) or in some cases ask both. Thus, by using this approach, the research is not exposed to management bias, since the performance assessment is made by external people (Wang & Moini, 2012; Schoenberg, 2006).
Finally, the divestment measure uses divestures as a metric for failure (Meschi & Metais, 2008; Wang & Moini, 2012).
Although some correlation was found between managements’ and experts measure, Zollo & Meier (2008) and Schoenberg (2006) did not found any association between subjective and objective approaches, and any relation at all between short-term event studies with the other performance measures.
When measuring the performance of the firm, the empirical research made throughout the years has showed that the most common profitability determinants based on the characteristics of the sample are (Wang & Moini, 2012; Kusewitt, 1985):
Country Level Evidence
Research from companies of one or more countries comparing gains for example between developing and developed countries (Kumar, 2009).
Domestic and Cross-border Deals
Evidence on differences between deals made domestically or outside de country (Morosini et al., 1998).
24 Hostile Takeovers vs Friendly Deals
Although hostile14 takeovers are not very common (Weston & Weaver, 2001),
empirical evidence shows higher returns in hostile than in friendly M&A (Tuch & O'Sullivan, 2007).
Methods of payment
Depending if the company pays in cash or stocks, different returns will be expected, where empirically in cash payments deals the performance is inferior (Tuch & O'Sullivan, 2007).
Relatedness
There is mixed evidence where Porter (1987) and Johnson et al. (2009) appoint better performance in related business than in unrelated ones, and Eckbo (1989) concludes that there is no significant difference in gains between horizontal and non-horizontal mergers.
Experienced Acquirers
Zollo & Reuer (2006) found that experience acquirer firms have a positive relationship with performance.
Waves in M&A
Martynova & Renneboog (2008) found that takeovers are more common and have a better performance depending on the part of the wave they were experiencing.
Private vs Public Targets
Capron & Shen (2004) found that when acquiring targets – public or private – the returns depend on the relevance of their “agency costs, resource sharing
opportunities, and bargaining power”.
Relative Size of the Acquirer
Empirical data evidence proves a negative correlation between the acquirer size and M&A performance (Moeller et al., 2003).
25
Concerning the industry differences as a profitability determinant, there is not much research on this topic. Still Cusatis & Blumberg (2009) have summarized the findings in the literature stating that mergers in banking, railroad and property liability insurance industries seem to create more synergistic value than mergers in other industries. Bruner (2002) also found in the state of the art a trivial inclination for returns to diminish over time, apart from deals in banking and technology industries.
26
4
|
M
ETHODOLOGY
&
A
PPROACH
In the present dissertation, a quantitative and qualitative analysis, comparing the performance of different industries using firms involved in M&A activity, was undertaken. Therefore the research questions, the sample and the research strategy used in this study will be explained in the following subchapters.
4.1 | Research question, design & analytical framework
When measuring performance in an M&A context, most studies look to the factors influencing synergistic value creation (Lynch & Lind, 2002), the sources of synergies (Seth, 1990) or to the differences between the acquired and acquirer gains (Berkovitch & Narayanan, 1993).
None of these studies, however, simultaneously look at the performance of the combined firms by source of synergistic value creation along with the performance between different industries. Thus, this essay presents an exploratory approach and attempts to address these issues in order to clarify differences between industries in terms of synergy performance. To do so, three specific research questions were investigated:
Which industries have on average the highest performance after an M&A deal?
Which value creation synergy types within an industry have on average the highest performance after an M&A deal?
Which industries after an M&A deal have the best results per type of synergy?
In order to describe and explain the research questions, the type of research used, supported by Nenty (2009), is the mix-method approach, involving both quantitative
27
and qualitative analysis. According to Nenty (2009), mix-methods are descriptive empirical studies used when the research question(s) is (are) not translatable into hypotheses with direct affirmative or negative answers. These descriptive empirical studies are answerable through descriptive examination of the data.
Within the mix-methods, quantitative analysis is defined as a process to extrapolate information from a sample to a larger population, supported by theory. Quantitative research is divided in three different sections as the (1) verbal part, where the literature is reviewed and the research problem is presented and validated; followed by (2) the quantitative part, where hypotheses are tested or the research question is numerically supported; ending with (3) with another verbal part where the study is summarized and findings are discussed (Nenty, 2009).
Regarding the analytical approach, although market based measures are considered superior than other kinds of performance measure (Morosini et al., 1998), the present essay will focused on accounting based measures due to the fact that the database used – Zephyr – has not a considerable amount of deals of publicly listed companies. Nevertheless accounting based measures present several advantages (Wang & Moini, 2012):
It takes into account returns that already happen and not expected synergies
There is more valuable information to evaluate different perspectives in a M&A transaction
Has a simpler implementation than event studies Multiple motives effects after the deal can be tracked Private firms are not left out
Considers all firm sizes (unlisted and listed) and not only really big companies
28
4.2 | Sample and data description
The initial sample15, taken from Zephyr BvD database, consisted in 8,496
completed mergers or acquisitions from firms (target or acquirer) with positive turnover16, occurred in the period of January 2005 till December 2014 (Table 7).
Research Steps Step Result # Observations
Competed Deals 1,094,202 1,094,202
Time Period of 01.01.2005 till 31.12.2014 820,415 820,369
EU 15 Countries (acquirer and target) 54,687 32,887
Acquirer Operating Revenue >0 369,671 16,901
Target Operating Revenue >0 547,685 8,496
Total - 8,496
Table 7 – Sample construction taken from Zephyr BvD
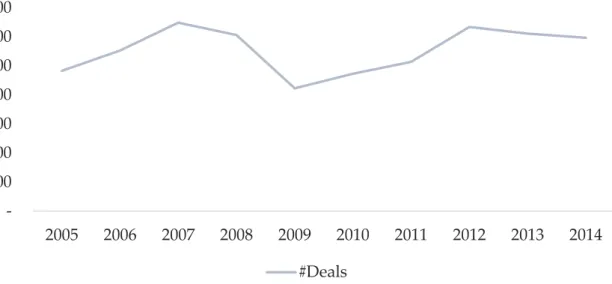
The sample, was therefore limited, according to the equity method (nr.6 from IAS 28, paragraphs 19-20 from NCRF 13), to acquisitions and mergers with stakes over 20%. After this screening phase, the sample was reduced to 6,873 deals of 5,355 acquirers and 6,509 targets. As it is displayed in Figure 9, the busiest and quietest years were 2012 and 2009 with 634 deals17 and 423 deals respectively.
15 For more detailed information about the sample: Erro! A origem da referência não foi encontrada., Table 21, 22,
23 and 24.
16 To ensure that the companies were active.
17 Zephyr data base does not have all the records about transactions, therefore these values are close estimates of
29
In order to have a more uniform and homogeneous18 sample, the data collected
refers only to transactions performed between countries in the EU-15, such as, Austria, Belgium, Denmark, Finland, France, Germany, Greece, Ireland, Italy, Luxembourg, the Netherlands, Portugal, Spain, Sweden and the United Kingdom. These countries were defined by the origin of the acquiring and acquired firm, not taking into account the vendor’s country.
It is possible to observe that the countries with more deals in the past ten years were Finland, followed by France and Spain. The countries with less deals were Ireland and Luxembourg (Table 8). Only 50 deals from 6,873 were cross borders.
18 To have less differences in the accounting standards across countries.
100 200 300 400 500 600 700 2005 2006 2007 2008 2009 2010 2011 2012 2013 2014 #Deals
30
Acquirer Number of Deals Target Number of Deals
AT 69 AT 68 BE 169 BE 176 DE 500 DE 498 DK 44 DK 44 ES 956 ES 962 FI 1,230 FI 1,231 FR 1,178 FR 1,178 GB 861 GB 853 GR 82 GR 82 IE 4 IE 4 IT 717 IT 723 LU 7 LU 3 NL 131 NL 128 PT 102 PT 102 SE 823 SE 821
Table 8 – Number of deals per EU-15 countries by acquirer and target
The deal value19 in this sample has a minimum of 3,000€ and a maximum of
17,800,000,000€, but 50% of the cases will be below 9,300,000€ and 99% will be below 369,460,000€ (Table 9)20.
k€ Min 0,25 median 0,75 Max
Deal
Value 35,293 8,993 3 2,725 9,300 24,879 17,800,000
Table 9 – Percentile division of the deal value in thousands of euros
Regarding the types of deals21 (Table 10) and the industries (Table 11), the sample
collected reflects the categorization made by Zephyr22, presenting nine different deal
19 Only 2 057 of the deals in 6 873 have information about the deal value.
20 For average deal value in each industry, see Appendix II – Average deal value by industry classification, Table
25.
21 In Appendix III – Types of M&A per industry classification Table 26, 27 and 28 has the deal types per industry. 22 To see the NACE codes that correspond to each Zephus industry classification, see
31
types and twenty five different sectors. Only twenty five deals, according to their NACE rev..2 two digit code23, were made between companies in unrelated industries.
In these 6,873 deals sample, it is also possible to assess the number of companies involved and their size in terms of personnel. There are 5,355 acquirer companies with an average of 4,061 employees and a median of 113, and 6,509 target companies with an average and median of 469 and 21, respectively.
Appendix IV – Zephus industry classification (Table 29).
23 Although, throughout the essay, it was used the industry Zephyr classification in order to have a broader
categorization of an industry than the NACE codes, another approach was made to see the number of unrelated industries. Only the first four NACE industry CAEs of the acquirer and acquired were compared. If one or more codes were the same in each company, then it was considered a related industry.
Deal Type #Deals Deal Type #Deals
Acquisition 5,452 MBO 2
Capital Increase 34 Merger 53
IBO 444 Minority stake 771
MBI 3 Share buyback 83
BIMBO 1 No Type 30
32
By Acquirer’s Industry #Deals % By Acquirer’s Industry #Deals %
All 6,873 100% Mining & Extraction 47 1%
Agriculture, Horticulture &
Livestock 79 1%
Miscellaneous
Manufacturing 15 0%
Banking, Insurance & Financial
Services 1,681 24%
Personal, Leisure & Business
Services 870 13%
Biotechnology, Pharmaceuticals
and Life Sciences 30 0% Printing & Publishing 232 3%
Chemicals, Petroleum, Rubber
& Plastic 108 2% Property Services 283 4%
Communications 204 3%
Public Administration, Education, Health Social Services
239 3% Computer, IT and Internet
services 409 6% Retailing 298 4%
Construction 248 4% Textiles & Clothing
Manufacturing 55 1%
Food & Tobacco Manufacturing 255 4% Transport Manufacturing 83 1% Hotels and Restaurants 82 1% Transport, Freight, Storage &
Travel Services 341 5%
Industrial, Electric & Electronic
Machinery 294 4% Utilities 345 5%
Leather, Stone, Clay & Glass
products 73 1% Wholesaling 346 5%
Metals & Metal Products 143 2% Wood, Furniture & Paper
Manufacturing 113 2%
Table 11 – Number of deals per industry of the acquirer and weight in the total deals
4.3 | Research strategy & analysis
Because the aim of this study was to measure synergies per industry by using accounting-based measures24, a forecast of a “normal” return for each type of
measure used was needed.
To do so, the first step was to define the periods to consider in the analysis. Zephyr BvD only includes data for the three years pre-merger, one year post-merger and the last year available after the merger from the target and the buyer. For the
33
purpose of this essay, the last year available after the transaction was not considered25.
The next step was to add the returns Rjnt from the target g and the acquirer a of each financial account entry j, in time t26 and in each deal n, with the purpose of
considering each pair of firms a single entity and like so evaluate synergistic value creation (Seth, 1990; Kengelbach et al., 2013):
Rjtn=Rjntg+Rjnta
In order to assess if there was synergies in each deal, the succeeding step was to forecast a post-deal return Rˆjn for each financial account and each transaction. The predicted return considers a “normal” return that would have been expected if the firm was not involved in the transaction. The difference between this predicted return and the actual return after the event generates the residual, which denotes abnormal returns:
rjn=Rjn–Rˆjn
Thus, representing synergistic value creation (abnormal returns), bearing in mind the definition of synergy, the actual combined returns of the target and the acquirer firm should exceed the predicted combined ones, since the predicted returns would have only happened if there was no transaction and the combining companies had stayed independent, i.e. the joint firm will have to create more value than the separate firms.
Fourthly, for the estimation of this “normal” returns, it was used an instrument Gjntc that considers the compound annual growth rate of each deal of the three
25 It was not considered because it was not homogeneous throughout the deals, since deals realized in 2006 would
have values for the last year available from 2014 (8 years of difference) and deals made in 2012 would have values also from 2014 but with 2 years of difference. Also deals made in 2014 would have the same value for the first year available account and last year available.
34
merger years and a “deflator”, adjusting the CAGRnj27 to the GDPct annual growth
rate. It was taken from World Bank database, the GDP PPP per capita (constant 2011) and calculated subsequently its CAGR over the three previous years, by country c and for each year t from 2005 to 2014 (CAGR_GDPct)28. Hence, the CAGR_GDPct was
individually combined in each deal with the correspondent year29 and country, and
subtracted to the CAGRnj of the matching deal, originating the growth rate used in the forecast30:
Gjntc = CAGR – CAGR_GDPnj ct
Finally, to assess the performance of each industry per financial entry or financial ratio j, for each industry i, the residual average and median (Kengelbach et al., 2013) across deals were calculated. Like so, it is possible to estimate the average/median abnormal returns per industry and per accrual j, allowing to answer the research questions proposed.
4.3.1 | Accounting-based performance measures
In this analysis several indicators were needed, however it was only possible to assess those available in the Zephyr database (in Appendix V, Table 30, 31 and 32 a description of the distribution of each subsample per indicator is made). The financial account entries from the balance sheet and income statement available were the following:
Turnover (or Operating revenue) EBITDA
EBIT
Profit Before Tax
27 It was calculated the CAGR of each combined accounts Rjtn of the target and acquirer in each deal. So for
example for deal 1 the CAGR was ((Post-deal Rjt1/ Pre-deal -3 Rjt1)^(1/2))-1.
28 For example, the CAGR of the GDP of 2005 was the ((GDP2005/GDP2003)^(1/2))-1.
29 Year when the deal was complete and the GDP compound annual growth rate on that year.
30 Because there were only 3 years to do the forecast, no other forecast methods could be used besides growth
35 Profit After Tax
Total Assets
Shareholders’ Funds Net Assets
Market Capitalization
Three of this financial accounting variables were discarded due to insufficient data: Net assets because only 289 deals presented figures (i.e. target, bidder and all years), most of them classified as banking industry and all of the deals had always one value of one year missing; Total assets due to the fact that all of the deals had always one value of one year missing; and Market capitalization since only 29 deals presented figures, most of them classified as banking industry.
To calculate the synergistic value creation after a transaction from financial statements proxies, the following types of synergies were considered:
1 | Operating Synergies
In operating synergies it is possible to consider revenue-enhancement (or sales) synergies, cost-based synergies and investment-based synergies.
Revenue-enhancement synergies comprise the increase in sales due to complementary shared resources, like marketing and distribution channels. To assess this kind of synergies, Huyghebaert & Luypaert (2013) consider the increase in sales in the income statement. Since this financial entry was not available on Zephyr, Operating revenue, that includes other components besides sales, was considered instead.
Cost-based synergies may be observed through the ratio of the difference between predicted Operating expenses and actual Operating expenses31
(residual) over the Turnover of the last year available before the acquisition (Huyghebaert & Luypaert, 2013):