Universidade de Lisboa Faculdade de Farmácia
Phase Solubility and Kinetic Studies of Tacrolimus-Cyclodextrins
Complexes for Future Application in the Treatment of Dry Eye Disease
Beatriz Maria Velez Alves
Mestrado Integrado em Ciências Farmacêuticas
1
Universidade de Lisboa Faculdade de Farmácia
Phase Solubility and Kinetic Studies of Tacrolimus-Cyclodextrins
Complexes for Future Application in the Treatment of Dry Eye Disease
Beatriz Maria Velez Alves
Monografia de Mestrado Integrado em Ciências Farmacêuticas apresentada à Universidade de Lisboa através da Faculdade de Farmácia
Orientador: Professor Doutor Þorsteinn Loftsson, Professor at the University of Iceland Coorientador: Professora Doutora Helena Maria Cabral Marques, Professora Associada, Faculdade de Farmácia da Universidade de Lisboa
2
Resumo
A Síndrome do Olho Seco (Dry Eye Disease, DED) é prevalente em todo o mundo e é definida como “uma doença multifatorial da superfície ocular caracterizada pela perda da homeostasia do filme lacrimal, acompanhada por sintomas oculares. A instabilidade do filme lacrimal e a hiperosmolaridade, a inflamação da superfície ocular e dano na mesma e as anormalidades neurosensoriais têm um papel etiológico.” Alguns dos sintomas são vermelhidão, ardor, sensação de picada, visão turva e sensação de olhos cansados, isto tem um impacto negativo nada vida quotidiana do doente. O DED pode ser controlado com lágrimas artificias, no entanto, alguns doentes precisam de medicação anti-inflamatória, como o tacrolimus. As gotas oftálmicas (colírios) aquosas são a preferência do doente, mas enfrentam três grandes obstáculos: a solubilidade aquosa do fármaco, a rápida eliminação do líquido lacrimal pelo pestanejar e a permeação lenta através das diversas membranas do olho. Para além disso, o tacrolimus tem alguns problemas inerentes às suas características físico-químicas: baixa solubilidade em água e elevado peso molecular o que torna sua biodisponibilidade no olho baixa. É ainda, suscetível de hidrólise, consequentemente tem uma baixa estabilidade em soluções aquosas.
Neste trabalho, as ciclodextrinas (CDs) são apresentadas como uma solução para a formulação de colírios com tacrolimus para o tratamento de DED. As CDs oferecerem várias vantagens e são seguras quando usadas em doses permitidas para aplicação oftálmica. Para além das CDs aumentarem a solubilidade e a estabilidade do fármaco também diminuem possível irritação e o desconforto associado ao mesmo. As CDs têm o potencial para melhorar os colírios convencionais para o segmento anterior e posterior do olho, pois oferecem melhor permeabilidade, mais eficácia, segurança e estabilidade. Neste trabalho são feitos estudos preliminares sobre a complexação do tacrolimus com ciclodextrinas. Começando com estudos de solubilidade de fase com α, HPγ, RMβ-CDs para se perceber os efeitos que as CDs têm na solubilidade do tacrolimus e depois estudos de cinética para determinar os efeitos das CDs na estabilidade do tacrolimus, o tempo de meia vida (t1/2) e o tempo-prateleira (t90). Os resultados obtidos, juntamente com mais
estudos que serão feitos à posteriori, levarão à formulação de um novo colírio com o tacrolimus complexado com CDs para aplicar no tratamento de DED.
Keywords: olho seco; tacrolimus; ciclodextrinas; estudos solubilidade de fase; estudos de cinética
3
Abstract
Dry Eye Disease (DED) is prevalent worldwide and it is defined as “a multifactorial disease of the ocular surface characterized by a loss of homeostasis of the tear film, and accompanied by ocular symptoms, in which tear film instability and hyperosmolarity, ocular surface inflammation and damage, and neurosensory abnormalities play etiological roles”. Some of the symptoms are redness, burning, stinging, blurred vision and ocular fatigue. These have a negative impact on the patient’s daily life. Many patients can control the disease by just using a tear substitute, but others need anti-inflammatory agents, like tacrolimus.
Topical aqueous eye drops would be the patient preferred but face three major obstacles, aqueous solubility, rapid turnover rate of the tear fluid and slow drug permeation trough the membrane barrier makes it difficult. Besides this problems tacrolimus also presents inherent difficulties. It has very poor water-solubility, a high molecular weight which makes it difficult to be bioavailable in the eye. Furthermore, tacrolimus is susceptible to hydrolysis, leading to low stability in aqueous solutions.
Here cyclodextrins (CDs) are present as a solution to the formulation of tacrolimus eye drops for the treatment of DED. CDs are a good solution because they offer several advantages and are safe when used in range of ocular permitted dose. CDs, apart from increasing solubility and stability of drug conceals the drug related irritation and discomfort. CDs have the potential to improve the conventional eye drops to offer better permeation, efficacy, safety and stability in the ophthalmic topical delivery of the anterior and posterior segments.
The preliminary studies of tacrolimus-CD complexes are explored in this work. Starting with the phase solubility studies with α, HPγ, RMβ-CDs to understand the effects that CDs can have on the tacrolimus solubility and then the kinetic studies to determine the effects of the CD in the stability of tacrolimus, the half-life (t1/2), and the shelf-life
(t90). The results obtain, alongside with other studies that will be future done, will lead to
a novel eye drop formulation of tacrolimus-CDs that can be applied in the treatment of DED.
Keywords: dry eye syndrome; tacrolimus; cyclodextrins; phase-solubility studies; kinetic studies
4
Acknowledgments
First, I want to thank to professor Þorsteinn Loftsson and to Manisha Prajapati from the University of Iceland for welcoming me in their lab, for letting me be apart of their investigation project, for teaching me new things and helping me grow as a scientist. At second, I want to thank to professor Helena Maria Cabral Marques, for all the advices on how to proceed with my work, for guiding me to the best path possible.
At third, I want to thank to the special people in my life, the people who helped me accomplish everything that I have now:
The biggest thank you to my Icelandic family, for receiving me as one of their own. You treated me so good, gave me so much love, you made me feel at home so many miles away from my real home. You showed me the beautiful country that Iceland is, and you made me want to come back. My Erasmus was even more special because of you. To you, my beloved Icelandic family, I wish all the best and I hope you know this work was only possible because of you. Thank you so so much!
To my family and my closest friends: Thank You! Millions of thanks, because one will never be good enough. Thank you for being always there when I needed, for giving me the strength to continue day after day. You are my rock and this work is also yours, you made it with me, without you I could never have done it. I will always be here for you too and I will be forever thankful for what you all done for me. Thank you and I adore you.
5
List of Abbreviations
CD: Cyclodextrin
DED: Dry Eye Syndrome DEWS: Dry Eye Workshop
HPβCD: 2-Hydroxypropyl-β-cyclodextrin HPγCD: 2-Hydroxypropyl-γ-cyclodextrin IFN-γ: Interferon- γ
IL-1- IL-6, IL-23: Interleukin-1, Interleukin-6 and Interleukin-23 RMβCD: randomly methylated β-cyclodextrin
TFOS: Tear Film and Ocular Surface Society (TFOS) TNF-α: Tumor Necrosis Factor α
UHPLC: Ultra High-Performance Liquid Chromatography VDT: Visual Display Terminals
αCD: α cyclodextrin βCD: β cyclodextrin
6
List of Figures
Figure 1: Phase-solubility profiles and classification of drug/cyclodextrin complexes
according to Higuchi and Connors………..……….……….14
Figure 2: Solubility phase curve of the α-CD with tacrolimus …….………23
Figure 3: Solubility phase curve of the HP-γ-CD with tacrolimus………24
Figure 4: Solubility phase curve of the RM-β-CD with tacrolimus.………..25
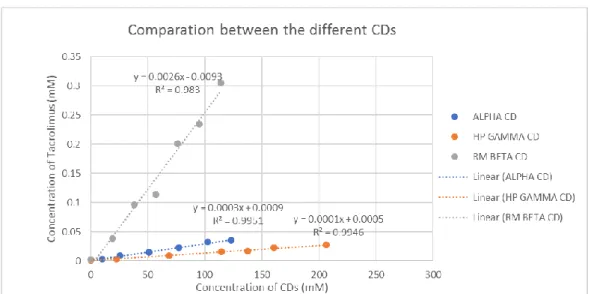
Figure 5: Curves of the difference CDs for comparation…….….….…….….…….…26
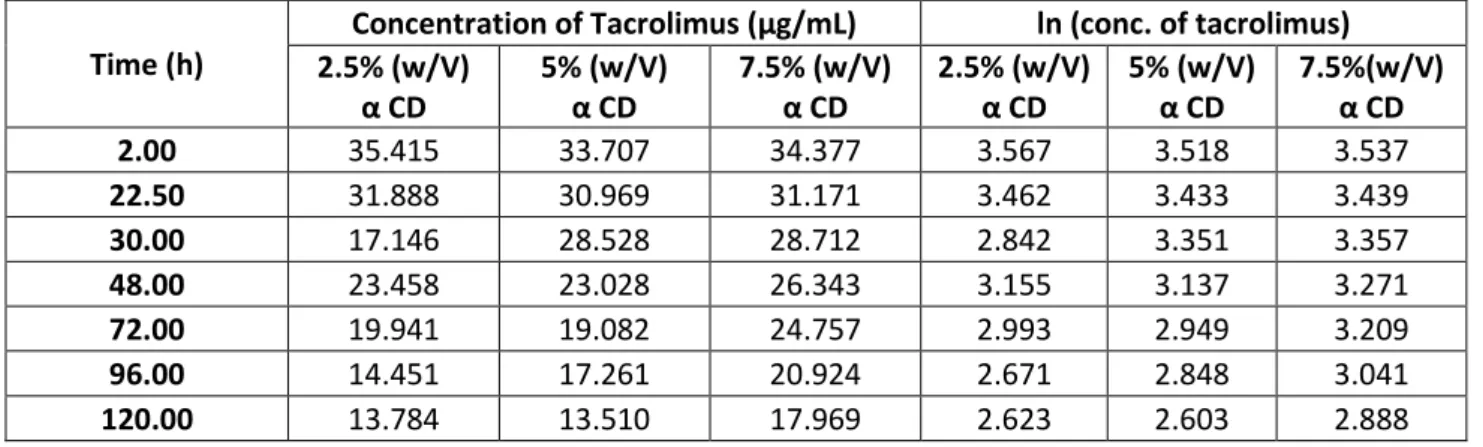
Figure 6: Time vs ln [tacrolimus] for a 2.5% (%w/v) α-CD, pH5.…….………..28
Figure 7: Time vs ln [tacrolimus] for a 5% (%w/v) α-CD, pH 5………...28
Figure 8: Time vs ln [tacrolimus] for a 7.5% (%w/v) α-CD, pH 5……...28
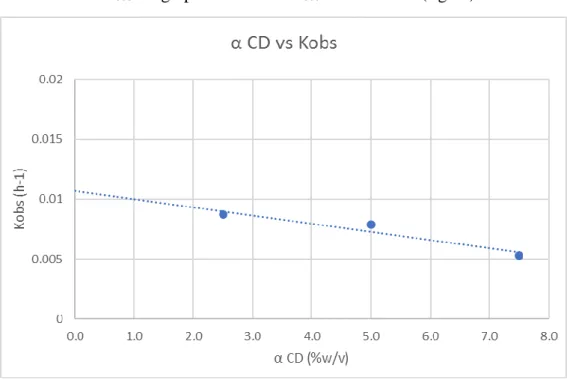
Figure 9: α-CD (%w/v) vs Kobs (h-1), pH 5………...29
Figure 10: α-CD (M-1) vs 1/(kf-kobs), pH 5………..……….30
Figure 11: Time vs ln [tacrolimus] for a 2.5% (%w/v) α-CD, pH 9……...31
Figure 12: Time vs ln [tacrolimus] for a 5% (%w/v) α-CD, pH 9…….………..31
Figure 13: Time vs ln [tacrolimus] for a 7.5% (%w/v) α-CD, pH 9..….……….31
Figure 14: α-CD (%w/v) vs Kobs (h-1), pH 9………...………32
Figure 15: α-CD (M-1) vs 1/(k f-kobs), pH 9……….……….……33
7
List of Tables
Table 1: Result of the area of the peaks for the β CD and the HPβ CD from UHPLC
method for tacrolimus……….……….21
Table 2: Concentration of tacrolimus (µg/mL) obtained from the area of the peaks (table 9)………...…………...21
Table 3: Concentration of α-CD and tacrolimus in mM………..…………...23
Table 4: Concentration of HP-γ-CD and tacrolimus in mM………...………...24
Table 5: Concentration of RM-β-CD and tacrolimus in mM…..……….………...25
Table 6: Values of K1:1 and K1:2 for the different cyclodextrins………..…….………..26
Table 7: Time and Ln of the concentration of tacrolimus, pH 5………..………...27
Table 8: Value of Kobs for the different % (w/v) of CD, pH 5..………..…....29
Table 9: Values of Kobs, Kf and 1/(kf-kobs), pH 5……….…………..….29
Table 10: Time and Ln of the concentration of tacrolimus, pH 9………….…………..30
Table 11: Value of Kobs for the different % (w/v) of CD, pH 9..………. …..32
Table 12: Values of Kobs, Kf and 1/(kf-kobs), pH 9………...…32
Table 13: Half-life and shelf-life, pH 5………..…….34
8
Table of Contents
Abstract ... 3 Acknowledgments ... 4 List of Abbreviations ... 5 List of Figures ... 6 List of Tables ... 7 Introduction ... 9Dry Eye Disease (DED) ... 9
Tacrolimus ... 12
Cyclodextrins ... 13
Materials and Methods ... 18
Materials ... 18
Methods ... 18
Results and Discussion ... 21
Stability studies of Tacrolimus: One day vs Seven days ... 21
Phase Solubility Studies ... 22
α-cyclodextrin ... 23 HP-γ-cyclodextrin ... 24 RMβ-cyclodextrin ... 25 Comparation between α, HPγ, RMβ ... 26 Kinetic Studies ... 27 For pH 5 ... 28 For pH 9 ... 31
Comparation between the pH 5 and pH 9, half-life and shelf-life ... 34
Conclusion ... 37
Bibliography ... 39
9
Introduction
Dry Eye Disease (DED)
Dry Eye Disease (DED) is prevalent worldwide and was defined by the Tear Film and Ocular Surface Society (TFOS) Dry Eye Workshop (DEWS) II, in 2017, as “a multifactorial disease of the ocular surface characterized by a loss of homeostasis of the tear film, and accompanied by ocular symptoms, in which tear film instability and hyperosmolarity, ocular surface inflammation and damage, and neurosensory abnormalities play etiological roles” (1).
Until 2007, when the first TFOS DEWS published the first definition of DED, there were variations in the definition of the disease, this as well as variations in the study of populations, geographical differences and differences in method caused large differences in prevalence figures (2), but population-based studies show a prevalence of symptomatic dry eye ranging from 6 to 52% (3). The symptoms of dry eye are: redness, burning, stinging, foreign body sensation, pruritus, photophobia, lacrimation, blurred vision and ocular fatigue. (2,4,5). These have a negative impact on the patient’s visual function and ability to perform daily visual tasks (6), like the capacity of the patient to read, to be at the computer or to drive reducing significantly the drivers reaction time (2). So DED diminish quality of life and work productivity (3).
The pathogenic mechanism remains unclear but is well known that inflammation has a very important role. DED is an inflammatory disease that has many features in common with autoimmune disease (2). Tear instability is accompanied by increased tear osmolarity, which activates stress signalling pathways in the ocular surface epithelium and resident immune cells and triggers production of innate inflammatory molecules, that lead to further decline in tear function and worse symptoms (4). Proinflammatory cytokines, chemokines, and matrix metalloproteinases are present and lead to the expansion of autoreactive T helper cells which infiltrate the ocular surface and lacrimal gland (2). Many of the mechanisms to maintain ocular surface and glandular homeostasis are disrupted in dry eye (4). DEDis a vicious self-perpetuating cycle, that is initiate or amplify by the risk factors.
DED affects more women (70%) (menopause is often cited as an etiologic factor (7)) and people aged over 50 (8). As multifactorial disease has numerous risk factors that can be divided in extrinsic and intrinsic, being the most important: use of contact lenses,
10
extended times at the computer and in places with air conditioning, places with increased air pollution (people in metropolitan areas with high air pollution are 3 to 4 times more likely to have dry eyes as compared to rural areas) and increased atmospheric pressure,
Sjögren’s Syndrome (main disease that causes dry eye), arthritis, osteoporosis, allergies,
thyroid disease, severe headaches or migraine in the previous three months, history of head injury and use of some medications (including antihistamines, paracetamol, benzodiazepines, antidepressants, and steroids). There is no association between a history of smoking or alcohol consumption and DED (8). As it is easily understandable by the risk factors, the sedentary occupations and jobs associated with VDT use show the highest prevalence of symptomatic dry and there is a lower risk in outdoor and active occupations, even when corrected for comorbidities and contact lens use. So, the associationbetween the type of occupation and symptomatic dry eye is clear. This makes the occupation of the patient a very important part of the diagnosis of dry eye (3).
The correct diagnosis of dry eye disease is crucial so the proper treatment can be initiated, since the medication for the other diseases that are easily confused with DED by the similarly of the symptoms, like infections and allergies, can worse the symptoms and prejudicated the prognostic (2). The first part of the diagnostic consists in standardized questionnaires in order to know the history of the patients and identify possible risk factors. After there are a number of tests that can be done like: biomicroscopy, schirmer’s test, breakup time of the tear film (BUT), vital dyes (lissamine green 2 %, rose bengal 1 %, fluorescein 1 %), test of the leaf fern, test of the corneal sensitivity, conjunctival impression cytology, optical coherence tomography (OCT), tear osmolarity measurement) (8).
The treatment is of extremely importance since untreated patients have risk of ocular infection, corneal ulceration and blindness (8). Since DED is an inflammatory multifactorial disease the treatments aimed to address all the factors: starting on inhibiting ocular surface inflammation and enhancing tear film stability, reducing tear osmolarity, maintaining corneal homeostasis and relieving ocular irritation (5). DED is a chronic disease, so treatment as to be long-term making the patient education a very important part to obtain good results (2). The patient should know that the first step of the algorithm of dry eye treatment is avoidance of risk factors, such as dry heating air, air conditioning and prolonged times in the computer without breaks. Is also important in the first step the identification of medication that can be causing DED so it can be altered or eliminated and added omega fatty acid supplementation, because they block proinflammatory
11
eicosanoids and reduce cytokines trough anti-inflammatory activity (2), and ocular lubricants, lid hygiene and warm compresses (9). Ocular lubricants are solutions containing electrolyte, surfactants and viscosity agents, sodium hyaluronate solutions are considered the gold standard artificial tear treatment (7). They are the mainstay of therapy in all stages of DED, either alone (in mild-to-moderate disease) or in combination with other treatments (in moderate-to-severe disease) (6). Many patients can control the disease by just using tear substitute, but in some cases, the symptoms and complaints persist despite the proper use of the medication. These patients have a more severe stage of the disease so they need to advance in the algorithm of the treatment (8). This algorithm includes: topical cyclosporine and lifitegrast, although they better the symptoms, they are not effective in all patients, topical corticosteroids (fluorometholone, clobetasone, loteprednolol, and methylprednisolone) also shown efficacy in treating chronic dry eye and preventing irritation, however long-term use carries risk of cataract and glaucoma (4), oral tetracyclines (doxycycline and minocycline) are also used, but it has to be in a low dosage because of the gastrointestinal and skin adverse effects, topical macrolides (azithromycin) are part of the treatment too (2).
At the moment liftegrast is the only drug approved by the FDA for treating the symptoms of DED (10), for patient with severe dry eye disease or patient who are intolerant to cyclosporine, other options are now being tested: new topical immunomodulators, such as tacrolimus, tofacitinib and IL 1 receptor inhibitor (8).
12
Tacrolimus
Tacrolimus is a 23-memberd macrolide lactone, originally isolated from the bacterium Streptomyces tsukubaensis (11). Tacrolimus binds to the immunophilin protein FKBP12 (FK-506 binding protein) forming a complex, this complex will inhibit the activation of calcineurin. The inhibition of calcineurin will lead to the inhibition of the transcription factor NF-AT, that regulates the production of proteins required for T cell activation and differentiation, thus T-cell activation will be reduce (11,12). Some of the inflammatory molecules inhibit are: IL-1, IL-6, IL-23, TNF-α and IFN-γ and adhesion molecules, which are all present in the inflammatory vicious cycle of DED (14). Tacrolimus is 50-100 times more potent than cyclosporine A (15), another drug commonly used to treat DED.
Topical aqueous eye drops are the patient preferred (16), but the passive drug diffusion, the main form of transport of drugs in the eye, is hampered by three major obstacles: aqueous drug solubility,rapid turnover rate of the tear fluid and the consequent decrease in concentration of dissolved drug molecules and slow drug permeation trough the membrane barrier (17). Only 2-5% of the applied dose is actually available for the intraocular tissues (18). Adding to this tacrolimus is a highly lipophilic drug (log P=3.3) and it has a very poor water-solubility of 1-2 µg/ml making it difficult to permeate through the tear film (19) meaning it can’t be transported from its site of administration to its site of action, so poor water-solubility results in poor bioavailability (13,14,16). Tacrolimus also has a relatively high molecular weight (804 g/mol) which complicates the transport across cornea and conjunctiva (14). All of this physico-chemical characteristics of tacrolimus alongside with physiological and anatomical constraints of the eye make it difficult to obtain therapeutic concentrations of tacrolimus in the intraocular regions of the eye (14). Furthermore, tacrolimus is susceptible to hydrolysis, leading to low stability in aqueous solutions (15).
No ophthalmic dosage formulations of tacrolimus are commercially available (11), they are being elaborated in the pharmacies of the hospital and they are prepared with vehicles with short retention time in corneal surface and consequently the need of frequent to obtain a sustainable benefit (13), so there is a need for formulations of tacrolimus in the market.
13
Cyclodextrins
Cyclodextrins (CDs) are a group of structurally related natural products formed during bacterial digestion of cellulose (21). CDs are cyclic oligosaccharides consisting of (α-1,4)-linked D-glucopyranose units. αCD, βCD and γCD are the most common natural CDs, they consist of 6, 7 and 8 D-glucopyranose units, respectively (22).
The natural CDs have derivatives, the most common are: hydroxypropyl-β- and γ-CD, randomly methylated β-CD, and sulfobutylether β-CD, each bringing some improved properties such as enhanced aqueous solubility (10), since the aqueous solubility of the natural CD is limited (21). Both, natural CDs and their derivatives are used in pharmaceutical products (22).
The cyclic CD molecules are like truncated cones with the secondary hydroxy groups on the wider side and the primary hydroxy groups on the narrower side (23). The CD cavity creates a lipophilic environment in aqueous solutions where small lipophilic molecules and lipophilic moieties of larger ones can enter to form inclusion complexes. There are no covalent bonds formed or broken during the inclusion and the interactions responsible for complex formation are relatively weak non-covalent interactions such as van der Waals forces, hydrophobic interactions and hydrogen bonds (23).
In aqueous solutions the complexes are in a dynamic equilibrium with free guest and host molecules where the inclusion complexes are constantly being formed and dissociated with a half-life of few milliseconds or less (16). Addition of an excess amount of the drug to an aqueous CD solution, makes possible the formation of complexes in a solution. A suspension is formed that is maintained in equilibrium for periods of up to one week at the desired temperature, after is filtered or centrifuged to form a clear drug/CD complex solution. To obtain solid complexes, the water is removed by evaporation or sublimation e.g. spray drying or freezedrying. There are other methods that can also be used like kneading and slurry methods, co-precipitation, neutralization, and grinding techniques (24).
Inclusion complexes formation have been studied by numerous of physicochemical methods (e.g. spectroscopic methods, fluorescence spectroscopy, circular dichroism spectroscopy) (22), the most widely used is the phase-solubility method described by Higuchi and Connors in 1965, which examines the effect of a solubilizer, i.e. CD or ligand, on the drug being solubilized, i.e. the substrate (25). In a phase-solubility study the drug (i.e. the substrate) solubility in moles/liter is plotted
14
against the molar CD (i.e. the ligand) concentration. From the curve obtained is possible to understand the effects CDs has on the drug solubility and classified them in profiles (22).
Phase-solubility diagrams indicate the formation of soluble or poorly soluble complexes, according to that, they are categorized into A or B types:
- A type curves: soluble inclusion complexes, the solubility of the drug increases with increasing CD concentration.
o AL: linear increases of drug solubility as a function of CD concentration,
complex is first order with respect to the ligand and first or higher order with respect to the substrate that is formation of, for example, 1:1, 2:1 or 3:1 drug/CD complexes.
o AP: positively deviating isotherms, the complex is first order with respect
to the substrate, but second or higher order with respect to the ligand. o AN: negatively deviating isotherms, can be due to changes in the aqueous
media.
The non-linearity of the AP and AN-type phase-solubility profiles can be due to
changes in the drug/ CD complex stoichiometry, the drug/CD ratio increasing (AP
-type) or decreasing (AN-type) with increasing CD concentration.
- B type curves: inclusion complexes with poor solubility. o BS: complexes with limited solubility.
o BI: insoluble complexes.
-
- Figure 1: Phase-solubility profiles and classification of drug/cyclodextrin complexes according to Higuchi and Connors. This pictured was taken from Jansook P et al: Cyclodextrins : structure , physicochemical
15
In general, the water-soluble CD derivatives form A-type phase-solubility profiles whereas the less soluble natural CDs frequently form B-type profiles (22).
1:1 drug/CD complex (D/CD) is the most common type of CD complex. One drug molecule (D) forms a complex with one CD molecule (CD) (22):
𝐷 + 𝐶𝐷 𝐾1:1↔ 𝐷/𝐶𝐷 (1)
From this equation, obtained from an AL-type phase-solubility diagram, is possible to
calculate the Stability Constant of the complex (K1:1).
𝑘1:1=
𝑠𝑙𝑜𝑝𝑒 𝑆0(1 − 𝑠𝑙𝑜𝑝𝑒)
(2)
K1:1 is calculated from the slope (less than unity, obtain from the diagram) and the
Apparent Intrinsic Solubility (S0) of the drug in the aqueous complexation media, i.e. drug
solubility when no CD is present.
When one additional CD molecule forms a complex with an existing 1:1 complex, it is obtained a 1:2 drug/complexes (one drug molecule forms a complex with two CD molecules). This is the stoichiometry of higher order more common. In this case the diagram is AP-type and the stoichiometry of the system is proved by curve fitting of the
diagram with a quadratic model:
[𝑆𝑡] − [𝑆0] = 𝑘1:1[𝑆0][𝐶𝐷] + 𝑘1:1𝑘1:2[𝑆0][𝐶𝐷]2 (3)
where [CD] is the concentration of free CD and [St] is the total amount of free drug. [CD]
is customary to plot the [St] against the total amount of CD in solution [CD]t it is assumed
that the extent of complexation is low so [CD] ~ [CD]t (22).
There are various factors that affect the formation of the inclusion complexes, among them are: the type of CD (the cavity size of CD should be suitable to accommodate the drug molecule), temperature (in most cases, higher the temperature decreases the magnitude of the apparent stability constant of the drug/CD complex result of possible reduction of drug/CD interaction forces), method of preparation which depends on the nature of the drug and CD (25). The dissociation of drug/CD complexes depends on the binding of drugs to precorneal proteins, absorption by corneal tissue, and displacement of drugs from CD complexes by precorneal fluid components. Since only the free drug
16
can permeate biological membranes, ophthalmic delivery of drugs can be limited by the dissociation of drug/CD complexes in the precorneal area due to the limited dilution in this area (25).
CDs increase drug solubility, dissolution, and drug permeability thus enhance the bioavailability of insoluble drugs (25), being a good option to use with tacrolimus. Furthermore, CDs can improve the stability of several labile drugs against dehydration, hydrolysis, oxidation and photodecomposition and thus increase the shelf life of drugs (25). Kinetic studies help understand the effect of CD complexation on the chemical stability of a drug, by calculating the observed first order rate constants it is possible to determine the extent of hydrolysis (23).
If 1:1 drug/CD complex is formed and if the drug degradation follows first-order kinetics both in the free form and within the complex then the following kinetic pathways are present (23):
where K1:1 is the equilibrium constant for the complex formation (sometimes referred to
as the stability constant), kf is the observed first-order rate constant for the degradation of
the free drug (D) and kc represents the observed first-order rate constant for the drug
degradation within the complex (D/CD). The observed first-order rate constant (kobs) for
the drug degradation in the aqueous complexation medium is the weighted average of kf
and kc
𝑘𝑜𝑏𝑠 =
𝑘𝑓+ 𝑘𝑐 ∙ 𝑘1:1∙ [𝐶𝐷]𝑇 1 + 𝑘1:1∙ [𝐶𝐷]𝑇
(4)
where [CD]T is the total concentration of dissolved CD in the aqueous complexation
medium, assuming that the total CD concentration is much greater than the total drug concentration (i.e. [CD]T >> [D]T and [CD] ≈ [CD]T) (23). The value of kf is determined
in the complexation medium when no CD is present. K1:1 and kc are then obtained by
determining kobs at fixed drug concentration with different CD concentrations and
non-linear fitting of the values thus obtained to Eq. (4). Alternatively, K1:1 and kc can be
obtained through linear fitting such as Lineweaver-Burk plot (23): 𝐷 + 𝐶𝐷 𝐾1:1↔ 𝐷 𝐶Τ 𝐷
𝑘𝑐 𝑘𝑓
17 1 𝑘𝑓− 𝑘𝑜𝑏𝑠 = 1 𝑘1:1(𝑘𝑓− 𝑘𝑐) ∙ 1 [𝐶𝐷]𝑇 + 1 𝑘𝑓− 𝑘𝑐 (5)
Plot of (kf−kobs)-1 versus ([CD])-1 gives straight line from which kc can be obtained
from the intercept and K1:1 from the slope. In most cases, the complexation with CDs
stabilizes the drug, but it can also happen that complexation is prejudicial for the stability of the drug. So, if kc< kf the CD complexation stabilizes the drug and increases the
shelf-life of the drug product, if kc > kf the CD complexation accelerates the drug degradation (23).
For drug delivery into the eye be successful a delivery system must address all three obstacles: increase drug solubility in the aqueous tear film, increase the contact time of the drug with the eye surface and increase drug partition into and then drug permeation through the lipophilic membrane barriers (i.e. cornea and conjunctiva). CDs are a good option since they improve solubility of lipophilic drugs with limited solubility in aqueous formulations such as eye drops, reduce irritation after topical administration to the eye and enhance chemical stability of drugs in aqueous eye drop formulations (24) .
The work present here is part of an investigation project whose final goal is to obtain aqueous eye drop formulation with tacrolimus so it can be part of a better treatment in DED.
18
Materials and Methods
Materials
Tacrolimus for the validation was purchased from Sigma-Aldrich (St. Louis, MO) and tacrolimus for the other studies was purchased from Huichem (Shanghai, China). Alpha cyclodextrin (αCD), Beta cyclodextrin (βCD), 2-Hydroxypropyl-β-cyclodextrin (HPβCD) and 2-Hydroxypropyl-γ-cyclodextrin (HPγCD) were acquired to Janssen Pharmaceutica (Beerse, Belgium). The randomly methylated β-cyclodextrin (RMβCD) was acquired from Wacker Fine Chemicals (Munich, Germany). Milli-Q water (Millipore, Billerica, MA) was used for preparation of all solutions and the mobile phase for UHPLC measurement. Citric acid used for the preparation of the pH 5 buffer was purchased from Fluka Analytical (Honeywell, Charlotte, EUA) and citrate dehydrate also used for the preparation of this buffer was purchased from Merck (Kenilworth, EUA). Carbonate and sodium bicarbonate used for the preparation of the pH 9 buffer were purchased from Fluorochem Ltd. (Derbyshire, United Kingdom). Acetonitrile and methanol were purchased from Honeywell (Charlotte, EUA). TFA was purchased from Sigma-Aldrich (St. Louis, MO). Syringe Filters PTFE with pore size of 0.45 µm were purchased from Phenomenex (Cheshire, UK). The sonicate bath used was Branson 5800 from Branson Ultrasonics, the shaker KS-15 from Edmund Buhler GmbH, the pH meter was Orion 3 Star from Thermo Fisher Scientific and Dri-Block DB.3D heater from Techne.
Methods
Stability Studies
Were performed in aqueous β CD solution of 2% (w/v) and in aqueous HPβ CD solution of 5% (w/v). 2 mg of tacrolimus were weighted into vials (6 vials) to which was added 5 mL of the cyclodextrin solution. The vials were then sonicated for 1h followed by pH measure. The pH should be between 4 and 6, because previous studies showed this is the interval where the drug is most stable, in cases where the pH was not in this interval it was adjusted with 0.1M of HCl or 0.1 M of NaOH. The vials were then put in the shaker: three vials for 7 days and other three for 1 day. After this time the solution was filtered and analysed for tacrolimus in duplicates by reverse-phase UHPLC method.
19 Phase Solubility Studies
The phase solubility studies were performed in aqueous CDs solutions at various concentrations. For the α CD the concentrations were: 0%, 1%, 2.5%, 5.0%, 7.5%, 10%, 12% (w/v). For the HPγCD were: 0%,5%, 15%, 25%, 30%, 35%, 45% (w/v). For the RMβCD were: 0%, 2.5%, 5%, 7.5%, 10%, 12.5%, 15% (w/v). 2 mg of tacrolimus were weighted into vials (21 vials, 3 for each CD concentration) to which was added 5 mL of the CD solution. The vials were then sonicated for 1h and followed by pH measure. The pH should be between 4 and 6, because previous studies showed this is the interval where the drug is most stable, in cases where the pH was not in this interval it was adjusted with 0.1M of HCl or 0.1 M of NaOH. The vials were put in the shaker for 24 h based on the results obtained from the degradation studies. After the solutions were filtered and then analysed for tacrolimus in triplicates by reversed phase UHPLC method.
Kinetic Studies
The kinetic experiments were performed in aqueous CD buffer solutions with 2.5%, 5% and 7.5% (w/v) αCD. The buffer systems used were 0.1 M citric acid / 0.1 M citrate dehydrate (pH 5) and 0.1 M carbonate / 0.1M sodium bicarbonate (pH 9). Triplicates of which CD concentration were heated in the Dri-Block® until 40 ºC followed by the confirmation of the pH which should be the same as the buffer used to prepare the CD solution.
After this procedure 100 µL of stock tacrolimus solution (2 mg/mL) were added to the 4900 µL aqueous buffer solutions of CD previously heated. Samples of 250 µL were taken to UHPLC vials and diluted with 500 µL for the pH 5 and 250 µL for the pH 9 of ACN:H2O (1:1) and the degradation rate was followed by monitoring the remaining drug
concentration by reversed phase UHPLC method. For the pH 5 the first sample was taken 2 h after adding the tacrolimus then 22 h and 30 h after and then every 24 h until 120 h after the addition. For the pH 9 the first sample was taken 2 min after adding the tacrolimus, 5 min after and then every 5 min until 30 min after the addition.
20 UHPLC Analysis
In all the studies performed a quantitative determination of tacrolimus was made by UHPLC analysis. This analysis was performed on a reversed phase ultra-high-performance liquid chromatographic component system from Thermo Fisher Scientific Vanquish HPLC system consisting of VF-P10-A pump, a VF-A10-A autosampler, a VWD-3100 UV-Vis detector and a Kinetex 1,7 µm C18, 100 Å, 100 x 21 mm column (Phenomenex, UK). The mobile phase consisted of acetonitrile (60%) and 0.1% TFA (40%). The UV wavelength was 205 nm, column temperature was 50 ºC, flow rate was 0.4 mL/min, sample injection was 25 µL and the retention time was 3.4 min. 10% methanol and Milli-Q water were used to clean the UHPLC system. The method of analysis was previously validated.
21
Results and Discussion
Stability studies of Tacrolimus: One day vs Seven days
The stability studies of tacrolimus with β CD and HPβ CD were performed in order to choose which was the best CD to perform the phase solubility studies: if 7 days or 1 day in the shaker.
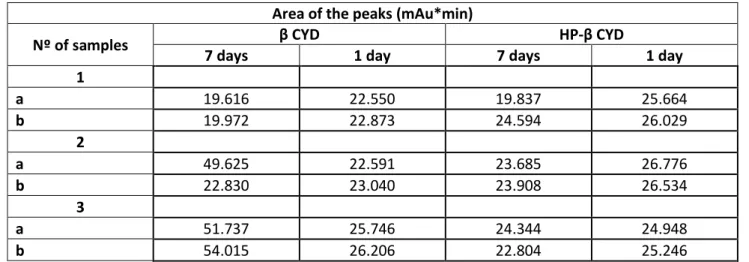
Table 1: Result of the area of the peaks for the β CD and the HPβ CD from UHPLC method for tacrolimus
Area of the peaks (mAu*min)
Nº of samples β CYD HP-β CYD
7 days 1 day 7 days 1 day
1 a 19.616 22.550 19.837 25.664 b 19.972 22.873 24.594 26.029 2 a 49.625 22.591 23.685 26.776 b 22.830 23.040 23.908 26.534 3 a 51.737 25.746 24.344 24.948 b 54.015 26.206 22.804 25.246
Table 2: Concentration of tacrolimus (µg/mL) obtained from the area of the peaks (table 9)
Concentration of tacrolimus (µg/mL)
Nº of samples β CYD HP-β CYD
7 days 1 day 7 days 1 day
1 a 20.993 24.124 21.228 27.447 b 21.373 24.468 26.244 27.837 2 a 53.016 24.167 25.335 28.634 b 24.423 24.647 25.513 28.375 3 a 55.270 27.535 26.038 26.683 b 57.701 28.026 24.334 27.001
22
The concentrations of tacrolimus are higher in the 1 day in the shaker when compared with the concentration from the 7 days, showing that tacrolimus remains stable for 24 h.
For this reason, the phase solubility studies were done with tacrolimus on aqueous solution with CD in the shaker for 24 h to obtain complexes.
Phase Solubility Studies
The phase solubility studies serve to study the inclusion complexation of the tacrolimus with the CDs and show the solubilizing ability of the CD and the stability constant of the complexes formed. The phase solubility studies were done with three CDs: αCD, HPγCD, RMβCD. The correlation coefficient squared values (R2) for the solubility
curves were calculated to distinguish between AP and AL types. The solubility curve with
R2 values >0.990 was regarded as a straight line (AL type) and that with R2 values <0.990
23 α-cyclodextrin
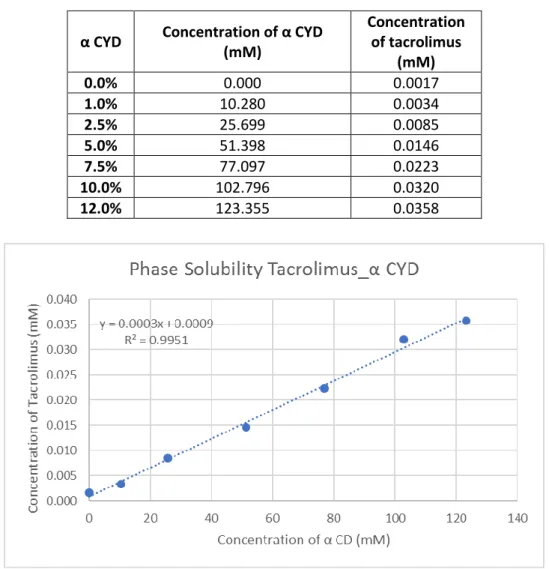
Table 3: Concentration of alpha-CD and tacrolimus in mM
This curve gave a R2 of 0.9951 so it was considered as AL type and from
this graphic was possible to calculate the K1:1 value:
𝐾1:1= 𝑠𝑙𝑜𝑝𝑒
𝑆0(1−𝑠𝑙𝑜𝑝𝑒)=
0.0003
0.0009(1−0.0003)= 0.3334 𝑚𝑀 -1 α CYD Concentration of α CYD
(mM) Concentration of tacrolimus (mM) 0.0% 0.000 0.0017 1.0% 10.280 0.0034 2.5% 25.699 0.0085 5.0% 51.398 0.0146 7.5% 77.097 0.0223 10.0% 102.796 0.0320 12.0% 123.355 0.0358
24 HP-γ-cyclodextrin
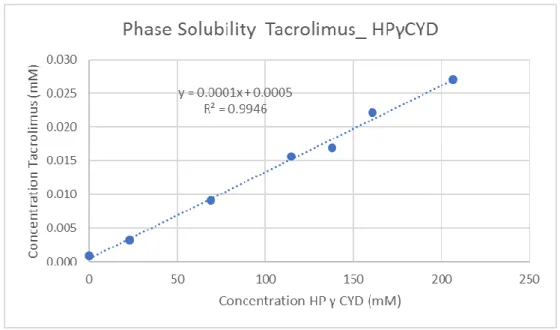
Table 4:Concentration of HPgamma-CD and tacrolimus in mM
Figure 3: Solubility phase curve of the HP-gamma-CD with tacrolimus
This curve gave a R2 of 0.9946 so it was considered as AL type and from
this graphic was possible to calculate the K1:1 value:
𝐾1:1 = 𝑠𝑙𝑜𝑝𝑒
𝑆0(1−𝑠𝑙𝑜𝑝𝑒)=
0.0001
0.0005(1−0.0001)= 0.2000 𝑚𝑀 -1
HP γ CYD Concentration of HP β CYD (mM) Concentration of tacrolimus (mM)
0.0% 0.000 0.001 5.0% 22.957 0.003 15.0% 68.871 0.009 25.0% 114.784 0.016 30.0% 137.741 0.017 35.0% 160.698 0.022 45.0% 206.612 0.027
25 RMβ-cyclodextrin
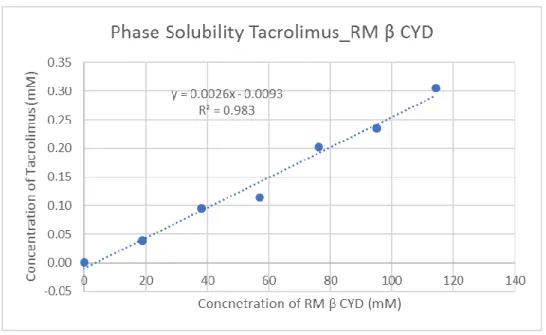
Table 5: Concentration of RMbetta-CD and tacrolimus in mM
RM β CYD Concentration of RM β CYD (mM) Concentration of tacrolimus (mM)
0.0% 0.000 0.002 2.5% 19.055 0.038 5.0% 38.110 0.096 7.5% 57.165 0.114 10.0% 76.220 0.202 12.5% 95.274 0.234 15.0% 114.329 0.305
Figure 4: Solubility phase curve of the RM-betta-CD with tacrolimus
Since this curve gave a R2 of 0.9886 it was considered A
P type and it was analysed
according to the optimization technique to obtain the stability constants of higher-order complexes (K1:n). Therefore, the solubility curve was analysed according to both 1:1 and 1:2 models (26): [St] = K1:1 [S0][CD] + K1:1K1:2 [S0][CD]2 + [S0] K1:1= 1.1176 mM-1 K1:2= 0.0032 mM-1 S0: 0.0017 K1:1[S0]: 0.0019 K1:1K1:2[S0]: 0.000006
26 Comparation between α, HPγ, RMβ
Table 6: Values of K1:1 and K1:2 for the different CDs complexes
Figure 5: Curves of the difference CDs for comparation
In aqueous media tacrolimus molecules bound in a CD complex are in dynamic equilibrium with unbound molecules, and tacrolimus/CD complexes are constantly being dissembled and formed again. The K1:1 values for lipophilic and poorly water-soluble
drugs, like tacrolimus, are normally within the range 102 to 103M-1 (22). This is confirmed by the results obtained. Although the CD derivatives have better solubilizing potential when compared with natural CDs, since the attachment of the substituents disrupts the regular hydrogen bonding network increasing their ability to interact with the surrounding water molecules resulting in an increasing aqueous solubility (27), here HP γ CD has a low K1:1 (M-1). This may be due to steric hindrance of the substituent groups because
tacrolimus is a rather voluminous molecule (26).
CD K1:1 (M-1) K1:2 (M-1)
α 333.43 ----
HP γ 200.00 ---
27
The low value for the α CD may be because natural CDs have tendency to self-assemble in aqueous solutions to form aggregates (27). At more elevated concentrations of CD these aggregates can become large and precipitate as solid microparticles, reducing the formation of complexes with tacrolimus. It can also be because the cavity of α CD is small (Cavity diameter (Å) 4.7–5.3) (27) when compared to the others CD present here for a large molecule like tacrolimus.
RM β CD had the higher K1:1 when compared with both α CD and HP γ CD. And
the values of K1:1 are markedly higher than K1:2, so the 1:1 complex appears to be more
stable. The RM β CD has the greatest solubilizing activity through the formation of a stable complex in a molar ratio of 1:1(26).This means that the cavity of the RM β CD fits the tacrolimus molecule better than the other CDs, so RM β CD has the capacity to enhanced the solubility of tacrolimus (25). Although others studies also suggest the capacity of α CD to increase the intrinsic solubility of tacrolimus (28).
Kinetic Studies
The kinetics studies aimed to compare the degradation of tacrolimus with different CDs, to see which one would stabilize tacrolimus more. The results present in this work correspond to the evaluation of α CD. Through the equation (eq. 4) present in the kinetic introduction to calculate de degradation rate constants at different pH (kobs), as well as the
values of kf and kc. By establishing the relationship between them it is possible to know
if the hydrolysis of tacrolimus in the chosen pH (5 and 9) is faster or slower when complexed with CD or when tacrolimus is as a free drug.
The pH 5 and the pH 9 were chosen because they represent an acid medium and a basic medium. Previous studies, found that degradation of tacrolimus is pH dependent and is facilitated at higher pH values (11) this justified the time for sampling. Since the degradation at the pH 9 is faster the sampling time was shorter.
28 For pH 5
To obtain the value of kobs it is necessary to get the graphs of time vs ln
concentration tacrolimus for the different concentrations of α CD (fig. 5-7)
Table 7:Time and Ln of the concentration of tacrolimus, pH 5
Time (h)
Concentration of Tacrolimus (µg/mL) ln (conc. of tacrolimus) 2.5% (w/V) α CD 5% (w/V) α CD 7.5% (w/V) α CD 2.5% (w/V) α CD 5% (w/V) α CD 7.5%(w/V) α CD 2.00 35.415 33.707 34.377 3.567 3.518 3.537 22.50 31.888 30.969 31.171 3.462 3.433 3.439 30.00 17.146 28.528 28.712 2.842 3.351 3.357 48.00 23.458 23.028 26.343 3.155 3.137 3.271 72.00 19.941 19.082 24.757 2.993 2.949 3.209 96.00 14.451 17.261 20.924 2.671 2.848 3.041 120.00 13.784 13.510 17.969 2.623 2.603 2.888
29
Figure 6: Curve of time vs ln [tacrolimus] for a 2.5% (%w/v) alpha CD, pH 5
Figure 7: Curve of time vs ln [tacrolimus] for a 5% (%w/v) alpha CD, pH 5
30
Applying the equation 10 the value of Kobs it is taken from the graphic equation, being
Kobs the slope.
Table 8: Value of Kobs for the diferent % (w/v) of CD, pH 5
α CD conc. (%w/v) Kobs (h-1)
2.5 0.0087
5 0.0079
7.5 0.0053
With the values of Kobs the graph of α CD vs Kobs was obtained (fig.11)
Figure 9: Graph of alpha CD (%w/v) vs Kobs (h-1), pH 5
From this graphic it is perceptible that at the pH 5, the addition of α CD to the reaction medium decreases the observed degradation rate. The value of kf is 0.0107 h-1,
from this value is possible to plot a graph of α CD vs 1
𝑘𝑓−𝑘𝑜𝑏𝑠.
Table 9: Values of Kobs, Kf and 1/(kf-kobs), pH 5
α CD conc. (%w/v) α CD conc. (M-1) K
obs (h-1) Kf (h-1) 1/(Kf-Kobs)
2.5 38.912 0.0087 0.0107 500.00
5 19.456 0.0079 0.0107 357.14
7.5 12.971 0.0053 0.0107 185.19
31
Figure 10: Graphic of alpha CD (M-1) vs 1/(kf-kobs), pH 5
This graph enables the calculation of K1:1 and kc:
K1:1= 𝑖𝑛𝑡𝑒𝑟𝑐𝑒𝑝𝑡 𝑠𝑙𝑜𝑝𝑒 =7.7212 M -1 Intercept= 𝐾𝑓−𝐾𝑐1 → Kc= 0.001042 h-1 For pH 9
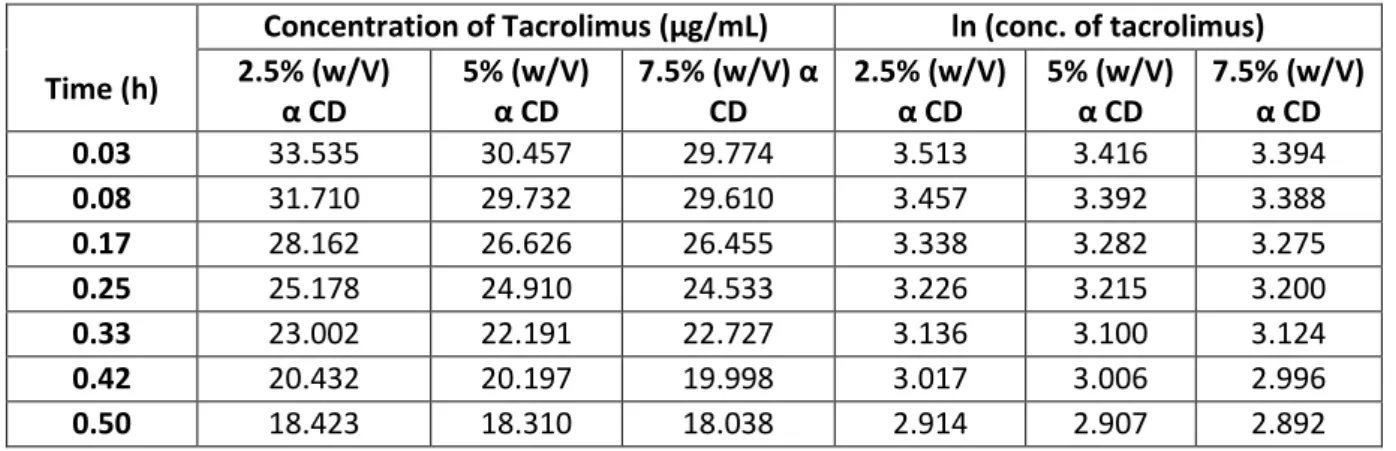
To obtain the value of kobs it is necessary to get the graphs of time vs ln
concentration tacrolimus for the different concentrations of α CD (fig. 10-12)
Time (h)
Concentration of Tacrolimus (µg/mL) ln (conc. of tacrolimus) 2.5% (w/V) α CD 5% (w/V) α CD 7.5% (w/V) α CD 2.5% (w/V) α CD 5% (w/V) α CD 7.5% (w/V) α CD 0.03 33.535 30.457 29.774 3.513 3.416 3.394 0.08 31.710 29.732 29.610 3.457 3.392 3.388 0.17 28.162 26.626 26.455 3.338 3.282 3.275 0.25 25.178 24.910 24.533 3.226 3.215 3.200 0.33 23.002 22.191 22.727 3.136 3.100 3.124 0.42 20.432 20.197 19.998 3.017 3.006 2.996 0.50 18.423 18.310 18.038 2.914 2.907 2.892
32
Figure 11: Curve of time vs ln [tacrolimus] for a 2.5% (%w/v) alpha CD, pH 9
Figure 12: Curve of time vs ln [tacrolimus] for a 5% (%w/v) alpha CD, pH 9
33
Applying the equation 10 the value of Kobs it is taken from the graphic equation, being
Kobs the slope.
Table 11: Value of Kobs for the diferent % (w/v) of CD
α CD conc. (%w/v) Kobs (h-1)
2.5 1.289
5 1.115
7.5 1.098
With the values of Kobs is done the graph α CD vs Kobs: (fig.13)
Figure 14: Graph of alpha CD (%w/v) vs Kobs (h-1), pH 9
From this graphic it is perceptible that at the pH 9, the addition of α CD to the reaction medium also decreases the observed degradation rate. The value of kf is 1.62h-1,
from this value is possible to plot a graph of α CD vs 1
𝑘𝑓−𝑘𝑜𝑏𝑠.
Table 102: Values of Kobs, Kf and 1/(kf-kobs)
α CD conc. (%w/v) α CD conc. (M-1) k
obs (h-1) Kf (h-1) 1/(kf-kobs)
2.5 38.912 1.289 1.62 3.022
5 19.456 1.115 1.62 1.979
7.5 12.971 1.098 1.62 1.916
34
Figure 15: Graph of alpha CD (M-1) vs 1/(kf-kobs), pH 9
This graph enables the calculation of K1:1 and kc: K1:1= 𝑖𝑛𝑡𝑒𝑟𝑐𝑒𝑝𝑡
𝑠𝑙𝑜𝑝𝑒 =27.263 M-1
Intercept= 𝐾𝑓−𝐾𝑐1 → Kc= 0.4065 h-1
Comparation between the pH 5 and pH 9, half-life and shelf-life
At the pH 5, kf is 0.0107 h-1 and kc is 0.001042 h-1 and at the pH 9, kf is 1.62h-1
and kc is 0.4065 h-1, so in both cases kc < kf meaning hydrolyses of tacrolimus molecules
bound to α CD happens at a slower rate than free tacrolimus molecules (29). Since, kc <
kf the CD complexation stabilizes the drug and increases shelf-life (t90) of tacrolimus (23).
At pH 5, the kc / kf ratio is 0.097 (i.e. kf / kc ratio is 10.27) indicating that free
tacrolimus molecules are hydrolysed about 10.27 faster in the solution than within the complex. At pH 9, the ratio kc / kf is 0.25 (i.e kf / kc ratio is 3.98) indicating that tacrolimus
is hydrolysed about 0.25 times faster in the form of complex than as free drug in the solution (29). Since the hydrolysis of tacrolimus encapsulated in CDs is slower than free tacrolimus the stability of the drug/CD complex, i.e. the magnitude of the complex stability constant, also plays a significant role in determining the extent of protection (25).
35
With first-order reactions is possible to calculate the half-life (t1/2), and the
shelf-life (t90) which are independent of the initial drug concentration (30). The half-life (t1/2)
is the time it takes for the initial concentration of the drug to be reduce to half and the shelf-life (t90) is the time necessary for the drug to decay to 90% of its original
concentration, during this time if the product is stored appropriately will retain suitable for use (30). 𝑡1 2 ⁄ = ln 2 𝑘1 (11) 𝑡90 = 0.105 𝑘1 (12)
Table 113: Half-life and shelf-life, of tacrolimus at pH 5
pH 5
Different % of CD that complexed with tacrolimus 2.5% (w/V) α CD 5% (w/V) α CD 7.5% (w/V) α CD 𝐥𝐧[𝒅𝒓𝒖𝒈]𝟎 3.6017 3.5605 3.5454 𝒔𝒍𝒐𝒑𝒆 = −𝒌𝟏 -0.0087 h-1 -0.0079 h-1 -0.0053 h-1
First-order rate constant = 𝒌𝟏 0.0087 h-1 0.0079 h-1 0.0053 h-1
𝒕𝟏 𝟐 ⁄ = 𝐥𝐧 𝟐 𝒌𝟏 79.672 h 87.740 h 130.782 h 𝒕𝟗𝟎= 𝟎. 𝟏𝟎𝟓 𝒌𝟏 12.068 h 13.291 h 19.811 h
36
Table 14: Half-life and shelf-life of tacrolimus at pH 9
pH 9
Different % of CD that complexed with tacrolimus 2.5% (w/V) α CD 5% (w/V) α CD 7.5% (w/V) α CD 𝐥𝐧[𝒅𝒓𝒖𝒈]𝟎 3.5569 3.4723 3.4611 𝒔𝒍𝒐𝒑𝒆 = −𝒌𝟏 -1.2891 h-1 -1.1148 h-1 -1.0982 h-1
First-order rate constant = 𝒌𝟏 1.2891 h-1 1.1148 h-1 1.0982 h-1
𝒕𝟏 𝟐 ⁄ = 𝐥𝐧 𝟐 𝒌𝟏 0.5377 h 0.622 h 0.6311 h 𝒕𝟗𝟎= 𝟎. 𝟏𝟎𝟓 𝒌𝟏 0.0815 h 0.0942 h 0.0956 h
The shelf-life (t90) of tacrolimus is bigger when in a higher percentage of α CD.
From these tables is also noticeable that the half-life (t1/2) and the shelf-life (t90) are bigger
in the pH 5, which is in agreement with previous studies (11), meaning tacrolimus is more stable in acid pH. This information is useful for future formulation purposes.
37
Conclusion
CDs can be used to overcome the three major constraints of topical ocular delivery, they can enhance the solubility of the poorly soluble and wettable drugs, increase their retention and permeation at the ocular surfaces (19). There are other systems for ocular delivery made to enhance the bioavailability of topically applied ophthalmic drugs, like hydrogels, microemulsions, solid inserts and liposomes, yet they are not very used due to both their side-effects (such as blurred vision and local irritation) and their instability (i.e. limited shelf-life) (25). The increased drug efficacy and potency (i.e. reduction of the dose required for optimum therapeutic activity), caused by CD increased drug solubility, may reduce drug toxicity by making the drug effective at lower doses (25).
Having all this in mind, the applications of CDs in aqueous eye drop preparations include not only the solubilization and chemical stabilization of drugs, but also the reduction of ocular drug irritation, and enhancement of ocular drug permeability (25), making them a good option to use with tacrolimus.
There are some considerations to have in mind when preparing CD complexes for eye drops formulations. One is that conventional penetration enhancers enhance drug permeation from both aqueous and non-aqueous media while CDs are only able to enhance permeation of relatively lipophilic drug molecules that have limited solubility in water and then only from aqueous media (16). The second one is that the quantity of CD added will affect the optimum drug availability, since at low CD concentrations, when the drug is in suspension, the flux of the drug increases with increasing CD concentration (21). At higher CD concentrations, when all drug is in solution, the flux decreases with increasing cyclodextrin concentration (21). The maximum permeability is observed when just enough CD is added to the vehicle to solubilize the entire drug, so to optimize the tacrolimus release from an aqueous eye drop formulation it is mandatory to adjust its CD concentration (21). The third is the excipients used in the formulation since some of the ingredients will compete with the drug, in this case with tacrolimus, for a space into the CD cavity, thereby reducing the solubilizing effect of the CD (21). At the same time, some other ingredients may have a solubilizing effect on tacrolimus, thereby reducing the amount of CD needed to solubilize the drug (21). This means that the results obtain in this study are useful, nevertheless the amount of CD included in the aqueous eye drop
38
formulation has to be decided based on availability studies performed on the actual eye drop formulation which must contain all necessary excipients (e.g. preservatives, polymers and buffer salts) (21). The fourth is the CD toxicity to the eye. It is observed that parent CDs with limited water aqueous solubility i.e. α-CD, β-CD and γ-CD have significant toxic effect upon ocular delivery (16).
The cytotoxicity order of CDs on the human corneal cell line was found to be α-CD > DM-βα-CD > SBE-β-α-CD=HP-β-α-CD > γ-α-CD (25). The toxicity is attributed to the potential role in extracting phospholipids from the biological membrane (19).It was reported that CDs, because of their ability to remove cholesterol, may increase membrane fluidity and induce membrane invagination through a loss of bending resistance and cause cell lysis (25). The permeation enhancing property of the CDs is reported to be expedited by damaging the corneal epithelium (19). But there are reports that say the perturbing effects of CDs can be mild and reversible (25) and studies that show that although with β-CD samples of the cornea showed some epithelial disruption, which became more noticeable with longer exposure time, no extraction of cholesterol was observed when the corneas were exposed to α-CD and γ-CD (10), there are also studies about ocular irritation and toxicity on rabbits showing that solutions of 10% SBE-β-CD and 12.5% HP-β-CD are safe and have no ocular irritation or toxicity (19). There is even a chloramphenicol – DM-β-CD complex eye drop formulation, present in the market for more than 20 years (Clorocil®) (Pat. Port. n.º 101.446). All of this makes the toxicity a question of testing which one is the best for the formulation in mind.
After the phase solubility studies and the kinetic studies performed in this work, studies in Franz Cells should be done. There are a widely used methodology to evaluate in vitro drug permeation (31) and in a more final phase of the formulation process in vivo studies would also be required.
Through proper analysis of the permeation barriers from the surface to the anterior segment and posterior segment of the eye, and by applying the basic principles of physical pharmacy, that include the formation of CDs complexes with tacrolimus it will be possible to design aqueous eye drops that are able to deliver significant amounts of drug to both the posterior segment and the anterior segment of the eye (19). There are already studies that report the preparations of tacrolimus eye drop (0.05%) using CDs (28). Hopefully, after all the studies of this investigation project being complete a novel eye drop formulation with tacrolimus-CD complexes will be prepared which will be used in the treatment of the DES.
39
Bibliography
1. Craig JP, Nichols KK, Akpek EK, Caffery B, Dua HS, Joo C-K, et al. TFOS DEWS II Definition and Classification Report. Ocul Surf [Internet]. 2017 Jul;15(3):276–83. Available from:
https://linkinghub.elsevier.com/retrieve/pii/S1542012417301192
2. Messmer EM. Pathophysiology, diagnosis and treatment of dry eye. Dtsch Arztebl Int. 2015;112(5):71–82.
3. Bazeer S, Jansonius N, Snieder H, Hammond C, Vehof J. The relationship between occupation and dry eye. Ocul Surf [Internet]. 2019;(December 2018):1– 7. Available from: https://doi.org/10.1016/j.jtos.2019.04.004
4. Pflugfelder SC, de Paiva CS. The Pathophysiology of Dry Eye Disease: What We Know and Future Directions for Research. Ophthalmology.
2017;124(11):S4–13.
5. Ma S, Yu Z, Feng S, Chen H, Chen H, Lu X. Corneal autophagy and ocular surface inflammation: A new perspective in dry eye. Exp Eye Res [Internet]. 2019;184(January):126–34. Available from:
https://doi.org/10.1016/j.exer.2019.04.023
6. Gomes JAP, Santo RM. The impact of dry eye disease treatment on patient satisfaction and quality of life: A review. Ocul Surf [Internet]. 2019;17(1):9–19. Available from: https://doi.org/10.1016/j.jtos.2018.11.003
7. Chiambaretta F, Doan S, Labetoulle M, Rocher N, El Fekih L, Messaoud R, et al. A randomized, controlled study of the efficacy and safety of a new eyedrop formulation for moderate to severe dry eye syndrome. Eur J Ophthalmol
[Internet]. 2017;27(1):1–9. Available from: https://doi.org/10.5301/ejo.5000836 8. Valim V, Trevisani VFM, de Sousa JM, Vilela VS, Belfort R. Current Approach
to Dry Eye Disease. Clin Rev Allergy Immunol. 2015;49(3):288–97.
9. Şimşek C, Doğru M, Kojima T, Tsubota K. Current management and treatment of dry eye disease. Turkish J Ophthalmol. 2018;48(6):309–13.
10. Moiseev R V, Morrison PWJ, Steele F, Khutoryanskiy V V. Penetration Enhancers in Ocular Drug Delivery. 2019;1–32.
11. Rozman Peterka T, Grahek R, Hren J, Bastarda A, Bergles J, Urleb U. Solid state compatibility study and characterization of a novel degradation product of
tacrolimus in formulation. J Pharm Biomed Anal. 2015;110:67–75.
12. Zierhut M, Pavesio C, Ohno S, Oréfice F, Rao NA. Preface. Intraocular Inflamm. 2016;vii–x.
13. Luaces-Rodríguez A, Touriño-Peralba R, Alonso-Rodríguez I, García-Otero X, González-Barcia M, Rodríguez-Ares MT, et al. Preclinical characterization and clinical evaluation of tacrolimus eye drops. Eur J Pharm Sci [Internet].
2018;120(April):152–61. Available from: https://doi.org/10.1016/j.ejps.2018.04.038
40
ocular delivery of tacrolimus. Colloids Surfaces B Biointerfaces [Internet]. 2017;157:40–7. Available from: http://dx.doi.org/10.1016/j.colsurfb.2017.05.049 15. Siegl C, König-Schuster M, Nakowitsch S, Koller C, Graf P, Unger-Manhart N,
et al. Pharmacokinetics of topically applied tacrolimus dissolved in Marinosolv, a novel aqueous eye drop formulation. Eur J Pharm Biopharm [Internet].
2019;134(November 2018):88–95. Available from: https://doi.org/10.1016/j.ejpb.2018.11.015
16. Loftsson T, Stefánsson E. Cyclodextrins and topical drug delivery to the anterior and posterior segments of the eye. Int J Pharm [Internet]. 2017;531(2):413–23. Available from: http://dx.doi.org/10.1016/j.ijpharm.2017.04.010
17. Loftsson T, Ophthalmic CT. Cyclodextrin-Based Telmisartan Ophthalmic Suspension: Formulation Development for Water-Insoluble Drugs. 2016; 18. Kalam MA, Alshamsan A. Poly (D, L-lactide-co-glycolide) nanoparticles for
sustained release of tacrolimus in rabbit eyes. Biomed Pharmacother [Internet]. 2017;94:402–11. Available from: http://dx.doi.org/10.1016/j.biopha.2017.07.110 19. Chaudhari P, Ghate VM, Lewis SA. Supramolecular cyclodextrin complex:
Diversity, safety, and applications in ocular therapeutics [Internet]. Vol. 189, Experimental Eye Research. Elsevier Ltd; 2019. 107829 p. Available from: https://doi.org/10.1016/j.exer.2019.107829
20. Loftsson T, Muellertz A, Siepmann J. For the special IJP issue “Poorly soluble drugs.” Int J Pharm [Internet]. 2013;453(1):1–2. Available from:
http://dx.doi.org/10.1016/j.ijpharm.2013.05.056
21. Loftsson T, Stefa E. Cyclodextrins in eye drop formulations : enhanced topical delivery of corticosteroids to the eye. 2002;(Table 1).
22. Jansook P, Ogawa N, Loftsson T. Cyclodextrins : structure , physicochemical properties and pharmaceutical applications. Int J Pharm [Internet]. 2018;535(1– 2):272–84. Available from: https://doi.org/10.1016/j.ijpharm.2017.11.018 23. Popielec A, Loftsson T. Effects of cyclodextrins on the chemical stability of
drugs. Int J Pharm [Internet]. 2017;531(2):532–42. Available from: http://dx.doi.org/10.1016/j.ijpharm.2017.06.009
24. Loftsson T, Masson M. Cyclodextrins in topical drug formulations : theory and practice. 2001;225:15–30.
25. Challa R, Ahuja A, Ali J, Khar RK. Cyclodextrins in drug delivery: An updated review. AAPS PharmSciTech. 2005;6(2):329–57.
26. Arima H, Yunomae K, Miyake K, Irie T, Hirayama F, Uekama K. Comparative studies of the enhancing effects of cyclodextrins on the solubility and oral bioavailability of tacrolimus in rats. J Pharm Sci. 2001;90(6):690–701.
27. Saokham P, Muankaew C, Jansook P, Loftsson T. Solubility of cyclodextrins and drug/cyclodextrin complexes. Molecules. 2018;23(5):1–15.
28. Hajiahmadi F, Derkhshan A, Nikandish M, Malaekeh-nikouei B. Preparation of tacrolimus ophthalmic solution using cyclodextrins. J Birjand Univ Med Sci. 2017;24(1):19–27.
41
29. Popielec A, Fenyvesi, Yannakopoulou K, Lofton T. Effect of cyclodextrins on the degradation rate of benzylpenicillin. Pharmazie. 2016;71(2):68–75. 30. Loftsson T. Drug Stability for Pharmaceutical Scientists. 1st editio. Academic
Press; 2013. 170 p.
31. Salamanca CH, Barrera-Ocampo A, Lasso JC, Camacho N, Yarce CJ. Franz diffusion cell approach for pre-formulation characterisation of ketoprofen semi-solid dosage forms. Pharmaceutics. 2018;10(3):1–10.
42
Annexes
Annexe 1: Calibration curve for α-CD for the phase solubility studies
Figure 112: Calibration Curve for alpha-CD
Annexe 2: Area of the peaks that gave the previous calibration curve
Table 1: Area of the peaks that gave the previous calibration curve for alpha-CD
Concentration of
α CD % (w/v) Area of the peaks (mAu*min)
Average of area Standard deviation of area Calculated Concentration of tacrolimus (µg/mL) 0.0% 0.762 0.932 0.446 0.713 0.247 1.356 1.0% 1.807 2.150 1.931 1.963 0.174 2.737 2.5% 5.534 5.783 5.774 5.697 0.141 6.866 5.0% 10.647 10.389 9.164 10.067 0.793 11.698 7.5% 14.086 16.691 16.364 15.714 1.419 17.942 10.0% 11.560 10.112 11.677 11.116 0.872 25.717 12.0% 11.997 12.039 13.439 12.492 0.821 28.759 y = 0.9041x - 0.5129 R² = 0.9984 0 2 4 6 8 10 12 14 0 2 4 6 8 10 12 14 16 Are a o f th e p eak s (m Au *m in ) Concentration of Tacrolimus (µg/mL)
Calibration Curve
43
Annexe 3: Calibration curve for α-CD for the phase solubility studies
Figure 2: Calibration Curve for HP-gamma-CD
Annexe 4: Area of the peaks that gave the previous calibration curve
Table 2: Area of the peaks that gave the previous calibration curve for HP-gamma-CD y = 0.8008x - 0.1371 R² = 0.9969 0 2 4 6 8 10 12 14 0 2 4 6 8 10 12 14 16 Are a o f th e p eak s (mA u *m in ) Concentration of Tacrolimus (µg/mL)
Calibration Curve
Concentration ofHP γ CD % (w/v) Area of the peaks (mAu*min)
Average of area Standard deviation of area Calculated Concentration of tacrolimus (µg/mL) 0.0% 0.493 0.595 0.922 0.670 0.225 0.665 5.0% 2.331 2.101 2.220 2.217 0.115 2.600 15.0% 3.794 3.370 3.569 0.305 7.299 3.885 3.848 3.394 3.122 25.0% 5.307 5.494 5.603 0.427 12.544 5.257 5.374 6.116 6.072 30.0% 5.966 6.250 6.009 0.161 13.591 5.764 5.884 6.148 6.043 35.0% 9.348 9.822 7.645 2.548 17.810 7.683 9.501 4.872 4.647 45.0% 10.315 10.302 9.175 0.986 21.753 8.725 8.662 8.454 8.590
44
Annexe 5: Calibration curve for RM-betta-CD for the phase solubility studies
Figure 3: Calibration Curve for RM-betta-CD
Annexe 6: Calibration curve for RM-betta-CD for the phase solubility studies
Table 3: Area of the peaks that gave the previous calibration curve for RM-betta-CD
Concentration of
RM β CD % (w/v) Area of the peaks (mAu*min)
Average of area Standard deviation of area Calculated Concentration of tacrolimus (µg/mL) 0.0% 0.737 0.871 0.887 0.8315 0.0824 1.333 2.5% 2.258 2.383 2.269 0.053 30.885 2.149 2.393 2.273 2.157 5.0% 5.861 6.083 6.053 0.099 77.089 6.076 5.970 6.231 6.094 7.5% 6.942 7.204 7.247 0.257 91.674 7.462 7.622 7.061 7.190 10.0% 6.721 6.456 6.380 0.248 162.172 5.958 6.254 6.335 6.555 12.5% 8.047 7.842 7.453 0.984 188.383 8.122 8.067 6.240 6.401 15.0% 9.678 9.641 9.785 0.832 245.336 8.774 9.274 10.533 10.811 y = 0.8189x - 0.2602 R² = 0.9992 0 2 4 6 8 10 12 14 0 2 4 6 8 10 12 14 16 Are a o f th e p eak s (mA u *m in ) Concentration of Tacrolimus (µg/mL)
Calibration Curve
45 Annexe 7: Calibration curve for the pH 5
Figure 4: Calibration Curve for pH 5
Annexe 8: Area of the peaks obtain from UHPLC for the pH 5
Table 4: Area of peaks obtain at this time for the pH 5
Time (h)
Area of the peaks
2.5% (w/V) α CD 5% (w/V) α CD 7.5% (w/V) α CD 2.00 12.760 13.249 12.759 11.985 12.616 12.181 12.379 12.596 12.587 22.50 11.966 11.383 11.317 10.937 11.146 11.516 11.267 11.098 11.467 30.00 10.107 3.792 3.617 9.942 9.907 10.909 10.478 10.006 10.481 48.00 8.173 9.501 7.189 7.635 7.612 9.116 9.268 8.996 9.953 72.00 8.071 6.826 5.875 6103 5.497 8.174 8.112 8.410 9.766 96.00 5.587 5.184 3.616 4.818 5.286 7.551 7.547 6.720 7.649 120.00 4.947 4.829 3.835 2.864 3.656 6.774 6.771 5.451 6.257
46
Annexe 9: Average of the area of the peaks used to do the calibration curve for the pH 5
Table 5: Average of the area of the peaks used to do the calibration curve for the pH 5
Annexe 10: Calibration curve for the pH 9
Figure 5: Calibration curve for the pH 9
Time (h)
Average of area of the peaks Standard Deviation of the area of the peaks 2.5% (w/V) α CD 5% (w/V) α CD 7.5% (w/V) α CD 2.5% (w/V) α CD 5% (w/V) α CD 7.5% (w/V) α CD 2.00 12.923 12.261 12.521 0.283 0.323 0.122 22.50 11.556 11.200 11.278 0.357 0.294 0.184 30.00 5.839 10.253 10.324 3.698 0.569 0.276 48.00 8.288 8.121 9.406 1.161 0.862 0.493 72.00 6.924 6.591 8.791 1.101 1.404 0.866 96.00 4.796 5.885 7.305 1.041 1.469 0.510 120.00 4.537 4.431 6.159 0.610 2.067 0.665
![Figure 6: Curve of time vs ln [tacrolimus] for a 2.5% (%w/v) alpha CD, pH 5](https://thumb-eu.123doks.com/thumbv2/123dok_br/15247262.1023764/30.892.192.701.104.364/figure-curve-time-vs-ln-tacrolimus-alpha-cd.webp)
![Figure 11: Curve of time vs ln [tacrolimus] for a 2.5% (%w/v) alpha CD, pH 9](https://thumb-eu.123doks.com/thumbv2/123dok_br/15247262.1023764/33.892.191.704.104.364/figure-curve-time-vs-ln-tacrolimus-alpha-cd.webp)
