2019
DEPARTAMENTO DE BIOLOGIA ANIMAL
Understanding the Gene Regulatory Networks Involved in
Sensory Hair Cell Differentiation: How Gfi1 Modulates Cell
Differentiation
Catarina Romão Galego
Mestrado em Biologia Evolutiva e do Desenvolvimento
Dissertação orientada por:
Dr Sally Lowell
II
ACKNOWLEDGEMENTS
I want to express my gratitude to Dr Sally Lowell for the opportunity and guidance through the whole period I developed the project presented here, especially for the patience and time with me during the writing phase. Without the confidence that she put on me, I would not have had the performance that I did. Thank you for letting me to work with you and for all the positive feedback.
Lowell’s laboratory group was a key factor in everything that happened in the making of this project. I want to thank Guillaume Blin, Mattias Malaguti, Rosa Portero Migueles, Karolina Punovuori, Darren Wisniewski, Chandrika Rao and Julia Watson for welcoming me as a peer and for all the experiment discussions that also guided me during this process and for helping me a lot with practical situations. I am grateful I took part in the processes involved in the lineage decisions of pluripotent cells projects. A special thanks to Guillaume and his unique sense of humor and wisdom, and to Rosa and her companionship. Thank you for the friendship and all the teaching, motivation and cake sharing. I cannot forget all the supervision made by Aida Costa that introduced the project to me and taught me everything so I could be independent in the laboratory. I also want to thank to those in the MRC Centre for Regenerative Medicine who helped me in times of crisis with technical situations, always with a smile, making me feel part of the family.
Last but not least I want to express my gratitude to my friends and family. I am grateful for all the effort of my family so I could have lived the opportunity of realizing my MSc project in Edinburgh, that added so much to my life. Finally, without any particular order, I especially want to thank to those friends I cannot get rid of and insist of pushing me forward every day.
To the Parkside Terrace OG’s, together we shared all the experience of taking a master degree abroad. Matteo, I will miss all your life stories that could have been told in five minutes, and yet you could talk for an all evening. I will always cherish that. Telma and Livia, thank you for all the garlic bread, burger, brownies, pizza, fries, wine and cheese and bossy nights and Arthur’s seat singing evenings. To my Grace, you witnessed all my highs and lows and for that I cannot love you more. I am sure you will continue to succeed and buy us our house by the beach where we will sing ‘Da Weasel’ and maybe have our business. I am also grateful that you shared with me all your highs and lows. To my serotonin impersonated into an ukulele sister “such is the way of the world, you can never know just where to put all your faith and how will it grow. Gonna rise up, burning black holes in dark memories. Gonna rise up, turning mistakes into gold”. I will always be there for you!
I cannot think about my master course without thinking of you, Zé and Mira. Thank you for all the hours shared of talks, non-talks, study and lab sessions or just your company. Bernardo, I did not share this journey with you, but I did not forget your companionship and your support, especially to put up with these two. You three are by far among the most intelligent and genuine people I know. Never change!
To Lullu and Fotone, your companionship is something I will take for the rest of my life. Grazie mille, cucciolotto!
III Miguel, Ana and Sara, you have been with me since our adventure in Lisbon began, back in 2012. I have no words for our bond. It is beyond places, personalities or interests. I am at home with you.
To Inês and Maria, you are my family! I would not change our time spent together for nothing. Our friendship will never perish.
These acknowledgements would definitely not be written without these people present in my life.
IV
RESUMO
O ouvido interno pode dividir-se em duas partes distintas: o sistema vestibular, responsável pela detecção do movimento e posição, e o sistema auditivo, responsável pela audição. Um dos aspetos mais importantes do ouvido interno é a existência de um padrão celular tipo “tabuleiro de xadrez” nos seus epitélios sensoriais compostos por células ciliadas, no estrato apical, rodeadas basal e lateralmente por células de suporte. As células ciliadas são os mecanorrecetores primários dos nossos sentidos de audição e de equilíbrio, nos vertebrados, transformando os estímulos vibratórios em impulsos elétricos que são transmitidos ao cérebro.
No sistema auditivo encontra-se apenas um epitélio sensorial, o órgão de Corti, com uma estrutura celular altamente organizada e precisa, responsável pela capacidade da cóclea detetar e distinguir sons. No entanto, estas células são facilmente destruídas e não existe um mecanismo de regeneração espontâneo em mamíferos, ao contrário de outros vertebrados não-mamíferos. A destruição das células ciliadas é um processo frequente e irreversível que conduz a uma perda de audição definitiva.
A perda de audição afecta milhões de pessoas em todo o mundo e é principalmente causada pela perda das células sensoriais ciliadas do ouvido interno. Apesar de no período da infância a medicina regenerativa oferecer soluções terapêuticas para a maioria das perdas de audição, os outros casos ficam limitados ao uso de aparelhos prostéticos que apresentam uma ajuda insuficiente. Sendo que se estima que a perda de audição venha a aumentar devido à poluição sonora e envelhecimento da população, é crescente a necessidade do desenvolvimento de terapias que promovam a regeneração das células ciliadas.
Para induzir a regeneração destas células temos que, primeiro, compreender os mecanismos moleculares que regulam a sua diferenciação. Atoh1 é a molécula que tem recebido mais atenção devido à sua capacidade de converter células do ouvido interno não-especializadas em células sensoriais ciliadas. Contudo, a capacidade regenerativa da célula, conferida pela expressão do Atoh1, é ineficaz em cócleas mais envelhecidas/adultas. Investigações recentes permitiram identificar outros factores de transcrição fundamentais para o desenvolvimento destas células. Um dos factores de transcrição é o Gfi1, que parece desempenhar um papel importante na capacidade do Atoh1 promover o desenvolvimento de células ciliadas. Na sua ausência, Atoh1 é determinante para um destino celular neuronal. Para além do Atoh1, Gfi1 também revelou ser decisivo para que o factor de transcrição Pou4f3 mude a sua actividade de determinante para uma diferenciação neuronal para determinante para uma diferenciação em células sensoriais ciliadas. O Gfi1 parece funcionar como um “interruptor” que ativa o programa de diferenciação das células ciliadas.
Nesta tese, exploramos o papel central que o Gfi1 desempenha na modelação da atividade dos outros dois fatores de transcrição, Atoh1 e Pou4f3, e sugerimos que o faz, possivelmente, de duas maneiras distintas: através da repressão da diferenciação neuronal induzida pelo Atoh1 e Pou4f3, e pela promoção da alteração na especificidade do Atoh1 e Pou4f3, permitindo que estes fatores ativem os genes específicos para a diferenciação das células sensoriais ciliadas. Mas, é desconhecido o mecanismo pelo qual o Gfi1 controla este processo.
V Neste projeto, foi pretendido identificar os mecanismos pelos quais o Gfi1 altera a função do Atoh1 e Pou4f3. Para tal, foi estudada a importância da ligação do Gfi1 com o ADN ou com fatores de transcrição, como o Atoh1 e Pou4f3 e/ou outros co-fatores, cujo recrutamento seja mediado por diferentes regiões do Gfi1. Para tal, foi usada uma nova estratégia in vitro desenvolvida por Aida Costa para a produção de células ciliadas. Esta estratégia envolve a expressão da combinação dos três fatores de transcrição Gfi1-Pou4f3-Atoh1, para programar os progenitores em diferenciação (derivados das células estaminais embrionárias) diretamente em células ciliadas. A ativação conjunta destes fatores in vitro mostrou resultar numa indução de células ciliadas, que expressam marcadores específicos e apresentam estruturas morfologicamente semelhantes aos estereocílios mecanorrecetores.
A caracterização in vitro das células ciliadas induzidas foi feita a nível transcricional e morfológico, usando três linhas celulares da combinação dos três factores de transcrição, com variações do Gfi1 em diferentes domínios: 1) Gfi1 sem o domínio “zinc finger” que permite a ligação directa com o ADN; 2) Gfi1 com uma mutação no domínio “SNAG” que destrói a sua capacidade repressora; 3) substituição do Gfi1 pelo Gfi1b, que diferem na região intermédia, entre os dois domínios.
Esta caracterização foi feita recorrendo a imuno-citoquímica nas amostras das linhas transgénicas e PCR quantitativo em tempo real, para detetar a expressão de marcadores das células ciliadas e/ou marcadores neuronais. A análise da expressão foi feita comparando as amostras com a linha transgénica contendo um Gfi1 intacto (linha selvagem). De um modo geral, verificou-se que é preciso um Gfi1 intacto para que os marcadores de células ciliadas sejam expressos tal como na linha selvagem.
Para aprofundar a nossa investigação, recorremos à funcionalidade do Gfi1 como repressor. O Gfi1 é conhecido por atuar noutros tipos celulares através da interação com proteínas reguladoras da cromatina. Estudos hematopoiéticos mostram que o recrutamento de um complexo LSD1/CoRest/HDACs1-2, pelo domínio SNAG, é essencial para um fenótipo selvagem. Da mesma forma, estudos no laboratório de Sally Lowel revelaram que impedindo a ligação do domínio LSD1, impossibilita a atividade do Gfi1 necessária para induzir a diferenciação de células ciliadas, no sistema usado neste projecto. O recrutamento deste complexo pode ser o mecanismo principal (ou pelo menos um dos mecanismos chave) pelo qual determina a diferenciação de células ciliadas.
Usando o mesmo método de análise, foram usados químicos para inibir a função dos domínios LSD1 e HDACs, na linha transgénica selvagem. De um modo geral, observou-se que quanto maior a concentração de inibidor, menor era a expressão de marcadores de células ciliadas. Excepções foram observadas, principalmente nos marcadores específicos para os estereocílios, o que acentua a complexidade dos mecanismos responsáveis por este processo.
Estas experiências tiveram um carácter preliminar, mas que permitem identificar os vários desafios a ultrapassar, bem como para o delineamento de futuras experiências, a fim de identificar os eventos-chave da diferenciação regulada pelo Gfi1.
Em suma, a caracterização da expressão dos marcadores de células ciliadas/ neuronais, utilizando o nosso sistema de linhas transgénicas, é uma abordagem viável para a investigação do
VI mecanismo de diferenciação das células sensoriais do ouvido interno. Acreditamos que este estudo contribuiu para a aquisição de conhecimentos sobre os processos que possam estar envolvidos no desenvolvimento de células ciliadas.
Palavras-chave: Gfi1; células sensoriais ciliadas; ouvido interno; regeneração; células estaminais
VII
ABSTRACT
In the inner ear, mechanosensory hair cells are the primary receptors of our hearing senses, localized in the auditory system, and balance, in the vestibular system. Damage or loss of hair cells is the leading cause of deafness. Unfortunately, these cells are easily destroyed and spontaneous hair cell regeneration does not occur in mammals (unlike non-mammalian vertebrates) and there is no treatment for their regeneration.
To unlock hair cell regeneration capacity, we first need to gain a deeper understanding of the molecules that control hair cell generation. Gfi1, Atoh1 and Pou4f3 are key transcription factors of the gene regulatory network, driving hair cell fate specification. Gfi1 is a vital player of this network by playing, possibly, two distinct roles: 1) Gfi1 represses neuronal differentiation induced by Atoh1 and Pou4f3; 2) Gfi1 promotes a transcriptional switch for Atoh1 and Pou4f3 allowing them to activate hair cell genes.
The main goal is to identify how Gfi1 influences these transcription factors, whether by binding to DNA or by recruiting other co-factors through the SNAG domain and/or through the intermediary region. To test these, induced hair cells in vitro were characterized using variants of Gfi1 knock-in lines (a combination of Gfi1-Atoh1-Pou4f3) that 1) lack the DNA binding domain, 2) have a mutation that enables SNAG domain activity and 3) the Gfi1 intermediary region was replaced. Furthermore, we focused on the recruitment of the epigenetic complex LSD1/CoRest/HDACs1-2 by the SNAG domain that enables Gfi1 to act as a transcription repressor, as a key mechanism for hair cells fate determinant. Chemical inhibitors of the LSD1 and HDACs domains were administered on the wild type cell line (with an intact Gfi1).
The characterization was done by detecting hair cell and neuronal markers, by immunocytochemistry and qPCR. Our analysis identified that an intact Gfi1 is required for a proper hair cell program. Similarly, the inhibition of the epigenetic complex lead to hair cell differentiation impairments.
The characterization and analysis of the selected Gfi1 cell lines allowed us to examine the molecular mechanisms by which Gfi1 modulates hair cell formation. In addition, it provides tools for the delineation of further experiments at determining the function of these and other co-factors during inner ear development.
VIII
INDEX
ACKNOWLEDGEMENTS ... II RESUMO ... IV ABSTRACT ... VII INDEX ... VIII LIST OF FIGURES ... X LIST OF TABLES ... XI ABBREVIATIONS LIST ... XII1. INTRODUCTION ...1
1.1. STRUCTURE AND DEVELOPMENT OF THE MECHANOSENSORY HAIR CELL ...1
1.2. HEARING IMPAIRMENTS: LIMITED THERAPIES ...3
1.3. HAIR CELL DIFFERENTIATION: FACTORS INVOLVED IN THE MECHANISM AND THE USE OF KNOCK-IN LINES ...3
1.4. THE SNAG DOMAIN: THE IMPORTANCE OF THE RECRUITMENT OF THE LSD1/COREST/HDACS1-2 COMPLEX ...6
1.5. AIMS OF THIS THESIS ...7
2. MATERIALS AND METHODS ...9
2.1. GFI1 LINES ...9
2.2. CELL CULTURE TECHNIQUES ...9
2.2.1. Expansion, inactivation and freezing procedures of mouse embryonic fibroblasts (MEFs) ...9
2.2.2. Mouse embryonic stem (ES) cells cultures ...10
2.2.3. Expansion and freezing procedures ES cells ...10
2.2.4. ES cell differentiation ...10
2.3. FLOW CYTOMETRY ANALYSIS ...11
2.4. EXTRACTION AND ISOLATION OF TOTAL RNA ...12
2.5. cDNA SYNTHESIS ...12
2.6. qPCR ...12
2.7. EBS FIXATION, EMBEDDING AND CRYOSTAT SECTIONING ...14
2.8. IMMUNOCYTOCHEMISTRY (ICC)...14
2.9. MICROSCOPY AND IMAGE ANALYSIS ...15
2.10. STATISTICS ...15
3. RESULTS ...16
IX
3.2. CHARACTERIZATION OF THE KNOCK-IN LINES ...17
3.2.1. Gfi1b-PA ...17
3.2.2. Gfi1b-PA: expression overview ...26
3.2.3 Gfi1DZF6-PA...27
3.2.4. Gfi1DZF6-PA: expression overview...34
3.2.5 Gfi1P2A-PA ...34
3.2.6. Gfi1P2A-PA: expression overview ...42
3.3. RECRUITMENT OF THE LSD1/COREST/HDACS1-2 COMPLEX ...42
3.3.1. HDACs inhibition ...43
3.3.2. HDACs inhibition: expression overview ...51
3.3.3. LSD1 inhibition ...51
3.3.4. LSD1 inhibition: expression overview ...58
4. DISCUSSION ...59
4.1. GFI1 KNOCK-IN LINES: CHARACTERIZATION ...59
4.1.1. Problems and limitations to the interpretation ...59
4.1.2. Gfi1b-PA ...60
4.1.3. Gfi1DZF6-PA...61
4.1.4. Gfi1P2A-PA ...61
4.2. CHEMICAL INHIBITION OF THE REPRESSOR COMPLEX LSD1/COREST/HDACS1-2 ...62
4.2.1. Problems and limitations to the interpretation ...63
4.2.2. HDACs inhibition ...63 4.2.3. LSD1 inhibition ...64 4.3. FUTURE PERSPECTIVES ...65 4.4. CONCLUSION ...65 5. BIBLIOGRAPHY ...67 6. SUPPLEMENTARY DATA ...72
X
LIST OF FIGURES
Figure 1.1 - Mammalian ear structure ...2
Figure 1.2 - Gfi1 is a key factor in HC differentiation program ...5
Figure 1.3 - Gfi1 structure ...6
Figure 1.4 - Function of LSD1/CoRest/HDACs1-2 complex ...6
Figure 3.1 - Schematic representation of the ES cells differentiation and sampling protocols. ...16
Figure 3.2 - Gene quantification of ES cell vs EBs ...17
Figure 3.3 - Induction of Myo7a expression in Gfi1b-PA ...19
Figure 3.4 - Myo7a quantification present in Gfi1b-PA ...20
Figure 3.5 - Induction of Myo6 expression in Gfi1b-PA ...21
Figure 3.6 - Myo6 quantification present in Gfi1b-PA ...22
Figure 3.7 - Induction of Lhx3 expression in Gfi1b-PA ...23
Figure 3.8 - Lhx3 quantification present in Gfi1b-PA ...24
Figure 3.9 - Otof quantification present in Gfi1b-PA ...24
Figure 3.10 - Hair bundle-specific markers quantification present in Gfi1b-PA ...25
Figure 3.11 - Induction of neuronal-specific markers in Gfi1b-PA ...26
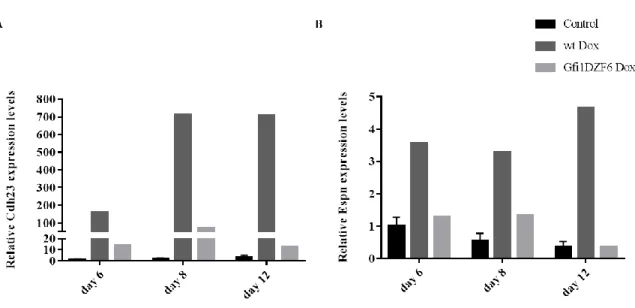
Figure 3.12 - Induction of the HC markers Myo7a and Myo6 in Gfi1DZF6-PA ...28
Figure 3.13 - Induction of Lhx3 expression in Gfi1DZF6-PA ...29
Figure 3.14 - Lhx3 quantification present in Gfi1DZF6-PA ...30
Figure 3.15 - Otof quantification present in Gfi1DZF6-PA ...30
Figure 3.16 - Hair bundle-specific markers quantification present in Gfi1DZF6-PA...31
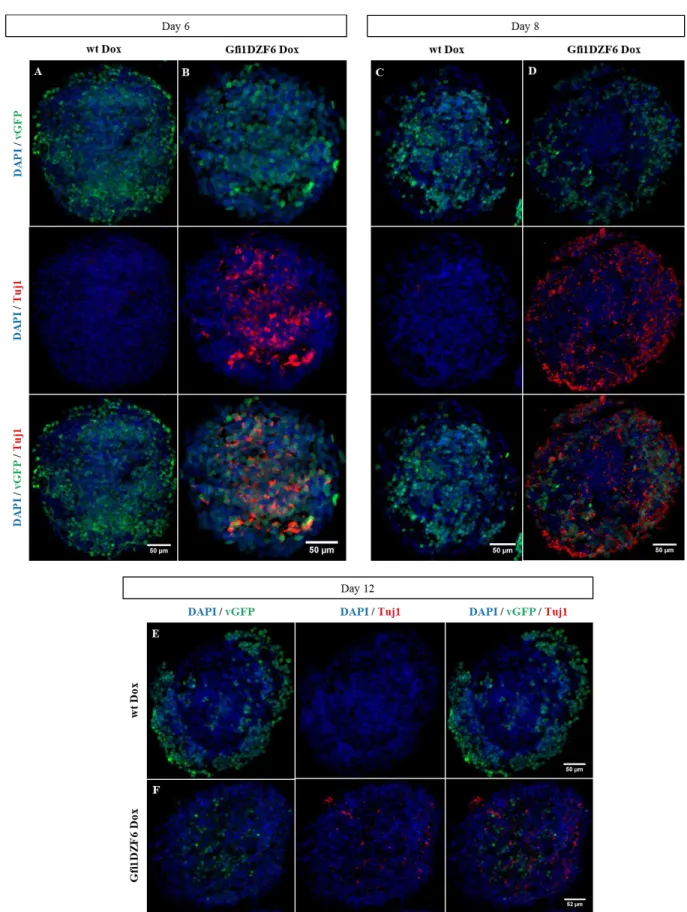
Figure 3.17 - Induction of Tuj1 expression in Gfi1DZF6-PA ...32
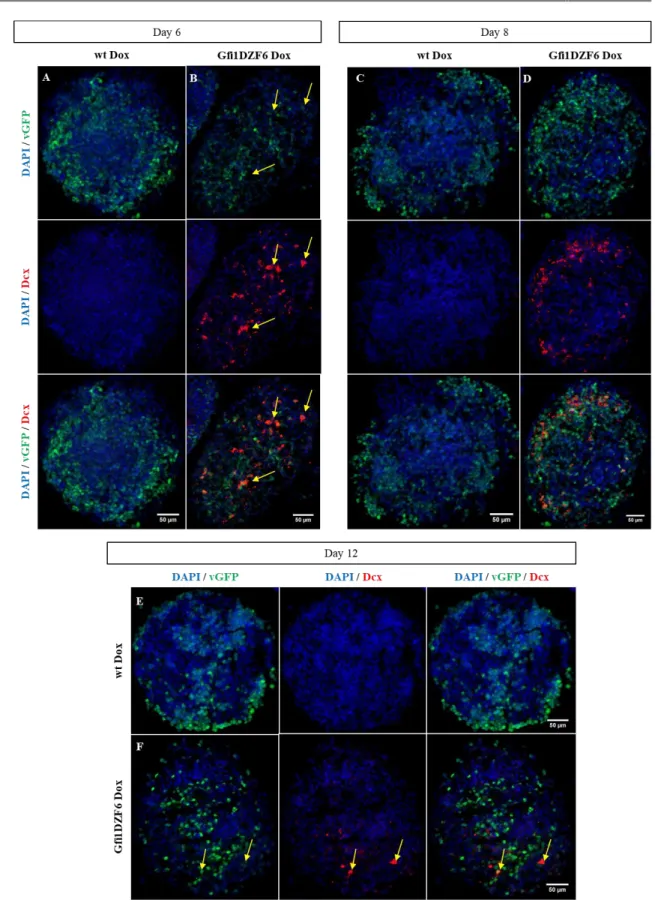
Figure 3.18 - Induction of Dcx expression in Gfi1DZF6-PA ...33
Figure 3.19 - Neuronal-specific markers quantification present in Gfi1DZF6-PA ...34
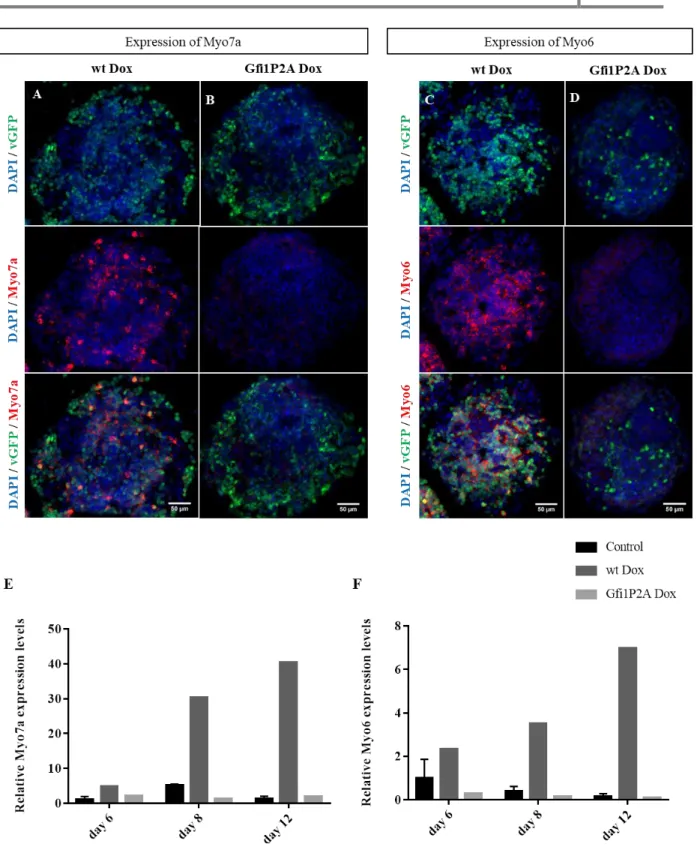
Figure 3.20 - Induction of the HC markers Myo7a and Myo6 in Gfi1P2A-PA ...36
Figure 3.21 - Induction of Lhx3 in Gfi1P2A-PA ...37
Figure 3.22 - Otof quantification present in Gfi1P2A-PA ...38
Figure 3.23 - Hair bundle-specific markers quantification present in Gfi1P2A-PA ...38
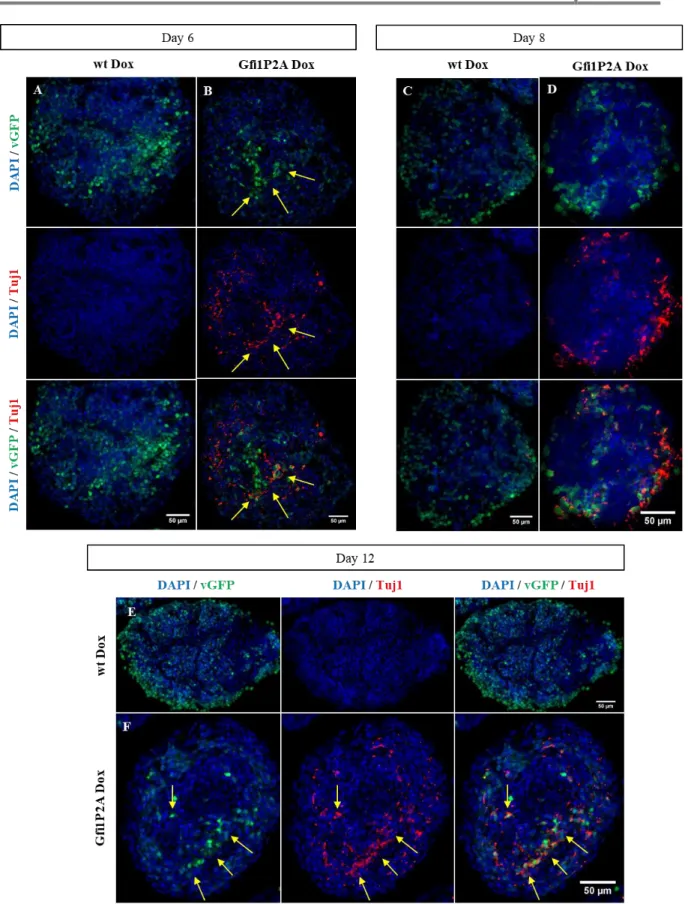
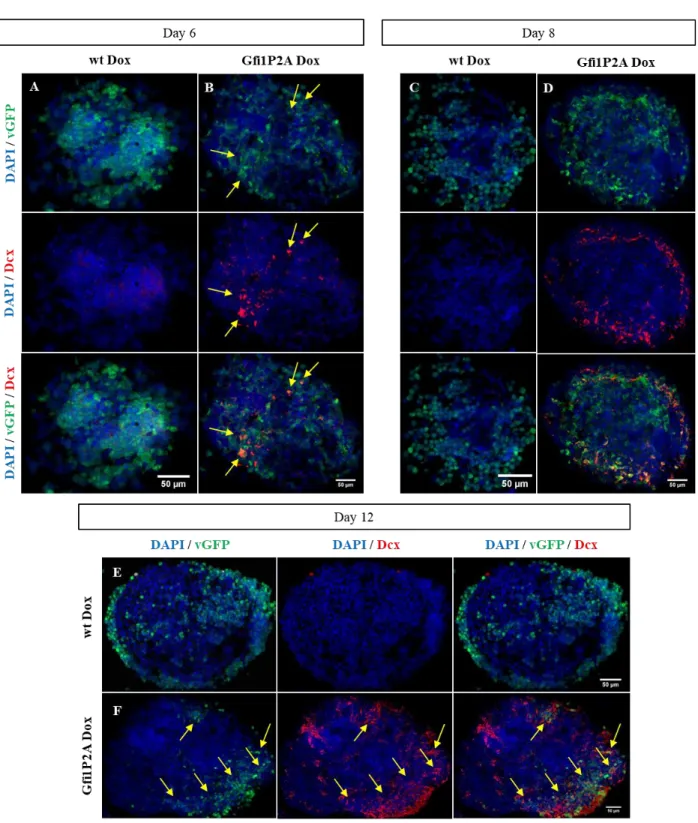
Figure 3.24 - Induction of Tuj1 expression in Gfi1P2A-PA ...39
Figure 3.25 - Tuj1 quantification present in Gfi1P2A-PA ...40
Figure 3.26 - Induction of Dcx expression in Gfi1P2A-PA ...41
Figure 3.27 - Dcx quantification present in Gfi1P2A-PA ...42
Figure 3.28 - Induction of Myo7a on Gfi1’s HDACs inhibition ...44
Figure 3.29 - Myo6 quantification on Gfi1’s HDACs inhibition ...45
Figure 3.30 - Induction of Lhx3 on Gfi1’s HDACs inhibition: ...46
Figure 3.31 - Otof quantification on Gfi1’s HDACs inhibition ...47
Figure 3.32 - Hair bundle-specific markers quantification on Gfi1’s HDACs inhibition ...48
Figure 3.33 - Induction of Tuj1 on Gfi1’s HDACs inhibition: ...49
Figure 3.34 - Induction of Dcx on Gfi1’s HDACs inhibition: ...50
Figure 3.35 - Induction of Myo7a on Gfi1’s LSD1 inhibition: ...52
Figure 3.36 - Myo6 quantification on Gfi1’s LSD1 inhibition ...53
Figure 3.37 - Induction of Lhx3 on Gfi1’s LSD1 inhibition: ...54
Figure 3.38 - Otof quantification on Gfi1’s LSD1 inhibition ...55
XI
Figure 3.40 - Induction of Tuj1 on Gfi1’s LSD1 inhibition: ...56
Figure 3.41 - Induction of Dcx on Gfi1’s LSD1 inhibition: ...57
Figure 6.1 - Gfi1b-PA GFP positive cells ...73
Figure 6.2 - vGFP quantification of Gfi1b-PA...74
Figure 6.3 - Gfi1b-PA live cells ...75
Figure 6.4 - Induction of Tuj1 in Gfi1b-PA ...76
Figure 6.5 - Induction of Dcx in Gfi1b-PA ...77
Figure 6.6 - Gfi1DZF6-PA GFP positive cells...78
Figure 6.7 - - vGFP quantification of Gfi1DZF6-PA ...79
Figure 6.8 - Induction of Myo7a in Gfi1DZF6-PA ...79
Figure 6.9 - Induction of Myo6 in Gfi1DZF6-PA ...80
Figure 6.10 - Gfi1P2A-PA GFP positive cells ...81
Figure 6.11 - - vGFP quantification of Gfi1P2A-PA ...82
Figure 6.12 - Gfi1P2A-PA live cells ...82
Figure 6.13 - Induction of Myo7a in Gfi1P2A-PA ...83
Figure 6.14 - Induction of Myo6 in Gfi1P2A-PA ...84
Figure 6.15 - Induction of Lhx3 in Gfi1P2A-PA ...85
Figure 6.16 – Inhibitors effect on EBs ...86
Figure 6.17 - HDACs inhibition on Gfi1’s live cells ...87
Figure 6.18 - HDACs inhibition on Gfi1’s GFP positive cells ...88
Figure 6.19 - vGFP quantification on Gfi1’s HDACs inhibition ...88
Figure 6.20 - Induction of Myo7a on Gfi1’s HDACs inhibition ...89
Figure 6.21 - Induction of Lhx3 on Gfi1’s HDACs inhibition ...90
Figure 6.22 - Induction of Tuj1 on Gfi1’s HDACs inhibition ...91
Figure 6.23 - Induction of Dcx on Gfi1’s HDACs inhibition ...92
Figure 6.24 - LSD1 inhibition on Gfi1’s live cells...93
Figure 6.25 - LSD1 inhibition on Gfi1’s GFP positive cells ...94
Figure 6.26 - vGFP quantification on Gfi1’s LSD1 inhibition ...94
Figure 6.27 - Induction of Myo7a on Gfi1’s LSD1 inhibition ...95
Figure 6.28 - Induction of Lhx3 on Gfi1’s LSD1 inhibition ...96
Figure 6.29 - Induction of Tuj1 on Gfi1’s LSD1 inhibition ...97
Figure 6.30 - Induction of Dcx on Gfi1’s LSD1 inhibition ...98
LIST OF TABLES
Table 2.1 – Gfi1 knock-in lines ...9Table 2.2 – HDACs and LSD1 inhibition treatment ...11
Table 2.3 – Primers used for qPCRs ...13
XII
ABBREVIATIONS LIST
Atoh1 – atonal homolog 1 bHLH – Basic helix-loop-helix BrdU - Bromodeoxyudirine C-terminus – Carboxyl-terminus Casp3 – Caspase 3
Cdh23 – Cadherin 23
cDNA – Complementary deoxyribonucleic acid ChIP – Chromatin immunoprecipitation
CIP/KIP – CDK interacting protein/Kinase inhibitory protein cm – Centimeters
Co-IP – Co-immunoprecipitation CO2 – Carbon dioxide
CoRest – Corepressor of RE1 silencing transcription factor Ct – Cycle quantification value
DAPI – 4’,6-diamidino-2-phenylindol Dcx – Doublecortin
DMEM – Dulbecco’s modified Eagle’s medium DMSO – Dimethyl sulfoxide
DNA – Deoxyribonucleic acid DNase – Deoxyribonuclease
dNTP – Deoxynucleotide triphosphate Dox – Doxycycline
DTT – 1,4-Dithiothreitol EBs – Embryoid bodies
EDTA – Ethylenediaminetetraacetic acid ES cells – Embryonic stem cells
Espn – Espin F – Forward strand
XIII FACS – Fluorescence-activated cell sorting
FBS – Fetal bovine serum FCS – Fetal calf serum FDS – Fetal donkey serum
g – Relative centrifugal force, given as acceleration of gravity Gfi1 – Growth factor independent 1
Gfi1b – Growth factor independent 1B
Gfi1DZF6 – Gfi1 lacking the zinc finger domain
Gfi1P2A – Gfi1 with a mutation proline to alanine at amino acid 2 GFP – Green fluorescent protein
GFP+ – Green fluorescent protein positive Gl – Glutamine
GMEM – Glasgow minimum essential medium
GPA – Gfi1-Pou4f3-Atoh1 transcription factors combination GPS – Gfi1/PAG-3/SENS family of zinc finger transcription factors Gy – Gamma irradiation
h - Hours
H3-K4 – Lysine 4 residues on histone 3 H3-K9 – Lysine 9 residues on histone 3 HC – Hair cell
HDACi – Histone deacetylase inhibitor HDACs – Histone deacetylases
ICC – Immunocytochemistry
iMEFs – inactivated mouse embryonic fibroblasts Lhx3 – LIM homeobox 3
LIF – Leukemia inhibitor factor
LSD1 – Lysine-specific histone demethylase 1
LSD1i – Lysine-specific histone demethylase 1 inhibitor MEFs – Mouse embryonic fibroblasts
XIV mg – Milligram mL – Milliliter mm – Millimeter mM – Millimolar min – Minutes
mRNA – Messenger RNA Myo6 – Myosin VI Myo7a – Myosin VIIa
N-terminus – Amino-terminus ng – Nanogram
ºC – Degree Celsius Otof – Otoferlin
P/S – Penicillin/Streptomycin PBS – Phosphate buffered saline PFA – Paraformaldehyde
Pou4f3 – POU class 4 homeobox 3 Pyr – Pyruvate
qPCR – real-time quantitative polymerase chain reaction R – Reverse strand
RNA – Ribonucleic acid RNase – Ribonuclease rpm – Revolutions per minute RT – Room temperature s – Seconds
Sdha – Succinate dehydrogenase complex, subunit A SNAG – SNAIL/Gfi1 proteins family domain
2019
Tuj1 – Beta III tubulin Wt – Wild type
vGFP – Yellow fluorescent protein, mutant of green fluorescent protein µg – Microgram
µL – Microliters µM – Micromolar µm – Micrometers
1
1. INTRODUCTION
1.1. STRUCTURE AND DEVELOPMENT OF THE MECHANOSENSORY HAIR CELL
In the inner ear, mechanosensory hair cells, supporting cells and nerve endings constitute the sensory epithelia 1. Mechanosensory hair cells are produced during embryonic development and convert mechanical stimuli in electric signals. They are the primary receptors of our senses of hearing and balance, which display unique physiological characteristics that are not observed in any other cell types. However these cells are easily destroyed by loud noise, therapeutic drugs or during ageing, leading to permanent hearing loss 2.
In vertebrates the auditory system functions by an epithelial sensory receptor, the hair cell (HC), which lacks an axon and is innervated by non-mechanosensory neurons. HCs are located in the ear’s vestibular system, for proprioception, and cochlear organ of Corti, for auditory function 3 (Figure 1.1). The ability of the cochlea to detect and distinguish sounds depends on the specific organization of its neurosensory epithelium. Given this complexity it is expected that many genes are required for the development of the vertebrate inner ear 4. The mammalian HCs’ mechanotransduction machinery is located in actin-rich extensions, that form the hair bundle, which are modified microvilli called stereocilia (Figure 1.1) which have mechanosensitive ion channels, of unknown molecular identity, and are precisely organized to detect sub-nanometer deflections 3, 5, 6. HCs receive stimuli of different modalities in the form of vibrations or static deformations that stimulate the bending of their hair bundles. HCs respond with a small receptor potential which excite afferent nerve fibers by chemical or electrical synapses 7.
2
Figure 1.1 - Mammalian ear structure: a) section of external ear and inner ear. The inner ear includes the vestibular and
auditory systems; b) section of the cochlea; c) section of a cochlear partition showing the organ of Corti; d) magnification of an inner hair cell. Adapted from Frolenkov et al., 2004.
Stereocilium core contains parallel actin filaments held together by proteins, such as Espin (Espn) 8
and Cadherin-23 (Cdh23) 9. The filaments are unidirectionally aligned with their barbed end, which is the high-affinity actin polymerization site, and oriented away from the surface of the cell 10. Studies show that the actin filaments terminate at the base of the stereocilia and only some extend into the body of the cell, predisposing the stereocilium to bend at the base and not at a higher position 11. To maintain this, a tight control of actin polymerization and depolymerization is required. Myosin VI (Myo6) is located at the base of the hair bundle. It has an actin-binding site and is thought to provide mechanical stability to the apex of the HC 12. Myosin VIIa (Myo7a) is another protein that interacts with actin, involves in the development and maintenance of the stereocilia 13. The stereocilia are arranged by height to form a staircase-like pattern. The bundles are directionally sensitive and a precise orientation is essential for a normal auditory perception: deflections towards the tallest stereocilia open the channels and increase the mechanotransduction current whereas deflections in the opposite direction close the channels and decrease the current 14, 15.
The deflection of HC stereocilia opens mechanically gated ion channels that allow cations, primarily potassium and calcium, to enter the cell. This influx of cations depolarizes the cell, resulting in the receptor potential. Consequently, voltage gated calcium channels open. Calcium ions enter the cell and trigger the release of neurotransmitters (glutamate) at the basal end of the cell and diffuse across the space
3 between the HC and the nerve terminal, where they bind to receptors triggering action potentials in the nerve. In this way the mechanical signal is converted into electrical signal 16. Cdh23, besides being required for establishing and/or maintaining the proper organization of the hair bundle, takes part in the functional network, that includes Myo7a, that mediates mechanotransduction in cochlear HCs, due its calcium-dependent cell adhesion nature 17. Also Otoferlin (Otof) interacts in a calcium-dependent manner to trigger exocytosis of neurotransmitters 18.
Myo7a, Myo6, Otof, Cdh23 and Espn genes are all deafness associated, required for proper function of hearing.
Besides the proteins already mentioned, LIM homeobox 3 (Lhx3) is also associated with HCs of the auditory and vestibular system 2. Although it is expressed in the nucleus of HCs its role in the inner ear has not been thoroughly described. Studies in vivo identified a differential regulation of Lhx3 expression in the two systems suggesting that it might be required for normal hearing 19.
1.2. HEARING IMPAIRMENTS: LIMITED THERAPIES
The mammalian inner ear has a very limited capacity to replace lost or damaged HCs 20. Hearing loss occurs because the hair bundle bends to the point where it is damaged or by cell death. When a HC develops it inhibits its neighboring cells from differentiating into HCs and instead the neighboring cell becomes a supporting cell. Studies in non-mammalian animals (e.g. birds and fish) show that after damaging HCs, supporting cells can divide and produce progeny that can differentiate as HCs or by transdifferentiation the supporting cells change their phenotype and assume a HC identity 21. In contrast, spontaneous HC regeneration does not occur in humans or other mammals, and there is no treatment to restore cells. There are hearing aids that amplify sound for less severe damage, and cochlear implants that functions as HCs converting sound into electrical impulses. However these systems offer limited help. Therefore understanding the gene regulatory networks that drive HC development will inform about possible therapeutic routes to HC regeneration to reverse hearing loss.
1.3. HAIR CELL DIFFERENTIATION: FACTORS INVOLVED IN THE MECHANISM AND THE USE OF KNOCK-IN LINES
Atoh1 is a basic helix-loop-helix (bHLH) transcription factor that has received much attention because it has a key role in HC differentiation. In vivo, Atoh1 is the only transcription factor known to be necessary and sufficient for HC differentiation 1, 22, 23. It is known that Atoh1 deletion in mice causes HC loss in all inner ear sensory organs 1, 24, whereas its overexpression promotes the generation of ectopic HCs in the developing ear 23, 25, 26. Atoh1 is also necessary for the specification of various subsets of neurons 27, 28, 29, intestinal secretory cells 30 and Merkel cells 31, implying that Atoh1 acts in combination with different transcription factors to activate lineage-specific differentiation programs. In vitro, the overexpression of Atoh1 alone in stem cells induces neuronal rather that HC differentiation, supporting the idea that Atoh1 must work with other transcription factors in order to determine different cell identities in different contexts. During development, diverse intrinsic and extrinsic signals are integrated to result in a specific combinatorial expression of transcription factor binding in many different cell types 32, 33.
Besides Atoh1, the zinc-finger transcription factor Gfi1 and Pou-domain transcription factor Pou4f3 are the only known transcriptional regulators essential for the proper differentiation and/ or
4 survival of all vestibular and auditory HCs 34, 35. The expression of Gfi1 and Pou4f3 is initiated in nascent HCs soon after the onset of Atoh1 upregulation 34, 25. It is possible that Atoh1 acts in combination with these two transcription factors to induce efficient HC generation.
Growth factor independence 1 (Gfi1) is the vertebrate member of the GPS (Gfi1/PAG-3/SENS) family of zinc finger transcription factors. GPS proteins are characterized by the presence of a zinc finger domain frequently found at their C-terminus and a SNAG transcriptional repressor domain also found in the N-terminus of Snail/Slug zinc finger proteins 36. The intermediary region is everything in between the C- and N-terminus. In vertebrates, Gfi1 is best known as a major regulator of hematopoiesis, playing a prominent role in the development of the myeloid and lymphoid cell lineages. Here it controls diverse developmental processes, such as cell fate determination, differentiation, proliferation and cell survival 37, 38, 39, 40
. Outside the hematopoiesis system, Gfi1 mRNA has been detected in a wide range of other tissues, but expression of Gfi1 protein seems to be restricted to mechanoreceptor cells, such as HCs and Merkel cells, neurons of the cerebellum and retina, and specialized epithelial cells in the gut and lung. Gfi1 plays a key role in the differentiation or survival of these non-hematopoietic cell types 3.
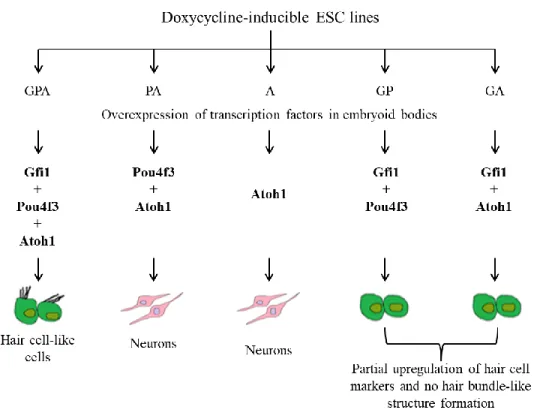
In my host laboratory, using a mouse embryonic stem cell differentiation in vitro system developed by Costa A., 2014 41, there is evidence that support the hypothesis that Gfi1 is a key factor that interacts with Atoh1 in order to enable an efficient HC differentiation program. In this system the overexpression (induced by doxycycline) of the three transcription factors, Gfi1, Pou4f3 and Atoh1 is able to program HC identity, whereas the overexpression of Atoh1 or Pou4f3 and Atoh1 leads to neuronal differentiation (Figure 1.2). These results imply that Gfi1 promotes HC differentiation by repressing neuronal differentiation induced by Atoh1 and Pou4f3 and promoting a switch in the specificity of Atoh1 and Pou4f3 allowing these transcription factors to activate HC genes (unpublished). Gfi1 also allows Atoh1 or Pou4f3 singly to upregulate some HC markers (Figure 1.2) like Myo7a, but not others such as Lhx3 and Espn. There is also some in vivo evidence that support this hypothesis: Gfi1 knockout mice aberrantly express neuronal markers in their cochlear HCs and exhibit severe morphological defects in all types of HCs 34, 42. Yet, nothing is known about the mechanism by which Gfi1 represses neuronal identity and promotes HC identity.
5
Figure 1.2 - Gfi1 is a key factor in HC differentiation program: results obtained with the in vitro system generated by Costa.
A, using doxycycline-inducible ESC lines. It shows that the presence of Gfi1 directs the HC differentiation fate (unpublished). Gfi1 has six zinc fingers and their presence suggests that it functions as a DNA binding transcription factor. Nevertheless, of the six zinc fingers, only the third, fourth and fifth zinc fingers seem to be required for DNA binding 43. The role of the other zinc fingers remains unclear but it is possible that they may function as protein-protein interaction domains (Figure 1.3). Therefore, Gfi1 might act by binding DNA and/or by recruiting co-factors in order to repress neuronal genes, such as Neuron-specific class III beta-tubulin (Tuj1) and Doublecortin (Dcx), or activate HC genes.
Clues from the hematopoietic system tell us that Gfi1 functions as a transcriptional repressor, recruiting a chromatin-regulating complex, LSD1/CoRest/HDACs1-2, that applies repressive epigenetic marks to critical regulatory genes 44. In mice with a proline to alanine mutation at amino acid 2 in Gfi1’s SNAG repressor domain, Gfi1 fails to recruit the epigenetic repressor complex and the mice exhibit a hematopoietic phenotype identical to that of the full Gfi1 knockout 45. So, an intact SNAG domain is required for the function of Gfi1 as a transcriptional repressor in blood cells. It is plausible that the recruitment of this epigenetic repressor complex might be a mechanism by which Gfi1 causes the repression of neuronal differentiation genes in the inner ear (Figure 1.3).
The function of the intermediary region of the protein, which is the part that separates the SNAG domain from the zinc finger is entirely unknown and is also the least conserved part among the vertebrate Gfi1 molecules. Gfi1 and the related transcription factor Gfi1b, also essential in hematopoiesis, share almost no sequence similarity in this region, but their other domains are nearly identical. In vivo, Gfi1b knock-in mice in the Gfi1 locus showed that Gfi1b can rescue the hematopoietic defect in Gfi1 null mice, but cannot rescue the defect in cochlear HCs 46. So, it appears that in the context of HC differentiation program the Gfi1-specific intermediary region is important for function. It is possible that this middle part
6 of the Gfi1 serves as a specific platform for the interaction with co-factors. This would suggest that although both Gfi1 and Gfi1b can bind to the same DNA target sequence, and repress transcription, each one of them might act in a different molecular context depending on the specific recruitment of partners 37. For example, it is possible that the intermediary region may recruit a partner that is required for repression of neuronal genes and/or activation of HC genes (Figure 1.3).
Figure 1.3 - Gfi1 structure: schematic structure of Gfi1 with its domains. Adapted from Möröy et al, 2015.
1.4. THE SNAG DOMAIN: THE IMPORTANCE OF THE RECRUITMENT OF THE LSD1/COREST/HDACS1-2 COMPLEX
Both Gfi1 and Gfi1b have been shown to epigenetically repress critical regulatory genes transcription in the hematopoietic system by recruiting the CoRest complex, mediated by SNAG domain, an essential region of Gfi1 proteins. The epigenetic complex includes the histone demethylase LSD1 and the histone deacetylases HDAC1 and HDAC2. When recruited to target sites, HDACs and LSD1 remove the activating acetylation and methylation marks from histones 44 (Figure 1.4). These epigenetic changes are implicate in a diversity of biological functions, such as transformation, differentiation, cell survival and cell death 47, 48, 49, 50. The LSD1/CoRest/HDACs1-2 core is functionally and structurally conserved across phyla, highlighting the importance of this complex in regulating differentiation throughout evolution 51, 52. Initiation of HCs development requires a switch in the differentiation program and the recruitment of this complex might be the mechanism behind it.
Figure 1.4 - Function of LSD1/CoRest/HDACs1-2 complex: schematic representation of the interaction between Gfi1 and the
epigenetic repressor complex when recruited at Gfi1 target genes. Adapted from Möröy et al, 2015.
LSD1 is a histone demethylase that acts in a context-depending manner. It acts as a transcriptional inhibitor if it demethylates lysine 4 residues on histone 3 (H3-K4) or a facilitator of the transcription if it demethylates on lysine 9 (H3-K9) 53, 54. CoRest is also required for demethylation by LSD155, serving as a partner in silencing neuronal genes in non-neuronal tissues and during neuronal differentiation 56. In addition, histone deacetylase activity is also required, together with CoRest, for LSD1 demethylation both
7 HDACs remove acetyl groups promoting chromatin condensation and reduced transcription 58. Class I HDACs , including HDAC1 and HDAC2, are nuclear proteins expressed in most tissues and cell types, and function as transcriptional repressors 59. Commonly used HDAC inhibitors, such as trichostatin A, efficiently block all class I HDACs 60.
Studies in vivo have demonstrated that downregulation of LSD1 or CoRest perturbs hematopoietic differentiation and LSD1 depletion also activates Gfi1b target genes, accompanied by an increase of H3-K4 methylation at the corresponding promoters. On the other hand, the interactions between Gfi1 and Gfi1b with HDAC were independent of the SNAG domain 55. Chemical inhibition of LSD1 also reactivates gene transcription 61. It can attenuate the binding to CoRest increasing H3-K4 methylation 62. Furthermore, LSD1 inhibitor treatment can inhibit cell proliferation and decrease HC differentiation in zebrafish during development 49, 50. In the in vitro system developed by Costa A., 2014 41, a form of Gfi1 in which the LSD1-interaction domain was masked abolished the pro-HC activity (unpublished).
Treatment with HDAC inhibitors on cultured cells can lead to a variety of effects, including decreased proliferation and differentiation 63. Besides, HDACs inhibition results in increased H3-K4 methylation levels whereas LSD1 inhibition does not stop histone deacetylation 61. Studies in avian HCs in vitro and in vivo suggest that HDACs have an important role in cell cycle regulation of supporting cells and, thereby, in the regeneration of HCs. However, it does not seem to directly affect HC differentiation 64
.
Based on these investigations, we hypothesize that deacetylation by HDACs is likely to be the first step 55 of the transcriptional repression and then LSD1, mediated by CoRest, demethylases on H3-K4, reversibly silencing the locus.
Interfering with any of these events can result in the loss of the repression and ectopic reactivation of neuronal genes 65.
1.5. AIMS OF THIS THESIS
Given the evidence about Gfi1 in HC development, in order to understand the mechanisms behind it, this project aims to identify the main mechanism by which Gfi1 modulates Atoh1 and Pou4f3 activity to orchestrate a HC differentiation program. To accomplish that, we will study the ability of HC differentiation by Gfi1. For that matter we will examine the expression of HC and neuronal markers, using immunocytochemistry and real-time quantitative polymerase chain reaction, in two assays:
1. Characterization of three Gfi1 knock-in cell lines that: 1.1. Lack the Gfi1 intermediary region by Gfi1b knock-in:
This cell line will specifically answer if Gfi1 acts through interactions between the intermediary region and co-factors to enable the activation of the HC fate.
1.2. Lack a functional DNA binding domain:
This Gfi1 form will answer if DNA binding directly regulates HC genes. 1.3. Lack a functional SNAG domain:
The mutation proline to alanine will test if the recruitment of the LSD1/CoRest/HDACs1-2 repressor complex is the mechanism by which Gfi1 alters the differentiation program to HCs.
8 2. Inhibition of LSD1/CoRest/HDACs1-2 repressor complex’s function by chemical inhibition of
HDACs1-2 or LSD1 domains:
Assuming that the recruitment of this complex by SNAG domain is essential for HCs differentiation program, we aim to identify the mechanism by which the repressor complex works in the context of this thesis.
9
2. MATERIALS AND METHODS
2.1. GFI1 LINES
Given the insufficiency and difficult access to hair cells in the inner ear it is advantageous to use induced HCs in an in vitro system. Since it has been shown that the transcriptome is highly similar to that of endogenous HCs (70%) 2, it is possible to produce large numbers of HC-like cells with high reproducibility using simple culture conditions according to the programming strategy employed by Costa A., 2014 41.
In order to further investigate the acquisition of HCs fate we used several cell lines to show the involvement of Gfi1 on the process of differentiation of HCs. Each inducible cell line contains a combination of the three transcription factors of interest: Gfi1, Pou4f3 and Atoh1; which can directly convert ES-derived progenitors toward HC fate. The four inducible Gfi1 lines were previously generated in S. Lowell’s laboratory according to the inducible cassette exchange recombination system generated in
Iacovino et al., 201166 and 201467. The inducible cassette exchange locus encodes a doxycycline-inducible
floxed Cre, which replaces itself with the incoming gene of interest. The derivative cell lines thus bear doxycycline-inducible transgenes (Table 2.1).
Table 2.1 – Gfi1 knock-in lines: Doxycycline-inducible cell lines used in this study and respective modifications and clones
used. Abbreviations: G – Gfi1; P – Pou4f3; A – Atoh1.
Knock-in line Gfi1 variant Clone used
GPA Intact Gfi1 (wt) 3 and 4
Gfi1DZF6-PA Zinc fingers removed 5
Gfi1b-PA Insertion of the Gfi1b coding region at Gfi1 locus 2
Gfi1P2A-PA A proline to alanine mutation at the amino acid 2 in the SNAG domain 4 and 7
2.2. CELL CULTURE TECHNIQUES
2.2.1. Expansion, inactivation and freezing procedures of mouse embryonic fibroblasts (MEFs)
All ES cell lines used were cultured requiring the presence of a MEFs feeder layer during the growth process. Therefore, expansion and inactivation of previously isolated MEFs by Costa A., was needed. MEFs, already frozen at -80ºC were thawed in pre-heated Glasgow Minimum Essential Medium (GMEM, Sigma), supplemented with 10% fetal calf serum (FCS) (Life Technologies), 2mM Glutamine/Pyruvate (Gl/Pyr) and 1% Penicillin/Streptomycin (P/S) (Invitrogen), and centrifuged for 3.5min at 378g (1300rpm). The supernatant was removed and resuspended in fresh GMEM, plated in a 150mm (diameter) culture dish (treated, Corning) and incubated at 37ºC in 5% CO2. Their morphology and confluence were inspected every day by direct visualization in a bright field microscope (Motic AE2000 microscope). The culture medium was changed every two days. When MEFs reached approximately 90% of confluency the cells were passaged in a ratio of 1:3. The MEFs were washed with sterile Phosphate Buffered Saline (PBS, Sigma) and incubated with 4mL of 0.05% trypsin-EDTA (Life Technologies) (diluted in PBS) for 5min at 37ºC. Trypsin was inactivated by the addition of 14mL of
10 supplemented GMEM. The MEFs (of each culture dish) were equally distributed in new three 150mm culture dishes and incubated at 37ºC in 5% CO2.
For inactivation of MEFs, after trypsinization, cells were centrifuged for 3.5min at 378g, supernatant removed, resuspended in fresh GMEM and inactivated for 42min and 51s by gamma irradiation (35Gy). Finally, the inactivated MEFs (iMEFs) cells were centrifuged for 3.5min at 378g, supernatant removed and resuspended in fresh GMEM. To prepare iMEFs stocks in freezing conditions, the cells were collected in a final volume of 1mL with GMEM and 10% dimethyl sulphoxide (DMSO, VWR Chemicals) into cryopreservation cryovials (ThermoFisher Scientific) and transferred to -80ºC. 2.2.2. Mouse embryonic stem (ES) cells cultures
All steps involved in the manipulation of ES cells were performed in a sterile laminar flow hood class II biosafety cabinet.
The growth of ES cell lines requires the presence of iMEFs feeder layer in 100mm culture dishes (treated, Corning). iMEFs were cultured in GMEM supplemented with 10% FCS, 2mM Gl/Pyr and 1% P/S and maintained at 37ºC in 5% CO2 incubator.
For ES cells medium, Dulbecco’s Modified Eagles Medium 1x (DMEM, Gibco) is supplemented with 10% of heat-inactivated fetal bovine serum (FBS, ES-qualified, Gibco), 2mM Gl/Pyr, 1% MEM non-essential amino acids 100x (Gibco), 7µM 2-Mercaptoethanol (Gibco) and 1% P/S. 2ng/mL of Leukemia Inhibitor Factor (LIF) were always added whenever DMEM medium is used for ES cell expansion but not differentiation.
2.2.3. Expansion and freezing procedures ES cells
ES cells were thawed in pre-heated supplemented DMEM medium and centrifuged for 3.5min at 378g. The supernatant was removed and the cells resuspended in fresh DMEM plus LIF and plated on culture dishes. Then ES cells were grown at 37ºC in 5% CO2 incubator. The morphology and health of cells were assessed daily by direct visualization on a bright field microscope (Motic AE2000 microscope). Cells were passaged every other day, at a constant plating density of 2.7x10⁴ cells/cm2. For each passage, cells were washed with sterile PBS and dissociated with 2mL of 0.05% trypsin-EDTA for 2min at 37ºC. The effect of trypsin was inactivated with 8mL of DMEM and cells were centrifuged for 3.5min at 378g. The supernatant was removed and cells were resuspended vigorously in 1mL of fresh DMEM in order to separate them into single cells for counting. Cells were counted using 1:2 concentrated trypan blue solution (diluted in PBS) which stains dead cells and helps to provide a measure of the number of viable ES cells with the sample. Trypan blue-stained cells suspension (20µL) is placed onto a hemocytometer and numbers of viable cells were counted under a bright field microscope at 10x magnification. The required amount of cells was then plated in supplemented DMEM plus LIF.
To prepare ES cells stocks for long storage in freezing conditions, after counting, 4x10⁶ cells were collected in a final volume of 1mL with DMEM and 10% DMSO into cryopreservation cryovials and transferred to -80ºC or to liquid nitrogen.
11 ES cell differentiation was achieved using a non-adherent culture system (in suspension) throughout the formation of three-dimensional aggregates known as embryoid bodies (EBs). EB formation was considered as day 0 of differentiation.
ES cells were washed with PBS and dissociated using 0.05% trypsin-EDTA for 2min at 37ºC. Trypsin was neutralized by adding 8mL of DMEM and cells were plated in culture dishes (treated, Corning) and incubated for 1h at 37ºC to separate the ES cells from the iMEFs. Then cells were centrifuged for 3.5min at 378g, supernatant removed and pellet resuspended in 1mL into single cells for counting. ES cells were plated at a low density of 1.8x10⁴ cells/cm2 with supplemented DMEM plus P/S in culture dishes (untreated, ThermoFisher Scientific). Medium was replaced every two days. The EBs’ morphology was assessed everyday as with ES cells.
Supplementations with 2µg/mL doxycycline (Dox, Sigma), diluted in sterile PBS and filtered through a 0.45µm filter unit, was initiated at day 4 and maintained until the required time points for analysis (day 6, day 8 or day 12).
When HDACs or LSD1 inhibitors added (HDACi and LSD1i), additionally to Dox, at day 4 each inhibitor was added at 0.1µM or 1µM concentrations and maintained until the required time points for analysis (Table 2.2).
Table 2.2 – HDACs and LSD1 inhibition treatment: chemicals added to inhibit HDACs and LSD1 components and respective
source and solutions prepared.
Treatment Inhibitor Source Handling
HDACi Trichostatin A
(TSA) 1mg, BioVision 10mM solution diluted in DMSO, frozen at
-20ºC (prepared by Costa A.)
LSD1i SP2509 1mg, Cayman
Chemical Company
Since DMSO is toxic for cells this agent was also added to the Dox-treated control samples in a final concentration of 0.01%.
At each time point (day 6, day 8 or day 12) EBs were fixed with 1% paraformaldehyde (PFA, Sigma-Aldrich) for immunocytochemistry (ICC), or dissociated into single cells for flow cytometry analysis or RNA was extracted for real-time quantitative polymerase chain reaction (qPCR). We also selected an additional control at day 0, before the EBs formation, where RNA was extracted from ES cells for qPCR.
2.3. FLOW CYTOMETRY ANALYSIS
This technique was used to assess the GFP expression to check the induced overexpression of the transcription factors. The EBs to be analyzed were washed in PBS and dissociated into single cells with 500µL of trypsin-EDTA (0.05% for 1min at day 6, 0.25% for 1min at day 8 or 0.25% for 2min at day 12) and mechanically. Trypsin was neutralized with 2mL of DMEM. Cells were centrifuged for 3,5min at 378g, supernatant removed and cells were resuspended in PBS. 100µL of cells were resuspended in 500µL of FACS buffer (composed of 4% of FBS in PBS) and collected into 5mL tubes with cell-strainer cap (Falcon). TRO-PO-3 iodide (1µg/mL) was added to the FACS buffer just before analysis to exclude
12 dead cells and debris. Fluorescence analysis was performed in BD FACS Calibur cell analyser cytometer using the BD CellQuest software where gates were set appropriately in order to identify the GFP positive (GFP+) cells within the live ones. The data obtained was subsequently analyzed using the FlowJo software.
2.4. EXTRACTION AND ISOLATION OF TOTAL RNA
The RNA was then extracted, isolated and quantified using the Absolutely RNA Microprep Kit (Agilent Technologies).
The remaining single cells obtained were centrifuged for 3.5min at 378g, supernatant removed and cells washed in PBS. A total of 1 – 5x10⁶ cells were collected and lysed with a solution of 350µL of lysis buffer plus 2.5µL of β-Mercaptoethanol and stored at -80ºC.
The steps to isolate the total RNA are described in the protocol 6.1 in Supplementary Data. The total RNA was then quantified (ng/µL) in a nanometer and stored at -80ºC.
2.5. cDNA SYNTHESIS
For cDNA synthesis, 200ng of the total RNA was used as a template for the reverse transcription performed with the SuperScript IV First-Strand Synthesis System (Invitrogen) in a final volume of 20µL in a PCR reaction tube. Reactions were performed at a T100 Thermal Cycler (Bio Rad). The steps used are as described in the protocol 6.2 in Supplementary Data.
The cDNA obtained was used to perform qPCR. If not immediately used for amplification it was stored at -80ºC.
2.6. qPCR
The primers used during this study for qPCR were synthetized by Sigma or Integrated DNA Technologies (Table 2.3).
13
Table 2.3 – Primers used for qPCRs, described in this section Primer Sequence 5’-3’ Sdha F CAGTTCCACCCCACAGGTA Sdha R TCTCCACGACACCCTTCTGT vGFP F GAAGCGCGATCACATGGT vGFP R CCATGCCGAGAGTGATC Myo7a F TGGGGAGTACAGGTGTGAGA Myo7aR CCACAAAGTACTGCTGAGAAGC Myo6 F GAGAGGCGGATGAAACTTGAGA Myo6 R CTTCGGAGTGCCATGTCACC Otof F CCCAGATCACGGACAGGA Otof R GCCACCAGCTCTTGATATAGATG Lhx3 F GCAGTTCCAAGTCCGACAA Lhx3 R TAGCAGGCCCCATGTCAG Cdh23 F AACAGCACAGGCGTGGTGA Cdh23 R TGGCTGTGACTTGAAGGACTG Espn F AGCAGAAGATGCAGGAGGAA Espn R TTCCGAAGAATGTCTCGTCTC Tuj1 F AAGGTAGCCGTGTGTGACATC Tuj1 R ACCAGGTCATTCATGTTGCTC Dcx F GACTCAGGTAACGACCAAGACG Dcx R TTCCAGGGCTTGTGGGTGTAG
The PCR reaction was performed on 384-well plated covered with optical adhesive covers. The instruments used were Light Cycler System Real-Time PCR (Roche Life Science). The cDNA was used as template for each pair of primer in a triplicate PCR reaction. Sdha (housekeeping gene) was used as a calibrator. The qPCR was carried out using Light Cycler 480 SyBR Green I Master mix (Roche Life Science). 2µL of the retrotranscription cDNA template was diluted in 5µL of SyBR Green, 0.5µL of 5µM of each primer (forward (F) and reverse (R)) (except for double-courting (Dcx) primer that was added 0.2µL). High-pure water was added up to 8µL.
Reaction conditions are as follows:
One step of 50ºC for 2min;
One step of 95ºC for 10min;
40 cycles of 95ºC for 15s denaturation;
One step of 60ºC for 1min annealing and extension.
The quantitative values obtained from the amplification, expressed as Ct values, were used to calculate the relative expression of the primers, using an adaption of the method delta-delta Ct by Livak. K and Schmittgen. T, 2001 68. Relative expression levels in the various Dox/inhibitor-treated samples are referred to the levels of expression in the negative control (without Dox/inhibitor) at day 6 (first time point) which are arbitrarily set to 1.
14 1. ΔCt = Cttarget gene – Cthousekeeping gene
2. Average of ΔCt of the controls at day 6 3. ΔΔCt = ΔCttreated - ΔCtcontrol
4. 2-(ΔΔCt)
5. Average of 2-(ΔΔCt) of the control at day 6 6. 2-(ΔΔCt)treated/ 2-(ΔΔCt)control
2.7. EBS FIXATION, EMBEDDING AND CRYOSTAT SECTIONING
The EBs were allowed to sediment and then the supernatant was removed, washed in PBS and incubated in 1% PFA in PBS for 2min at RT. Then EBs were washed twice in PBS and stored at 4ºC. After fixation, EBs were passed through a solution of 15% sucrose (Fisher Scientific) in PBBS for cryoprotection and left overnight. The EBs were then embedded in a solution containing 7.5% gelatin (Sigma) and 15% sucrose in PBS and left for 30min in water bath at 37ºC. The gelatin containing the EBs was let to cool at 4ºC and then frozen in cold isopenthane (provided by A. P. Jarman’s lab) at -75ºC. Frozen embedded EBs were stored at -80ºC until sectioned on a cryostat (ThermoFisher Scientific) where 10µm sections were collected on Superfrost slides (ThermoFisher Scientific).
2.8. IMMUNOCYTOCHEMISTRY (ICC)
Sections were de-gelatinized (in PBS at 37ºC) and incubated twice in PBS for 5min, in 0.1% Triton (Sigma) in PBS for 10min and two times in PBS for 5min (by immersing the slides). The sections were blocked with 10 % fetal donkey serum (FDS) in TBST (20mM Tris-HCl pH 8.0, 150mM NaCl, 0.05% Tween-20, in MILLI-Q water). Primary antibodies were diluted in blocking solution and incubated at 4ºC overnight. After primary antibodies binding, sections were washed in TBST for 15min three times. Appropriate secondary antibodies were diluted in blocking solution and incubated for 1h at RT (Table 2.4). From this step on, the slides were protected from light, since we are working with fluorochromes. The incubation with secondary antibodies was followed by three washes in TBST for 5min. All sections were counterstained with 0.15% DAPI (Biotium), washed in TBST three times for 5min and mounted with Prolong Gold mounting medium (ThermoFisher Scientific).
15
Table 2.4 – Primary and secondary antibodies used and respective manufacturer’s information and dilutions. Antibody Source Host Dilution (µL)
Myo7a Proteus Biosciences Rabbit 1:400
Myo6 Proteus Biosciences Rabbit 1:50
Lhx3 Abcam Rabbit 1:200
Tuj1 Abcam Mouse 1:500
Dcx EMD Millipore Guinea Pig 1:1000
vGFP Abcam Chicken 1:400
Casp3 A. Williams (Gift) Rabbit 1:200
Goat anti-Chicken, secondary antibody, Alexa Fluor 488 Invitrogen Goat 1:400 Donkey anti-Rabbit, secondary antibody, Alexa Fluor 555 Invitrogen Donkey 1:400 Donkey anti-Mouse, secondary antibody, Alexa Fluor 568 Invitrogen Donkey 1:400
Goat anti-Guinea Pig, secondary antibody,
Alexa Fluor 568
A. Williams (Gift) Goat 1:400
2.9. MICROSCOPY AND IMAGE ANALYSIS
Brightfield images of the fixed sections were acquired using an inverted microscope (widefield Zeiss observer), a 20x/0.8 objective and a Hamamatsu Orca-Flash 4.0 camera. Using the Zeiss Zen software, the acquisition parameters were optimized for proper laser penetration and exposition. All the image analysis was done with the open source software Fiji/ImageJ, where contrast/brightness and lookup table were adjusted.
2.10. STATISTICS
All data were expressed as means ± standard error of mean and statistical significance was assessed using a two-way ANOVA. Data and graphs were tabulated and prepared using Microsoft Excel and GraphPad Prims software. P<0.05 was considered statistically significant.
16
3. RESULTS
3.1. VALIDATION OF METHOD
In order to understand how Gfi1 is involved in the mechanism of the differentiation of HCs, we first need to determine what domain(s) are essential for this function. We used three Dox-inducible Gfi1 lines, generated by A. Costa: Gfi1b-PA; Gfi1DZF6-PA; Gfi1P2A-PA. Each cell line contains a combination of the three transcription factors Gfi1, Pou4f3 and Atoh1, which can directly convert ES-derived progenitors towards HC fate. The knock-in lines under study had its Gfi1 altered in order to analyze the mechanism by which Gfi1 modulates Atoh1 and Pou4f3 activity: Gfi1b-PA was generated by a Gfi1b knock-in at Gfi1’s locus (Gfi1b differ from Gfi1 on its intermediary region); Gfi1DZF6-PA has all its zinc fingers (DNA binding site) removed; Gfi1P2A-PA has its SNAG domain function (recruitment of a repressor complex) abolished.
We then focused on the repression of neuronal differentiation function of the LSD1/CoRest/HDACs1-2 complex recruited by Gfi1’s SNAG domain. HDACs and LSD1 execute epigenetic changes on target genes. Abrogation of HDACs and LSD1 activity cause HC differentiation impairments and therefore they might specifically modulate the Gfi1 target genes. To address this question we used the wt cell line GPA (Gfi1-Pou4f3-Atoh; intact Gfi1). To note that this line is being examined in the laboratory to identify the genes that are specifically being upregulated and downregulated.
We propose that the promotion of HC differentiation passes through a repression of neuronal differentiation. Saying this, we assessed the expression levels (HC/neuronal markers) of the Dox-inducible cells overexpressing the transcription factors combination. We performed immunocytochemistry and qPCR on EBs at days 6, 8 and 12 of differentiation followed by brightfield imaging and analysis. For immunocytochemistry, vGFP antibody was used in combination with HC (Myo7a, Myo6, Lhx3) and neuronal (Tuj1, Dcx) antibodies for the identification of the overexpressing cells. The co-localization (positive expression of the marker) of vGFP with the markers, obtained with the wt line treated with Dox (positive control), was used as reference to characterize the differentiation happening in the other samples. For qPCR, the housekeeping gene Sdha was used as a calibrator to measure the expression levels of the HC (Myo7a, Myo6, Lhx3, Otof, Cdh23, Espn) and neuronal (Tuj1, Dcx) genes referred to control at day 6. Similarly, vGFP gene was used to identify the quantity of overexpressing transcripts, in order to corroborate the immunocytochemistry observations. In addition, at each time point we tested the viability of the Dox treatment by flow cytometry analysis of the GFP+ cells (Figure 3.1).
Figure 3.1 - Schematic representation of the ES cells differentiation (through EB formation and subjected to Dox/Dox+inhibitor
17 For each line under study we examine the expression of GFP (GFP+ cells/vGFP expression) (transgenes expressed) followed by the analysis of the HC and neuronal markers. For each line and differentiation day, the best representative control (if control does not add information it is not represented) and treated samples are presented in the figures below with graphics of the relative gene expression levels.
At the end of each descriptive section, the results are summarized in a written summary focusing on the most prominent features to the question asked, providing a general overview.
3.2. CHARACTERIZATION OF THE KNOCK-IN LINES
The wt cell line GPA Dox-treated (wt Dox) was used as a positive control for HC differentiation. It is known that this cell line expresses HC markers but fail to express neuronal markers. For each cell line used, an untreated sample was used as a negative control (wt control, Gfi1b-PA control, Gfi1DZF6-PA control, Gfi1P2A-PA control). The negative controls did not exhibit differences between them.
Additionally to the analysis described in the previous section, we performed a qPCR control on ES cells at day 0 (prior EB formation) in an attempt to establish the background expression of all genes prior to differentiation. It is visible that ES cells and EBs that did not undergo the Dox treatment do not overexpress vGFP, which translates the transgenes expressed by the induction of the transcription factors. Accordingly, the relative gene expression levels of interest of ES cells do not differ from the negative control (untreated EBs) (Figure 3.2).
Figure 3.2 - Gene quantification of ES cell vs EBs: Bar diagram showing the relative RNA levels of vGFP, HC (Myo7a, Myo6, Lhx3, Otof, Cdh23 and Espn) and neuronal (Tuj1 and Dcx) markers in ES cells (prior EB formation), EBs without Dox and EBs
with 48h after Dox Treatment. Relative expression of each marker normalized to the mean of untreated EBs at day 6 (set to 1). 3.2.1. Gfi1b-PA
This Gfi1 cell line has the Gfi1 replaced by its paralogue Gfi1b, which in vivo has been described that it cannot rescue the defect in HCs. The two transcription factors share nearly identical zinc finger and SNAG domain but share practically no sequence in the intermediary region and therefore, the Gfi1b knock-in aims to investigate the hypothesis that Gfi1’s intermediary region plays a role in HC differentiation fate as a platform for protein-protein interactions.
vG FP My o7a My o6 Lh x3 Oto f Cd h2 3 Es p n Tu j1 Dc x 0 5 1 0 1 0 0 2 0 0 3 0 0 4 0 0 5 0 0 1 0 0 0 2 0 0 0 3 0 0 0 4 0 0 0 R e la t iv e g e n e e x p r e s s io n l e v e ls E S c e lls E B s E B s + D o x
18 Primarily, to analyze the Dox-inducible gene expression, through flow cytometry, the analysis show a low percentage of GFP+ cells, compared to wt cells. It is also visible the low number of cells expressing vGFP through immunostaining analysis (see Figure 6.1 in Supplementary data), confirmed by qPCR analysis (see Figure 6.2 in Supplementary data).
The dot plots obtained on the percentage of live cells, by flow cytometry, do not explain the differences between Gfi1b Dox and wt Dox samples. We also verified if the low percentage of GFP+ cells seen in Gfi1b line is due cell death through immunocytochemistry with the apoptosis’ marker caspase 3 (Casp3). A co-localization of the apoptotic marker with the overexpressing cells (vGFP positives) is not observed (see Figure 6.3 in Supplementary data).
To evaluate the capacity of Gfi1b-PA to determine HC program, we then examined the expression of HC versus neuronal markers. Given the fact that this line presents a notable lower number of vGFP positive cells, an additional normalization of the qPCR values obtained for HC and neuronal markers was necessary, to be able to relate this cell line with the wt line. The values were normalized to the percentage of GFP+ cells at day 6.
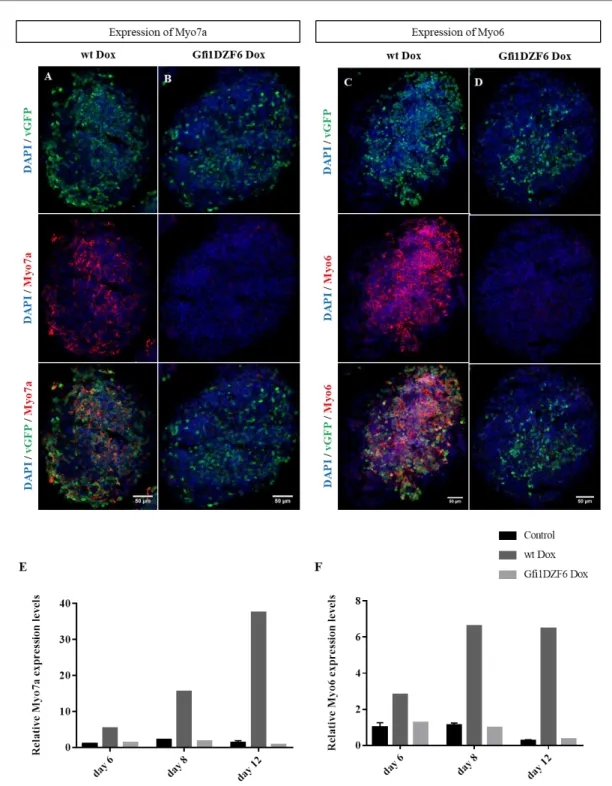
The immunostaining experiments demonstrated that vGFP is co-localized with Myo7a (Figure 3.3). At day 8, there are more co-localizing cells, and Myo7a forms a clear pattern with vGFP (comparing to day 6) (Figure 3.3.D), which appears to be maintained at day 12 (Figure 3.3.F). The qPCR reveals Myo7a expression from day 6. The increment observed follows the expression pattern of the wt line (Figure 3.4).
19
Figure 3.3 - Induction of Myo7a expression in Gfi1b-PA: Representative images obtained from ICC for Myo7a (red) from EBs
treated for 2 (A, B), 4 (C, D) and 8 (E, F) days with Dox in (A, C, E) wt Dox and (B, D, F) Gfi1b Dox. Overexpressing cells were identified with vGFP (green) and nuclei with DAPI (blue). Scale bar set to 50µm. Arrows point out co-localization.
20 da y 6 da y 8 da y 1 2 0 2 0 4 0 6 0 R e la t iv e M y o 7 a e x p r e s s io n l e v e ls C o n tro l w t D o x G fi1 b D o x
Figure 3.4 - Myo7a quantification present in Gfi1b-PA: Bar diagram showing the relative RNA levels of Myo7a in untreated
EBs and EBs treated for 2, 4 and 8 days with Dox. Relative expression of the marker normalized to the mean of untreated EBs and to the percentage of GFP+ cells at day 6 (set to 1) ± SEM (n=2).
In general, Myo6 marker is expressed at day 6 at a low extent (Figure 3.5.B), but several EBs did not label for Myo6. At days 8 and 12, Gfib Dox exhibits more co-localization between Myo6 and vGFP (Figure 3.5.D and F). By qPCR analysis, it is visible that this line presents low levels of Myo6 at day 8, which increases at day 12. At day 6, there is no difference between the control and Gfib Dox samples (Figure 3.6), contrarily to the generality of the immunostaining analysis.
21
Figure 3.5 - Induction of Myo6 expression in Gfi1b-PA: Representative images obtained from ICC for Myo6 (red) from EBs
treated for 2 (A, B), 4 (C, D) and 8 (E, F) days with Dox in (A, C, E) wt Dox and (B, D, F) Gfi1b Dox. Overexpressing cells were identified with vGFP (green) and nuclei with DAPI (blue). Scale bar set to 50µm. Arrows point out co-localization.