GMDD
7, 7575–7617, 2014GEOS5 AGCM MERRA to MERRA2
A. Molod et al.
Title Page
Abstract Introduction
Conclusions References
Tables Figures
◭ ◮
◭ ◮
Back Close
Full Screen / Esc
Printer-friendly Version Interactive Discussion
Discussion
P
a
per
|
Discussion
P
a
per
|
Discussion
P
a
per
|
Discussion
P
a
per
|
Geosci. Model Dev. Discuss., 7, 7575–7617, 2014 www.geosci-model-dev-discuss.net/7/7575/2014/ doi:10.5194/gmdd-7-7575-2014
© Author(s) 2014. CC Attribution 3.0 License.
This discussion paper is/has been under review for the journal Geoscientific Model Development (GMD). Please refer to the corresponding final paper in GMD if available.
Development of the GEOS-5 atmospheric
general circulation model: evolution from
MERRA to MERRA2
A. Molod1, L. Takacs2, M. Suarez3, and J. Bacmeister4
1
University of Maryland College Park, College Park, MD, USA
2
Science Systems and Applications, Inc., Lanham, MD, USA
3
NASA Goddard Space Flight Center, Greenbelt, MD, USA
4
National Center for Atmospheric Research, Boulder, CO, USA
Received: 2 September 2014 – Accepted: 3 October 2014 – Published: 13 November 2014
Correspondence to: A. Molod ([email protected])
GMDD
7, 7575–7617, 2014GEOS5 AGCM MERRA to MERRA2
A. Molod et al.
Title Page
Abstract Introduction
Conclusions References
Tables Figures
◭ ◮
◭ ◮
Back Close
Full Screen / Esc
Printer-friendly Version Interactive Discussion
Discussion
P
a
per
|
Discussion
P
a
per
|
Discussion
P
a
per
|
Discussion
P
a
per
|
Abstract
The Modern-Era Retrospective Analysis for Research and Applications-2 (MERRA2) version of the GEOS-5 Atmospheric General Circulation Model (AGCM) is currently in use in the NASA Global Modeling and Assimilation Office (GMAO) at a wide range of resolutions for a variety of applications. Details of the changes in
parameteriza-5
tions subsequent to the version in the original MERRA reanalysis are presented here. Results of a series of atmosphere-only sensitivity studies are shown to demonstrate changes in simulated climate associated with specific changes in physical parameteri-zations, and the impact of the newly implemented resolution-aware behavior on simu-lations at different resolutions is demonstrated. The GEOS-5 AGCM presented here is
10
the model used as part of the GMAO’s MERRA2 reanalysis, the global mesoscale “na-ture run”, the real-time numerical weather prediction system, and for atmosphere-only, coupled ocean–atmosphere and coupled atmosphere–chemistry simulations.
The seasonal mean climate of the MERRA2 version of the GEOS-5 AGCM repre-sents a substantial improvement over the simulated climate of the MERRA version at
15
all resolutions and for all applications. Fundamental improvements in simulated climate are associated with the increased re-evaporation of frozen precipitation and cloud con-densate, resulting in a wetter atmosphere. Improvements in simulated climate are also shown to be attributable to changes in the background gravity wave drag, and to up-grades in the relationship between the ocean surface stress and the ocean roughness.
20
The series of “resolution aware” parameters related to the moist physics were shown to result in improvements at higher resolutions, and result in AGCM simulations that exhibit seamless behavior across different resolutions and applications.
1 Introduction
The various activities of NASA’s Global Modeling and Assimilation Office (GMAO)
25
GMDD
7, 7575–7617, 2014GEOS5 AGCM MERRA to MERRA2
A. Molod et al.
Title Page
Abstract Introduction
Conclusions References
Tables Figures
◭ ◮
◭ ◮
Back Close
Full Screen / Esc
Printer-friendly Version Interactive Discussion
Discussion
P
a
per
|
Discussion
P
a
per
|
Discussion
P
a
per
|
Discussion
P
a
per
|
and applications. These applications include real-time atmospheric analyses and fore-casts at a resolution of 0.25◦, long term reanalyses at 0.5◦, coupled atmosphere–ocean
and coupled atmosphere–chemistry simulations at 1–2◦, and global mesoscale
simula-tions at 7 km. The Modern-Era Retrospective Analysis for Research and Applicasimula-tions-2 (MERRA2) version of the GEOS-5 AGCM is part of an ongoing development of a new
5
generation AGCM at GMAO. The focus of the development of the MERRA version of the GEOS-5 AGCM was on the behavior of the components of the hydrological cycle in reanalysis mode, while the focus of the development of the MERRA2 AGCM was on a model that functions seamlessly in numerical weather prediction, reanalysis, climate and global mesoscale modes. To this end, some of the physical parameterizations were
10
replaced, some parameters governing the behavior of other physical parameterizations were changed, and resolution-aware parameters were implemented in the moist pro-cess parameterizations.
Many studies exist that describe major improvements in new versions of AGCMs and show the improvements in simulations as compared to reanalyses and other
ob-15
servations (ie., Neale et al., 2013; Donner et al., 2011; Pope et al., 2000). The present study adds to that type of analysis by carefully documenting the connection between individual changes in the physical parameterizations of the AGCM and improvements in the climate simulation at coarse resolution. A series of sensitivity experiments were conceived and analyzed to explore, step by step, each important change in
parameter-20
izations between the MERRA and MERRA2 AGCMs, and to demonstrate the impact on the simulated climate. The present study also describes and analyzes the improve-ments in high resolution simulations due to some changes in parameterizations specif-ically targeted for those resolutions.
The details of the changes in the AGCM physical parameterizations are described in
25
GMDD
7, 7575–7617, 2014GEOS5 AGCM MERRA to MERRA2
A. Molod et al.
Title Page
Abstract Introduction
Conclusions References
Tables Figures
◭ ◮
◭ ◮
Back Close
Full Screen / Esc
Printer-friendly Version Interactive Discussion
Discussion
P
a
per
|
Discussion
P
a
per
|
Discussion
P
a
per
|
Discussion
P
a
per
|
2 Description of the MERRA2 version of the GEOS-5 AGCM
The generation of the GEOS-5 Atmospheric General Circulation Model (GCM) that was used as part of NASA’s Modern-Era Retrospective Analysis for Research and Applications (MERRA) is described in Rienecker et al. (2008), and most of the subse-quent development of the physical parameterizations for the current, MERRA2 version
5
is described in Molod et al. (2012). In addition to the changes in the physical param-eterizations, the development of the MERRA2 AGCM also included two fundamental elements that will not be addressed in the present study. The horizontal discretiza-tion of the MERRA2 AGCM is computed on the cubed sphere grid of Putman and Lin (2007), although it still retains the option to use the latitude/longitude discretization.
10
The cubed sphere grid allows for the relative uniformity of grid spacing at all latitudes, and avoids the grid spacing singularities found in the latitude/longitude grid. In addition, the MERRA2 AGCM has been modified to account for the change in total mass due to the change in total water content computed in the moist and turbulence processes. The total mass of each layer is adjusted to include these changes in total water content,
15
and the associated adjustment is then made to the specific masses of all constituents, including water substances. The benefit for the AGCM mean simulated climate is small, but results in the conservation of dry mass during the simulation. The algorithm for this adjustment and the benefits for AGCM simulations and data assimilation experiments are described in detail in Takacs et al. (2014).
20
A brief summary of the model’s physical parameterizations relevant to the present study is provided here. The GEOS-5 AGCM physics includes parameterization schemes for atmospheric convection, large scale precipitation and cloud cover, long-wave and shortlong-wave radiation, turbulence, gravity long-wave drag, a land surface model, a thermodynamic sea ice model, and a simple glacier model.
25
GMDD
7, 7575–7617, 2014GEOS5 AGCM MERRA to MERRA2
A. Molod et al.
Title Page
Abstract Introduction
Conclusions References
Tables Figures
◭ ◮
◭ ◮
Back Close
Full Screen / Esc
Printer-friendly Version Interactive Discussion
Discussion
P
a
per
|
Discussion
P
a
per
|
Discussion
P
a
per
|
Discussion
P
a
per
|
function (Bacmeister and Stephens, 2011) governs the upper limits on the allowable entrainment by sampling from a probability distribution function with specified parame-ters. The prognostic cloud cover and cloud water and ice scheme is from Bacmeister et al. (2006). The scheme includes large scale condensation governed by the proba-bility distribution function described in Molod (2012), evaporation, autoconversion and
5
accretion of cloud water and ice, sedimentation of cloud ice and re-evaporation of falling precipitation.
The turbulence parameterization is based on the non-local scheme of Lock (2000) scheme, acting together with the Richardson-number based scheme of Louis and Ge-leyn (1982). The original Lock scheme was extended in GEOS-5 to include moist
heat-10
ing and entrainment in the unstable surface parcel calculations. The Monin–Obukhov similarity theory based parameterization of surface layer turbulence is described in Helfand and Schubert (1995), and includes the effects of a viscous sublayer for heat and moisture transport over all surfaces except land. The ocean roughness is deter-mined by a polynomial which is a blend of the algorithms of Large and Pond (1981) and
15
Kondo (1975), modified in the mid-range wind regime based on recent observations in the southern ocean according to Garfinkel et al. (2011) and in the high wind regime according to Molod et al. (2013).
The longwave radiative processes are described by Chou and Suarez (1994), and the shortwave radiative processes are from Chou and Suarez (1999). The gravity wave
20
parameterization computes the momentum and heat deposition into the grid-scale flow due to orographic (McFarlane, 1987) and nonorographic (after Garcia and Boville, 1994) gravity wave breaking. The Land Surface Model from Koster et. al (2000) is a catchment-based scheme that treats subgrid scale heterogeneity in surface mois-ture statistically. Glacial thermodynamic process are parameterized using an
adapta-25
GMDD
7, 7575–7617, 2014GEOS5 AGCM MERRA to MERRA2
A. Molod et al.
Title Page
Abstract Introduction
Conclusions References
Tables Figures
◭ ◮
◭ ◮
Back Close
Full Screen / Esc
Printer-friendly Version Interactive Discussion
Discussion
P
a
per
|
Discussion
P
a
per
|
Discussion
P
a
per
|
Discussion
P
a
per
|
3 Evolution of low resolution simulated climate from MERRA AGCM
to MERRA2 AGCM
The mean climate characteristics of a single 30 year MERRA2 AGCM simulation on the latitude/longitude grid at a horizontal resolution of 0.5◦
×0.5◦ were evaluated by comparison with reanalysis and with different satellite and in situ based observational
5
estimates (Molod et al., 2012). They found substantial improvements in some key as-pects of the mean circulation in the MERRA2 version of the GEOS-5 AGCM, and also reported on existing discrepancies between the modeled and observed climates. Here we present the results of a series of experiments designed to attribute each fundamen-tal improvement in AGCM simulated climate to a specific change in parameterization.
10
The experiments to be described in this section were all conducted on the lati-tude/longitude grid at 2.0◦
×2.5◦horizontal resolution, on a vertical hybrid eta-pressure coordinate grid with 72 levels, spaced to increase the resolution near the surface and near the tropopause. The simulations were all forced with observed sea surface tem-peratures (Reynolds, 2002), and ran for 30 years each. The sequence of experiments
15
was designed to start with the MERRA2 AGCM as the control and backtrack, one pa-rameterization change at a time or small groups of papa-rameterization changes as a time, to a model that replicates the MERRA AGCM simulated climate. The parameterization changes are listed in Table 1, and the full sequence of the control and 7 sensitivity experiments to be described in this section is listed in Table 2.
20
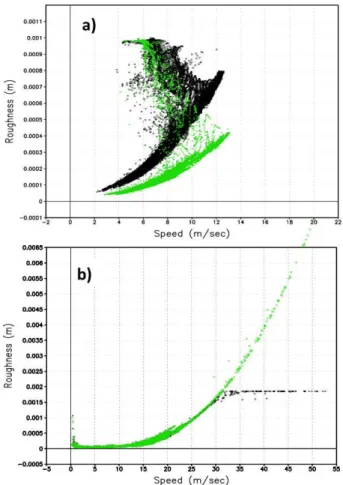
3.1 Ocean surface winds
The parameterization of the surface layer turbulence in the MERRA2 AGCM includes a substantial modification of the functional relationship between ocean surface rough-ness and wind stress, shown in Fig. 1. The relationship for the moderate range sur-face wind speeds from the MERRA AGCM (green) and the MERRA2 AGCM (black)
25
GMDD
7, 7575–7617, 2014GEOS5 AGCM MERRA to MERRA2
A. Molod et al.
Title Page
Abstract Introduction
Conclusions References
Tables Figures
◭ ◮
◭ ◮
Back Close
Full Screen / Esc
Printer-friendly Version Interactive Discussion
Discussion
P
a
per
|
Discussion
P
a
per
|
Discussion
P
a
per
|
Discussion
P
a
per
|
reverts back to the formulation for the relationship between ocean surface roughness and stress used in the MERRA AGCM. The effect for simulations at 2.0◦
×2.5◦ resolu-tion is expected be an increase in the experiment 1 simulated surface wind speeds in the mid-range of wind speeds, that is, in the 5 to 25 m s−1range. Figure 1b shows the
relationship between wind speed and roughness for a larger range of wind speeds after
5
Molod et al. (2013), where the reduction of roughness at speeds greater than approxi-mately 30 m s−1is apparant. This change is expected to result in a net increase of wind
speeds in higher wind regimes as was shown in Molod et al. (2013) for simulations at 0.25◦ resolution, but this impact is not apparent at the resolution of the experiments
described here because the simulated wind speeds generally do not reach 30 m s−1. 10
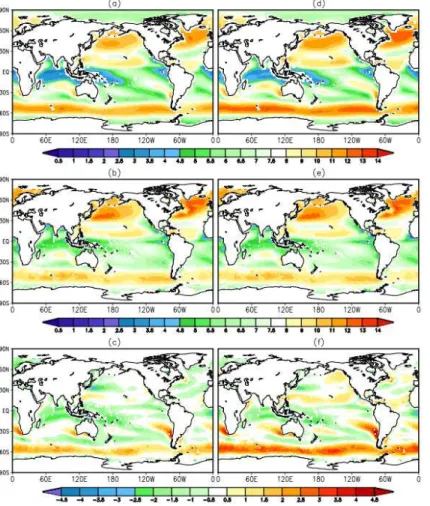
Surface wind speeds from the MERRA2 AGCM control and experiment 1 are shown in Fig. 2. The change in the simulated surface winds is most apparent in the Southern Hemisphere, where the Goddard Satellite-based Surface Turbulent Fluxes (GSSTF, Shie et al., 2009) surface winds, seen in Fig. 2b, show values near 8 m s−1,
experi-ment 1 (Fig. 2d) shows surface winds near 12 m s−1and the MERRA2 AGCM control 15
(Fig. 2a) shows surface winds near 10 m s−1. The di
fference from the GSSTF estimate (shown in Fig. 2c and 2f) shows a reduction in the difference from up to 4 m s−1in
exper-iment 1 to a difference of up to 2 m s−1in the MERRA2 AGCM control, pointing out the
improvement in AGCM simulated climate due to the change in roughess formulation.
3.2 Quasi-biennial oscillation
20
The latitudinal profile of background nonorographic drag in the MERRA2 AGCM was modified to include a specified source related to tropical precipitation in addition to the local maxima related to storm track precipitation. The background profiles used in the MERRA2 and the MERRA AGCMs are shown in Fig. 3. Experiment 2 of the series examines the impact of the change in the gravity wave drag parameterization of
back-25
GMDD
7, 7575–7617, 2014GEOS5 AGCM MERRA to MERRA2
A. Molod et al.
Title Page
Abstract Introduction
Conclusions References
Tables Figures
◭ ◮
◭ ◮
Back Close
Full Screen / Esc
Printer-friendly Version Interactive Discussion
Discussion
P
a
per
|
Discussion
P
a
per
|
Discussion
P
a
per
|
Discussion
P
a
per
|
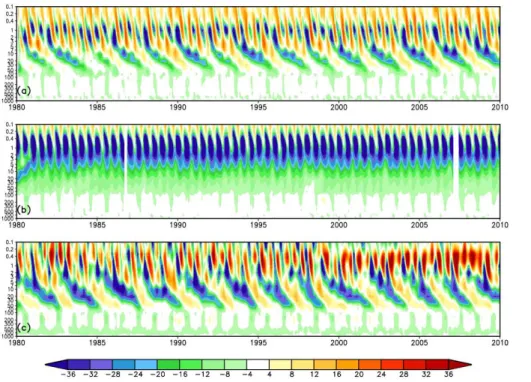
of the zonal wind as a function of height and time is shown in Fig. 4. The patterns of large easterly and westerly winds that slant downwards in pressure as time proceeds indicate the downward propagation of the variations due to the QBO. The QBO pattern is seen in Fig. 4a and c, which are the results from experiment 1 from and MERRA reanalysis (Rienecker et al., 2011), respectively. Figure 4b, however, that shows the
5
results of experiment 2 that uses the old background drag formulation (from Fig. 3), shows no QBO pattern of variability.
3.3 Stable surface layer fluxes
The parameterization of the surface layer in the MERRA2 AGCM uses the scheme of Helfand and Schubert (1995) based on Monin-Obhukov (MO) similarity theory. The
10
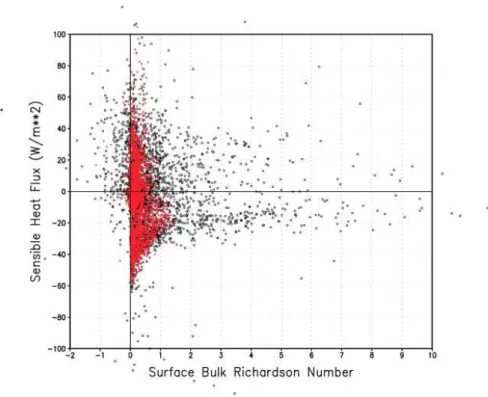
scheme replaced the Louis (1979) scheme used in the MERRA AGCM. The imple-mentation of the MO scheme included the use of a different set of stable layer stability functions, and a different formulation for the viscous sublayer (the laminar layer that can act to impede the flux of heat and moisture). The stable surface layer stability functions in the Helfand scheme result in an increased turbulent heat exchange (of both signs)
15
under stable conditions. Figure 5 shows a scatter diagram of the sensible heat flux as a function of surface bulk Richardson number under conditions where the monthly mean air temperature exceeds the monthly mean skin temperature. The black points are from the simulation with the Helfand surface layer, and the red are from the sim-ulation using the Louis scheme. The larger values of sensible heat flux in the Helfand
20
simulation are apparent, and even more apparent when the monthly mean sensible heat flux is downward.
Experiment 3 was designed to examine the impact of the change in the surface layer parameterization by reverting back from the Helfand and Schubert scheme to the Louis scheme. Figure 6 shows the sensible heat flux from experiments 2 and 3 along with the
25
GMDD
7, 7575–7617, 2014GEOS5 AGCM MERRA to MERRA2
A. Molod et al.
Title Page
Abstract Introduction
Conclusions References
Tables Figures
◭ ◮
◭ ◮
Back Close
Full Screen / Esc
Printer-friendly Version Interactive Discussion
Discussion
P
a
per
|
Discussion
P
a
per
|
Discussion
P
a
per
|
Discussion
P
a
per
|
the difference in sensible heat flux is negative, indicating less sensible heating when using the Louis scheme. This sign of the difference is consistent with the removal of the viscous sublayer over land surfaces in the Helfand scheme, that would remove some resistance to turbulent exchange that is present over unvegetated land surfaces in the Louis scheme due to the viscous sublayer. Figure 6c also shows regions where the
5
sensible heat flux is greater in the Louis scheme than in the Helfand scheme. These are regions where the surface layer is stable, and where the sensible heat itself is largely downward (that is, the air temperature is greater than the skin temperature). The change in stability functions between the Louis and Helfand scheme, that allows more turbulent exchange in the Helfand scheme, is consistent with the sign of the
10
difference in sensible heat flux in regions where the heat flux is downward.
3.4 Atmospheric moisture, clouds and stationary wave pattern
3.4.1 Critical relative humidity
The algorithm for large scale condensation, as described in Bacmeister et al. (2006), assumes that the probability distribution function (PDF) of total water is “top-hat”
15
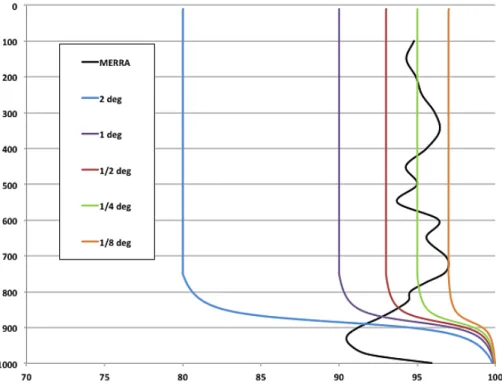
shaped. The width of the PDF can be shown to be associated with a “critical rela-tive humidity” (RHcrit) that governs cloud macrophysical and microphysical processes such as condensation and evaporation (Molod, 2012). The relationship between RHcrit and PDF width is such that a wider PDF corresponds to a lower RHcrit. The MERRA2 AGCM RHcrit (Molod, 2012) represents a change in both the magnitude and vertical
20
structure from the RHcritin the MERRA AGCM. Typical RHcritprofiles from the MERRA and MERRA2 AGCMs are shown in Fig. 7, and indicate generally lower values in the MERRA2 AGCM formulation except in the boundary layer, where turbulent mixing is sufficient to homogenize the total water distribution and so result in narrower PDF.
Experiment 5 was designed to examine the impact of the change in RHcrit. Removing
25
GMDD
7, 7575–7617, 2014GEOS5 AGCM MERRA to MERRA2
A. Molod et al.
Title Page
Abstract Introduction
Conclusions References
Tables Figures
◭ ◮
◭ ◮
Back Close
Full Screen / Esc
Printer-friendly Version Interactive Discussion
Discussion
P
a
per
|
Discussion
P
a
per
|
Discussion
P
a
per
|
Discussion
P
a
per
|
a higher relative humidity (RH). The zonal mean relative humidity from experiments 4 and 5, along with the difference between them, is shown in Fig. 8. The experiment 5 mi-nus experiment 4 difference shows a clear increase in relative humidity in the MERRA AGCM-like experiment due to the increase in RHcrit. Relative to available observational verification, the MERRA2 AGCM shows a general wet bias (Molod et al., 2012), which
5
means that the experiment 4 relative humidity field is closer to the observed than ex-periment 5’s RH field.
In addition to having a substantial impact on atmospheric moisture, the change in RHcritalso had an impact on the distribution of cloud cover. The higher RHcritsimulation (the MERRA AGCM-like experiment) could either be expected to have less cloud cover
10
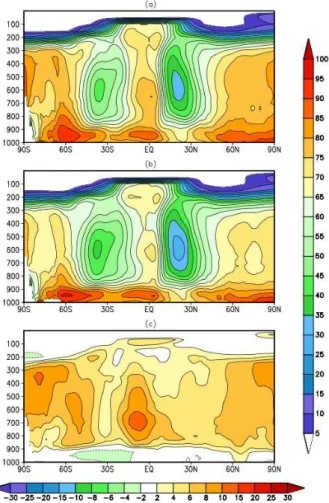
because the atmosphere must contain more moisture before new cloud water will be condensed, or could be expected to have more cloud cover due to the feedback of a generally moister atmosphere. Figure 9 shows the zonal mean cloud cover from experiments 4 and 5, and an observational estimate of zonal mean cloud cover from AIRS. The MERRA AGCM-like experiment, experiment 5 (Fig. 9a), shows increased
15
cloud cover in the 300–600 mb range relative to the MERRA2 AGCM-like experiment, in particular at high latitudes in both hemispheres. In this regard, the MERRA2 AGCM-like experiment result more closely resembles the AIRS cloud cover estimate (Fig. 9c). This result confirms the hypothesis that higher RHcrit results in an atmosphere that is wetter in the mean and has more cloud. The MERRA-like AGCM result (experiment
20
5) also shows smaller cloud cover near the boundary layer at almost all latitudes. At high latitudes, the MERRA2 AGCM-like boundary layer cloud more closely resembles the AIRS estimate, in the tropics the MERRA2 AGCM-like boundary layer cloud is larger than AIRS, while the MERRA AGCM-like boundary layer cloud is smaller. The change in boundary layer cloud between the MERRA AGCM-like experiment and the
25
GMDD
7, 7575–7617, 2014GEOS5 AGCM MERRA to MERRA2
A. Molod et al.
Title Page
Abstract Introduction
Conclusions References
Tables Figures
◭ ◮
◭ ◮
Back Close
Full Screen / Esc
Printer-friendly Version Interactive Discussion
Discussion
P
a
per
|
Discussion
P
a
per
|
Discussion
P
a
per
|
Discussion
P
a
per
|
3.4.2 Re-evaporation of precipitation and condensate
The MERRA2 AGCM scheme for the re-evaporation of precipitation and suspended cloud water and ice contains a series of new parameter settings that result in a sub-stantial increase over the MERRA model in the re-evaporation of snow and ice. The impact of the changes in parameter settings on the water vapor source due to
re-5
evaporation for the December-January-February average is shown in Fig. 10. The largest increase in the MERRA2 AGCM is aloft, near 500 mb, where the increase is up to 0.7 g kg−1day−1.
Experiment 6 examines the impact of the change in re-evaporation of snow and ice in the MERRA2 AGCM, that is perhaps the most crucial parameterization change.
10
The removal of this change is expected to result in a drier atmosphere, in particular aloft. Because of the importance of this change in parameterization, this simulation is expected to resemble in large part the climatology of the AGCM used as part of MERRA. Figure 11 shows the direct impact of the change from the MERRA2 AGCM to the MERRA AGCM re-evaporation, and, as expected, shows the drying related to
15
the reduced re-evaporation in the MERRA AGCM-like experiment. Figure 11a–c shows the change in total precipitable water, and the difference (MERRA AGCM formulation minus MERRA2 AGCM formulation, shown in 11c) is always negative everywhere. The vertical distribution of the moisture is shown with the specific humidity in Fig. 11d–f, where the difference plot (Fig. 11f) also shows an almost global reduction in
atmo-20
spheric water vapor.
The resulting mean circulation in boreal winter underwent a substantial change as-sociated with this drying, and represents the most substantial impact on the simulated climate of all the elements of the MERRA AGCM to MERRA2 AGCM transition. Fig-ure 12 shows the subtantial impact that changing the moistFig-ure levels had on the 30 year
25
GMDD
7, 7575–7617, 2014GEOS5 AGCM MERRA to MERRA2
A. Molod et al.
Title Page
Abstract Introduction
Conclusions References
Tables Figures
◭ ◮
◭ ◮
Back Close
Full Screen / Esc
Printer-friendly Version Interactive Discussion
Discussion
P
a
per
|
Discussion
P
a
per
|
Discussion
P
a
per
|
Discussion
P
a
per
|
Convergence Zone (ITCZ) structure that is properly placed in longitude, a South Pa-cific Convergence Zone (SPCZ) that properly slants from the western PaPa-cific to the southeast, and more accurately simulated storm track maxima. The precipitation field represents improvements in all these areas related to the MERRA AGCM-like simu-lation (experiment 6) shown in Fig. 12a. The change in the tropical precipitation field
5
related to the additional drying in experiment 6 also resulted in substantial changes in the Pacific teleconnection patterns, specifically the Pacific-North-America (PNA) pat-tern in boreal winter. The eddy height field is an indicator of the strength of the PNA, and is shown in Fig. 13 in relation to the eddy height from MERRA reanalysis. The MERRA2 AGCM-like simulated PNA pattern (Fig. 12d) has a stronger and more
prop-10
erly oriented ridge near the west coast of North America relative to the PNA as simu-lated by the MERRA AGCM-like experiment (Fig. 12a). This change has implications for the poleward propagation of heat and momentum. The SD of the difference from MERRA reanalysis estimates is also substantially reduced in experiment 5 (16.8 m) relative to experiment 6 (20.3 m). The direct impact of the change in re-evaporation
15
was also evident in the boreal summer climatology. Figure 14 shows this both in the total precipitable water fields and in the specific humidity fields, that exhibit differences between experiments 5 and 6 that are of the order of the differences seen in boreal winter. The impact on the mean summertime circulation, however, was minimal.
3.5 Breakup of the Southern Hemisphere stratospheric jet
20
The changes to the gravity wave drag parameterization included the modification of the “intermittency factor”, used to reduce the strength of the gravity wave drag based on expected departure from linear theory. The value of the intermittency factor was increased in the MERRA2 AGCM for orographic waves as a function of latitude, chang-ing from a MERRA AGCM global value of 0.125 to values reachchang-ing 0.3125 south of
25
approximately 40◦S.
GMDD
7, 7575–7617, 2014GEOS5 AGCM MERRA to MERRA2
A. Molod et al.
Title Page
Abstract Introduction
Conclusions References
Tables Figures
◭ ◮
◭ ◮
Back Close
Full Screen / Esc
Printer-friendly Version Interactive Discussion
Discussion
P
a
per
|
Discussion
P
a
per
|
Discussion
P
a
per
|
Discussion
P
a
per
|
AGCM. The removal of the intermittency change is expected to decrease the orograph-ically induced drag in the Southern Hemisphere, thereby depositing less momentum aloft and increasing the strength of the westerlies. The zero-wind contour in the South-ern Hemisphere can be used as an indicator of the level and timing of the stratospheric jet breakup. Figure 15 shows the zero-wind contour from experiment 7, experiment
5
6, and MERRA. At the 2◦ horizontal resolution of the simulations described here, the
zero wind line is higher in altitude and delayed in time relative to MERRA in both sim-ulations, reflecting a delayed stratospheric jet breakup. The decreased intermittency factor in experiment 7, however, delays the jet breakup even more, showing the im-provement in the MERRA2 AGCM-like simulation relative to the MERRA AGCM-like
10
simulation. At higher spatial resolution (not shown) the increase of intermittency factor in the MERRA2 AGCM is effective in producing a reasonable evolution of the polar vortex breakdown in the Southern Hemisphere.
4 High resolution simulations and resolution aware behavior in
the MERRA2 AGCM
15
The modifications to the MERRA2 AGCM physical parameterizations described above resulted in improvements in simulated climate at all the resolutions relevant to GMAO. Additional developments were implemented in the MERRA2 AGCM that were particu-larly applicable to higher resolution (0.25◦ or higher) simulations. These included the
changes in ocean surface roughness at high wind speeds (mentioned in Sect. 3.1 and
20
examined in detail in Molod et al., 2013) and the implementation of “resolution aware” parameters.
The implementation of the “resolution aware” behavior of the moist processes in the MERRA2 version of the GEOS-5 AGCM was designed to improve the behavior of the high resolution simulations and to ensure more uniformity of model mean state
25
GMDD
7, 7575–7617, 2014GEOS5 AGCM MERRA to MERRA2
A. Molod et al.
Title Page
Abstract Introduction
Conclusions References
Tables Figures
◭ ◮
◭ ◮
Back Close
Full Screen / Esc
Printer-friendly Version Interactive Discussion
Discussion
P
a
per
|
Discussion
P
a
per
|
Discussion
P
a
per
|
Discussion
P
a
per
|
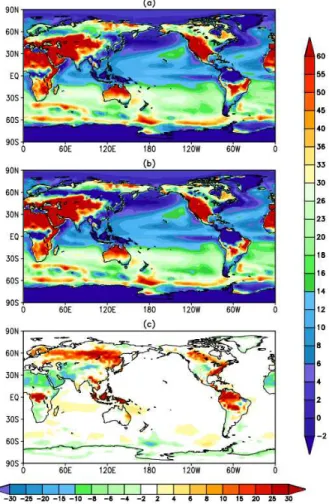
were meant to address. Panels 16a–c show the specific humidity at 1.◦, 0.5◦and 0.25◦
resolution, and panels 16g–i show the increase of the bias in atmospheric moisture content relative to EC-Interim reanalysis (Dee et al., 2011) as the resolution increases. In order to mitigate this change in simulated climate with increasing resolution, the MERRA2 AGCM moist physics was modified to include two governing parameters that
5
are specified a priori as a function of horizontal resolution. These are the critical relative humidity used for large scale condensation, and a parameter which governs the mini-mum allowable entrainment used for the “stochastic Tokioka trigger” of the convective parameterization.
The dependance of RHcrit on horizontal resolution is based on the Molod (2012)
10
analysis of a global mesoscale simulation, and is such that the RHcrit increases with finer resolution, as was seen in the progression from the 2◦ resolution curve up to
the 0.25◦ curve in Fig. 7. This progression is consistent with an intuitive expectation
that the variability of total water within an AGCM grid cell decreases as the grid cell becomes smaller. The implementation of the horizontal resolution dependance of RHcrit
15
(as described in Sect. 2) in the MERRA2 AGCM resulted in an atmospheric moisture field that is more consistent across different resolutions, as seen in Fig. 17.
The MERRA2 version of the GEOS-5 AGCM also includes a horizontal resolution dependant and stochastic Tokioka (1988) type trigger (described in Bacmeister and Stephens, 2011) as part of the RAS convective parameterization. The cloud model in
20
RAS computes the effect of individual entraining cloud plumes, and the trigger acts to effectively eliminate any cloud plume with too small an entrainment during ascent. Bacmeister and Stephens (2011) examined the observed relationship between the neutral bouyancy level of a particular sounding and the observed condensate (a proxy for the convective detrainment level), and found that this observational relationship can
25
GMDD
7, 7575–7617, 2014GEOS5 AGCM MERRA to MERRA2
A. Molod et al.
Title Page
Abstract Introduction
Conclusions References
Tables Figures
◭ ◮
◭ ◮
Back Close
Full Screen / Esc
Printer-friendly Version Interactive Discussion
Discussion
P
a
per
|
Discussion
P
a
per
|
Discussion
P
a
per
|
Discussion
P
a
per
|
examine the impact of different choices of the PDF governing parameter on the simu-lation of strong tropical storms in the GEOS-5 AGCM.
The resolution dependance of the stochastic Tokioka trigger is such that it more sev-erly limits the parameterized convective mass flux at high spatial resolution, where we expect the larger scale convective updrafts to be resolved explicitly, and has little
im-5
pact at low resolution. The change with resolution of the PDF parameters is shown in Fig. 18, presently specified in an ad hoc manner. Figure 19 shows a sequence of the resulting June averaged convective mass fluxes from simulations with different hori-zontal resolutions. The decrease of parameterized mass flux with resolution reflects the increasingly restrictive trigger, selected from the PDFs with increasingly higher
mimi-10
mum entrainment values shown in Fig. 18. The effect of this repressed RAS mass flux on the simulated climate is reflected in the total change in moisture due to moist pro-cesses, shown in Fig. 20. The cloud model in RAS includes a grid scale subsidence to compensate for the updraft mass flux that results in a drying of the sub-cloud layer. Fig-ure 20 shows the decrease of the low level drying with increased horizontal resolution.
15
The benefits of the reduced low level drying and the related maintenance of the cumu-lus available potential energy during tropical storm development at high resolution was demonstrated in the study of Lim et al. (2014).
5 Conclusions
5.1 Synthesis and discussion
20
The version of the GEOS-5 AGCM used in the Goddard Modeling and Assimilation Office (GMAO) MERRA2 reanalysis was developed for use across many different resolutions and applications. A unique series of AGCM simulations were performed with the GEOS-5 AGCM to detail the impact of each change in parameterization be-tween the MERRA version and the current MERRA2 version. The series of sensitivity
GMDD
7, 7575–7617, 2014GEOS5 AGCM MERRA to MERRA2
A. Molod et al.
Title Page
Abstract Introduction
Conclusions References
Tables Figures
◭ ◮
◭ ◮
Back Close
Full Screen / Esc
Printer-friendly Version Interactive Discussion
Discussion
P
a
per
|
Discussion
P
a
per
|
Discussion
P
a
per
|
Discussion
P
a
per
|
experiments began with the current AGCM version and regressed, one step of devel-opment at a time, to the MERRA AGCM.
The most substantial positive impact on the simulated AGCM climate was shown to be attributable to the increase of the re-evaporation of frozen cloud water and precipita-tion in the MERRA2 AGCM. The resulting atmosphere had a higher moisture content,
5
and many aspects of the boreal winter climate were substantially improved relative to reanalysis. The moisture and cloud cover amounts were shown to be further improved by the implementation of an AIRS-based PDF of total water.
The development of the MERRA2 AGCM also included the implementation of a set of parameters governing moist processes that contain an a priori change in
behav-10
ior with horizontal resolution. The parameters are ones which govern the mimimum allowable entrainment into a convective updraft, and govern the atmospheric relative humidity needed for the onset of condensation. Results of a limited set of experiments were shown to demonstrate the benefits of this “resolution aware” behavior at higher resolution.
15
This study was focused on the results of atmosphere only simulations, but the result-ing model has also performed well in coupled atmosphere ocean, coupled atmosphere chemistry, data assimilation, numerical weather prediction and global mesoscale appli-cations.
Code availability
20
The GEOS-5 source code is available under the NASA Open Source Agreement at http://opensource.gsfc.nasa.gov/projects/GEOS-5/.
Acknowledgements. The GEOS-5 AGCM development in the Global Modeling and Assimila-tion Office is funded by NASA’s Modeling, Analysis and Prediction (MAP) program under WBS 802678.02.17.01.211 and 802678.02.17.01.25. The authors gratefully acknowledge the sup-25
GMDD
7, 7575–7617, 2014GEOS5 AGCM MERRA to MERRA2
A. Molod et al.
Title Page
Abstract Introduction
Conclusions References
Tables Figures
◭ ◮
◭ ◮
Back Close
Full Screen / Esc
Printer-friendly Version Interactive Discussion
Discussion
P
a
per
|
Discussion
P
a
per
|
Discussion
P
a
per
|
Discussion
P
a
per
|
AGCM. The analysis of GEOS-5 AGCM simulations at many spatial and temporal scales was performed by Siegfried Schubert, Yehui Chang and Myong-In Lee, and the analysis of the GCM performance in data assimilation and numerical weather prediction modes was performed by Stephen Bloom, Gary Partyka and Austin Conaty. The feedback from William Putman about the performance of the AGCM at very high horizontal resolution was critical in the ability to 5
run the GEOS-5 AGCM seamlessly across a wide range of resolutions, and the analysis of the transport of tracers done by Lesley Ott aided in the understanding of model errors. In addi-tion, the feedback to AGCM development from GMAO scientists involved in the development of the other component models of the GEOS-5 GCM, including Yury Vikhaelev, Bin Zhao, J. Eric Nielsen, Arlindo da Silva, Randal Koster, Rolf Reichle and Sarith Mahanama, was invaluable. 10
In addition, the efforts of Peter Norris in the development and testing of the satellite simulator component of the GCM are appreciated. The authors also gratefully acknowledge the contribu-tions to the AGCM infrastructure of Atanas Tryanov, Matt Thompson and Ben Auer, that made the AGCM tractable and portable to different platforms. All of these contributions made the simulations possible. The simulations were performed at the the NASA Center for Climate Sim-15
ulation (NCCS) at Goddard Space Flight Center and at the NASA Advanced Supercomputing (NAS) Division at Ames Research Center. The authors gratefully acknowledge the support of personnel at both of those computing centers. Finally, author Molod prepared the manuscript at two GAIN writing retreats, sponsored by NSF grant number 0620087.
References
20
Bacmeister, J. T. and Stephens, G.: Spatial statistics of likely convective clouds in CloudSat data, J. Geophys. Res., 116, D04104, doi:10.1029/2010JD014444, 2011.
Bacmeister, J. T., Suarez, M. J., and Robertson, F. R.: Rain reevaporation, boundary layer–convection interactions, and Pacific rainfall patterns in a AGCM, J. Atmos. Sci., 63, 3383–3403, 2006.
25
GMDD
7, 7575–7617, 2014GEOS5 AGCM MERRA to MERRA2
A. Molod et al.
Title Page
Abstract Introduction
Conclusions References
Tables Figures
◭ ◮
◭ ◮
Back Close
Full Screen / Esc
Printer-friendly Version Interactive Discussion
Discussion
P
a
per
|
Discussion
P
a
per
|
Discussion
P
a
per
|
Discussion
P
a
per
|
Chou, M.-D. and Suarez, M. J.: A Solar Radiation Parameterization for Atmospheric Studies, NASA Tech. Memorandum 104606-Vol 15, NASA, Goddard Space Flight Center, Greenbelt, MD, 1999.
Cullather, R. L., Nowicki, S. M. J., Zhao, B., and Suarez, M. J.: Evaluation of the surface representation of the Greenland ice sheet in a general circulation model, J. Climate, 27, 5
4835–4856, doi:10.1175/JCLI-D-13-00635.1, 2014.
Dee, D. P., Uppala, S. M., Simmons, A. J., Berrisford, P., Poli, P,. Kobayashi, S., Andrae, U., Balmaseda, M. A., Balsamo, G., Bauer, P., Bechtold, P., Beljaars, A. C. M., van de Berg, L., Bidlot, J., Bormann, N., Delsol, C., Dragani, R., Fuentes, M., Geer, A. J., Haimberger, L., Healy, S. B., Hersbach, H., Hólm, E. V., Isaksen, L., Kållberg3, P., Köhler, M., Matricardi, M., 10
McNally, A. P., Monge-Sanz, B. M., Morcrette, J.-J., Park, B.-K., Peubey, C., de Rosnay, P., Tavolato, C., Thépaut, J.-N., and Vitart, F.: The ERA-Interim reanalysis: configuration and performance of the data assimilation system, Q. J. Roy. Meteor. Soc., 137, 553–597, 2011. Donner, L. J., Wyman, B. L., Hemler, R. S., Horowitz, L. W., Ming, Y., Zhao, M., Golaz, J.-C.,
Ginoux, P., Lin, S.-J., Schwarzkopf, M. D., Austin, J., Alaka, G., Cooke, W. F., Delworth, T. 15
L., Friedenreich, S. M., Gordon, C. T., Griffies, S. M., Held, I.M., Hurlin, W. J., Klein, S. S., Knutson, R. R., Langenhorst, A. R., Lee, H.-C., Lin, Y., Magi, B.I., Malyshev, S. L., Milly, C. D., Naik, V., Nath, M. J., Pincus, R., Ploshay, J. J., Ramsawamy, V., Seman, C. J., Shevlaikova, E., Sirutis, J., Stern, W. F., Stouffer, R. J., Wilson, R. J., Winton, M., Wittenberg, A. T., and Zen, F.: The dynamical core, physical parameterizations, and basic simulation characteristics 20
of the atmospheric component AM3 of the GFDL global coupled model CM3, J. Climate, 24, 3484, doi:10.1175/2011JCLI3955.1, 2011.
Duynkerke, P. and de Roode, S.: Surface energy balance and turbulence characteristics ob-served at the SHEBA Ice Camp during FIRE III, J. Geophys. Res., 106, 15313–15322, doi:10.1029/2000JD900537, 2001.
25
Helfand, H. M. and Schubert, S. D.: Climatology of the simulated great plains low-level jet and its contribution to the continental moisture budget of the United States, J. Climate, 8, 784–806, 1995.
Huffman, G., Adler, R. F., Rudolf, B., Schneider, U., and Keehn, P. R.: Global precipitation estimates based on a technique for combining satellite-based estimates, rain gauge analysis, 30
GMDD
7, 7575–7617, 2014GEOS5 AGCM MERRA to MERRA2
A. Molod et al.
Title Page
Abstract Introduction
Conclusions References
Tables Figures
◭ ◮
◭ ◮
Back Close
Full Screen / Esc
Printer-friendly Version Interactive Discussion
Discussion
P
a
per
|
Discussion
P
a
per
|
Discussion
P
a
per
|
Discussion
P
a
per
|
Garcia, R. R. and Boville, B. A.: Downward control of the mean meridional circulation and temperature distribution of the polar winter stratosphere, J. Atmos. Sci., 51, 2238–2245, 1994.
Garfinkel, C. I., Molod, A., Oman, L. D., and Song, I.-S.: Improvement of the GEOS-5 AGCM upon updating the air–sea roughness parameterization, Geophys. Res. Lett., 38, L18702, 5
doi:10.1029/2011GL048802, 2011.
Kondo, J.: Air–sea bulk transfer coefficients in diabatic conditions, Bound.-Lay. Meteorol., 9, 91–112, 1975.
Koster, R. D., Suarez, M. J., Ducharne, A., Stieglitz, M., and Kumar, P.: A catchment-based approach to modeling land surface processes in a GCM, Part 1, Model structure, J. Geophys. 10
Res., 105, 24809–24822, 2000.
Large, W. G. and Pond, S.: Open ocean momentum flux measurements in moderate to strong winds, J. Phys. Oceanogr., 11, 324–336, 1981.
Lim, Y.-K., Schubert, S. D., Reale, O., Lee, M.-I., Molod, A., and Suarez, M. J.: Sensitivity of tropical cyclones to parameterized 2 convection in the NASA GEOS5 model, J. Climate, in 15
press, 2014.
Lock, A. P., Brown, A. R., Bush, M. R., Martin, G. M., and Smith, R. N. B.: A new boundary layer mixing scheme, Part I: Scheme description and single-column model tests, Mon. Weather Rev., 138, 3187–3199, 2000.
Louis, J. E.: A parametric model of vertical eddy fluxes in the atmosphere, Bound.-Lay. Meteo-20
rol., 17, 187–202, 1979.
Louis, J. and Geleyn, J.: A short history of the PBL parameterization at ECMWF, Proc. ECMWF Workshop on Planetary Boundary Layer Parameterization, ECMWF, Reading, UK, 59–80, 1982.
McFarlane, N. A.: The effect of orographically excited gravity-wave drag on the circulation of 25
the lower stratosphere and troposphere, J. Atmos. Sci., 44, 1775–1800, 1987.
Molod, A.: Constraints on the profiles of total water PDF in AGCMs from AIRS and a high-resolution model, J. Climate, 25, 8341–8352, 2012.
Molod, A., Takacs, L. L., Suarez, M. J. (Ed.), Bacmeister, J. T., Song, I.-S., and Eichmann, A.: The GEOS-5 Atmospheric General Circulation Model: Mean Climate and Development from 30
GMDD
7, 7575–7617, 2014GEOS5 AGCM MERRA to MERRA2
A. Molod et al.
Title Page
Abstract Introduction
Conclusions References
Tables Figures
◭ ◮
◭ ◮
Back Close
Full Screen / Esc
Printer-friendly Version Interactive Discussion
Discussion
P
a
per
|
Discussion
P
a
per
|
Discussion
P
a
per
|
Discussion
P
a
per
|
Molod, A., Suarez, M. J., and Partyka, G.: The impact of limiting ocean roughness on GEOS-5 AGCM tropical cyclone forecasts, Geophys. Res. Lett., 40, 411–415, doi:10.1029/2012GL053979, 2013.
Moorthi, S. and Suarez, M. J.: Relaxed Arakawa Schubert: a parameterization of moist convec-tion for general circulaconvec-tion models, Mon. Weather Rev., 120, 978–1002, 1992.
5
Neale, R. B., Richter, J., Park, S., Lauritzen, P. H., Vavrus, S. J., Rasch, P. J., and Zhang, M.: The Mean Climate of the Community Atmosphere Model (CAM4) in forced SST and fully coupled experiments, J. Climate, 26, 5150–5168, doi:10.1175/JCLI-D-12-00236.1, 2013. Pope, V. D., Gallani, M. L., Rowntree, P. R., and Stratton, R. A.: The impact of new physical
parametrizations in the Hadley Centre climate model – HadAM3, Clim. Dynam., 16, 123–146, 10
doi:10.1007/s003820050009, 2000.
Rienecker, M. M., Suarez, M. J., Todling, R., Bacmeister, J., Takacs, L., Liu, H.-C. Gu, W., Sienkiewicz, M., Koster, R. D., Gelaro, R., Stajner, I., and Nielsen, J. E.: The GEOS-5 Data Assimilation System – Documentation of versions 5.0.1 and 5.1.0, and 5.2.0. NASA Tech. Rep. Series on Global Modeling and Data Assimilation, NASA/TM-2008-104606, Vol. 27, 92 15
pp., 2008.
Rienecker, M. M., Suarez, M. J., Gelaro, R., Todling, R., Bacmeister, J., Liu, E., Bosilovich, M., Schubert., S. D., Takacs, L., Kim, G.-K., Bloom, S., Chen, J., Collins, D., Conaty, A., DaSilva, A., gu, W., Joiner, J., Koster, R. D., Lucchesi, R., Molod, A., Owens, T., Pawson, S., Pegion, P., Redder, C., Riechle, R., Robertson, F. R., Ruddick, A., Sienkiewicz, M., and Woollen, 20
J.: MERRA: NASA’s Modern-Era Retrospective Analysis for Research and Applications, J. Climate, 24, 3624–3648, 2011.
Reynolds, R. W., Rayner, N. A., Smith, T. M., Stokes, D. C., and Wang, W.: An improved in situ and satellite SST analysis for climate, J. Climate, 15, 1609–1625, 2002.
Schmidt, G., Ruedy, R., Hansen, J., Aleinov, I., Bell., N., Bauer, M., Bauer, S., Cairns, B., 25
Canuto, V., Cheng, Y., del Genio, A., Faluvegi, G., Friend, A. D., Hall, T. M., Hu, Y., Kelley, M., Kiang, N. Y., Koch, D., Lacis, A., Lerner, J., Lo, K., Miller, R. L., Nasarenko, L., Oinas, V., Perlwitz, J., Perlwitz, J., Rind, D., Romanou, A., Russel, G.L., Sato, M., Shindell, D. T., Stone, P. H., Sun, S., Tausnev, N., Thresher, D., and Yao, M.-S.: Present day atmospheric simula-tions using GISS ModelE: comparison to in-situ, satellite and reanalysis data, J. Climate, 19, 30
GMDD
7, 7575–7617, 2014GEOS5 AGCM MERRA to MERRA2
A. Molod et al.
Title Page
Abstract Introduction
Conclusions References
Tables Figures
◭ ◮
◭ ◮
Back Close
Full Screen / Esc
Printer-friendly Version Interactive Discussion
Discussion
P
a
per
|
Discussion
P
a
per
|
Discussion
P
a
per
|
Discussion
P
a
per
|
Shie, C.-L., Chiu, L. S., Adler, R., Nelkin, E., Lin, I.-I., Xie, P., Wang, F.-C., Chokngamwong, R., Olson, W., and Chu, D. A.: A Note on reviving the Goddard satellite-based surface turbulent fluxes (GSSTF) dataset, Adv. Atmos. Sci., 26, 1071–1080, 2009.
Stieglitz, M., Ducharne, A., Koster, R. D., and Suarez, M. J.: The impact of detailed snow physics on the simulation of snowcover and subsurface thermodynamics at continental 5
scales, J. Hydrometeorol., 2, 228–242, 2001.
GMDD
7, 7575–7617, 2014GEOS5 AGCM MERRA to MERRA2
A. Molod et al.
Title Page
Abstract Introduction
Conclusions References
Tables Figures
◭ ◮
◭ ◮
Back Close
Full Screen / Esc
Printer-friendly Version Interactive Discussion
Discussion
P
a
per
|
Discussion
P
a
per
|
Discussion
P
a
per
|
Discussion
P
a
per
|
Table 1.Changes in GCM Algorithms from MERRA to Fortuna.
Module Algorithm Change Comments
Moist Increased re-evaporation of precipitation Fundamental change in model climate Modified autoconversion Fundamental change in model climate Modified effective radius of cloud drops Fundamental change cloud forcing Anvil fractions cut in half Fundamental change cloud forcing Autoconvert “warm fog” Important change in coupled simulations New critical RH with resolution dependance Substantial change in simulated moisture Cloud base set at PBL depth Remove clouds detraining below PBL height RAS time scale no longer depends on turbulence
Stochastic RAS with resolution dependance Substantial impact at high resolution Turb Remove restrictions on diffusion from Louis Increase near surface diffusion
Reformulate turbulent length scale in Louis
Reduce Lock scheme when there is wind shear Impact on marine PBL Reduce cloud top entrainment for Lock plumes Impact on marine PBL Surf Implement Helfand and Schubert scheme
Remove viscous sublayer over land surfaces Improve land temperatures Change ocean roughness for middle wind regimes Reduce wind bias in S. Ocean Change ocean roughness high wind regimes Increase tropical cyclone intensity
Land Surf Changed parameters for evapotranspiration Impact on ratio of surface to canopyevaporation GW Drag Changed profile of background drag Substantial impact on QBO
GMDD
7, 7575–7617, 2014GEOS5 AGCM MERRA to MERRA2
A. Molod et al.
Title Page
Abstract Introduction
Conclusions References
Tables Figures
◭ ◮
◭ ◮
Back Close
Full Screen / Esc
Printer-friendly Version Interactive Discussion
Discussion
P
a
per
|
Discussion
P
a
per
|
Discussion
P
a
per
|
Discussion
P
a
per
|
Table 2.Experiments to attribute MERRA to Fortuna AGCM simulation changes to changes in parameterizations.
Experiment Description
Control
Exp 1 Back offchange in ocean roughness
Exp 2 Exp 1+Back offgravity wave background drag and surface hydrology Exp 3 Exp 2+use old surface layer parameterization
Exp 4 Exp 3+Back offincrease of Richardson-number diffusion
Exp 5 Exp 4+Back offdecrease of critical RH aloft and decrease below Exp 6 Exp 5+Back offincrease of all re-evaporation
GMDD
7, 7575–7617, 2014GEOS5 AGCM MERRA to MERRA2
A. Molod et al.
Title Page
Abstract Introduction
Conclusions References
Tables Figures
◭ ◮
◭ ◮
Back Close
Full Screen / Esc
Printer-friendly Version Interactive Discussion
Discussion
P
a
per
|
Discussion
P
a
per
|
Discussion
P
a
per
|
Discussion
P
a
per
|
Figure 1. Scatter diagram of surface wind speed (m s−1) vs. ocean roughness (m) in the
GMDD
7, 7575–7617, 2014GEOS5 AGCM MERRA to MERRA2
A. Molod et al.
Title Page
Abstract Introduction
Conclusions References
Tables Figures
◭ ◮
◭ ◮
Back Close
Full Screen / Esc
Printer-friendly Version Interactive Discussion
Discussion
P
a
per
|
Discussion
P
a
per
|
Discussion
P
a
per
|
Discussion
P
a
per
|
Figure 2.30 year average December-January-February surface wind speed (m s−1) from:(a)
GMDD
7, 7575–7617, 2014GEOS5 AGCM MERRA to MERRA2
A. Molod et al.
Title Page
Abstract Introduction
Conclusions References
Tables Figures
◭ ◮
◭ ◮
Back Close
Full Screen / Esc
Printer-friendly Version Interactive Discussion
Discussion
P
a
per
|
Discussion
P
a
per
|
Discussion
P
a
per
|
Discussion
P
a
per
|
Figure 4.Spatial average of zonal wind in m s−1 from 10◦S to 10◦N latitude as a function of
GMDD
7, 7575–7617, 2014GEOS5 AGCM MERRA to MERRA2
A. Molod et al.
Title Page
Abstract Introduction
Conclusions References
Tables Figures
◭ ◮
◭ ◮
Back Close
Full Screen / Esc
Printer-friendly Version Interactive Discussion
Discussion
P
a
per
|
Discussion
P
a
per
|
Discussion
P
a
per
|
Discussion
P
a
per
|
Figure 5. Surface bulk Richardson number as a function of sensible heat flux in W m−2 in
GMDD
7, 7575–7617, 2014GEOS5 AGCM MERRA to MERRA2
A. Molod et al.
Title Page
Abstract Introduction
Conclusions References
Tables Figures
◭ ◮
◭ ◮
Back Close
Full Screen / Esc
Printer-friendly Version Interactive Discussion
Discussion
P
a
per
|
Discussion
P
a
per
|
Discussion
P
a
per
|
Discussion
P
a
per
|
Figure 6.June-July-August averaged sensible heat flux in W m−2from(a)experiment 3 (Louis
GMDD
7, 7575–7617, 2014GEOS5 AGCM MERRA to MERRA2
A. Molod et al.
Title Page
Abstract Introduction
Conclusions References
Tables Figures
◭ ◮
◭ ◮
Back Close
Full Screen / Esc
Printer-friendly Version Interactive Discussion
Discussion
P
a
per
|
Discussion
P
a
per
|
Discussion
P
a
per
|
Discussion
P
a
per
|
Figure 11. (a)December-January-February total precipitable water in mm from experiment 6 (MERRA AGCM-like),(b)same as(a)but from experiment 5,(c)same as(a)but the difference, experiment 6 minus experiment 5,(d)December-January-February specific humidity in g kg−1
GMDD
7, 7575–7617, 2014GEOS5 AGCM MERRA to MERRA2
A. Molod et al.
Title Page
Abstract Introduction
Conclusions References
Tables Figures
◭ ◮
◭ ◮
Back Close
Full Screen / Esc
Printer-friendly Version Interactive Discussion
Discussion
P
a
per
|
Discussion
P
a
per
|
Discussion
P
a
per
|
Discussion
P
a
per
|
Figure 12.December-January-February total precipitation in mm day−1from(a)experiment 6
GMDD
7, 7575–7617, 2014GEOS5 AGCM MERRA to MERRA2
A. Molod et al.
Title Page
Abstract Introduction
Conclusions References
Tables Figures
◭ ◮
◭ ◮
Back Close
Full Screen / Esc
Printer-friendly Version Interactive Discussion
Discussion
P
a
per
|
Discussion
P
a
per
|
Discussion
P
a
per
|
Discussion
P
a
per
|
Figure 14. (a) June-July-August total precipitable water in mm from experiment 6 (MERRA AGCM-like),(b)same as(a)but from experiment 5,(c)same as(a)but the difference, experi-ment 6 minus experiexperi-ment 5,(d)June-July-August specific humidity in g kg−1from experiment 6
GMDD
7, 7575–7617, 2014GEOS5 AGCM MERRA to MERRA2
A. Molod et al.
Title Page
Abstract Introduction
Conclusions References
Tables Figures
◭ ◮
◭ ◮
Back Close
Full Screen / Esc
Printer-friendly Version Interactive Discussion
Discussion
P
a
per
|
Discussion
P
a
per
|
Discussion
P
a
per
|
Discussion
P
a
per
|
Figure 15.30 year averaged annual cycle of zonal mean zonal wind, averaged from 70◦S to
50◦S latitude in m s−2 from experiment 7 in red (MERRA AGCM-like), experiment 6 in blue
GMDD
7, 7575–7617, 2014GEOS5 AGCM MERRA to MERRA2
A. Molod et al.
Title Page
Abstract Introduction
Conclusions References
Tables Figures
◭ ◮
◭ ◮
Back Close
Full Screen / Esc
Printer-friendly Version Interactive Discussion
Discussion
P
a
per
|
Discussion
P
a
per
|
Discussion
P
a
per
|
Discussion
P
a
per
|
Figure 16. December-January-February seasonal mean specific humidity in g kg−1 from
MERRA-like AGCM for(a) 2◦ resolution, (b) EC Interim,(c) the difference, 2◦ – EC Interim,
(d)1◦ resolution,(e)EC Interim,(f)the difference, 1◦– EC Interim,(g)1/2◦ resolution,(h)EC
GMDD
7, 7575–7617, 2014GEOS5 AGCM MERRA to MERRA2
A. Molod et al.
Title Page
Abstract Introduction
Conclusions References
Tables Figures
◭ ◮
◭ ◮
Back Close
Full Screen / Esc
Printer-friendly Version Interactive Discussion
Discussion
P
a
per
|
Discussion
P
a
per
|
Discussion
P
a
per
|
Discussion
P
a
per
|
Figure 17. December-January-February seasonal mean specific humidity in g kg−1 from
MERRA2-like AGCM for(a) 2◦ resolution, (b)EC Interim,(c) the difference, 2◦ – EC Interim,
(d)1◦ resolution,(e)EC Interim,(f)the difference, 1◦– EC Interim,(g)1/2◦ resolution,(h)EC
GMDD
7, 7575–7617, 2014GEOS5 AGCM MERRA to MERRA2
A. Molod et al.
Title Page
Abstract Introduction
Conclusions References
Tables Figures
◭ ◮
◭ ◮
Back Close
Full Screen / Esc
Printer-friendly Version Interactive Discussion
Discussion
P
a
per
|
Discussion
P
a
per
|
Discussion
P
a
per
|
Discussion
P
a
per
|
Figure 18.The probability distribution function for the mimimum entrainment allowed by the cumulus parameterization for different AGCM horizontal resolutions. Black line is for 2◦, blue for
GMDD
7, 7575–7617, 2014GEOS5 AGCM MERRA to MERRA2
A. Molod et al.
Title Page
Abstract Introduction
Conclusions References
Tables Figures
◭ ◮
◭ ◮
Back Close
Full Screen / Esc
Printer-friendly Version Interactive Discussion
Discussion
P
a
per
|
Discussion
P
a
per
|
Discussion
P
a
per
|
Discussion
P
a
per
|
Figure 19.June-July-August seasonal mean cumulus mass flux in kg m−2s−1from
GMDD
7, 7575–7617, 2014GEOS5 AGCM MERRA to MERRA2
A. Molod et al.
Title Page
Abstract Introduction
Conclusions References
Tables Figures
◭ ◮
◭ ◮
Back Close
Full Screen / Esc
Printer-friendly Version Interactive Discussion
Discussion
P
a
per
|
Discussion
P
a
per
|
Discussion
P
a
per
|
Discussion
P
a
per
|
Figure 20. June-July-August seasonal mean change in moisture due to moist processes in g kg−1day−1from MERRA2-like AGCM for (a)1◦resolution,(b)1/2◦resolution,(c)1/2◦