Article
Printed in Brazil - ©2017 Sociedade Brasileira de Química0103 - 5053 $6.00+0.00*e-mail: pizzutti@quimica.ufsm.br
Comparison Between Three Chromatographic (GC-ECD, GC-PFPD and
GC-ITD-MS) Methods and a UV-Vis Spectrophotometric Method for the
Determination of Dithiocarbamates in Lettuce
Ionara R. Pizzutti,*,a André de Kok,b Rosselei C. da Silvaa,c and Graciele N. Rohersa
aCentro de Pesquisa e Análise de Resíduos e Contaminantes (CEPARC), Departamento de Química,
Universidade Federal de Santa Maria, 97105-900 Santa Maria-RS, Brazil
bNVWA-Netherlands Food and Consumer Product Safety Authority, Chemistry Laboratory,
R&D Group, National Reference Laboratory (NRL) for Pesticide Residues in Food and Feed, Wageningen, The Netherlands
cUniversidade Regional Integrada do Alto Uruguai e das Missões,
98400-000 Frederico Westphalen-RS, Brazil
The purpose of this study was to compare the performance of gas chromatographic with electron capture detector, pulsed flame photometric detector and mass spectrometry (GC-ECD, GC-PFPD and GC-MS) and UV-Vis spectrophotometric methods, based on acidic hydrolysis with tin(II) chloride of dithiocarbamate and analysis of the evolved CS2. For the validation studies were
assessed linearity, limit of detection (LOD), limit of quantification (LOQ), accuracy and precision. Recovery experiments were performed at 0.05 and 0.4 (chromatographic method) and 0.4, 0.8 and 2.0 mg CS2 kg
-1 (UV-Vis spectrophotometric method). The analytical curves were linear from
0.08 to 2.0 µg CS2 mL-1 (chromatographic method) and from 0.4 to 2.2 µg mL-1 and from 2.2 to
8.9 µg CS2 mL-1 (both with r2 > 0.995) (UV-Vis spectrophotometric method). Method LODs were
0.01 and 0.28 mg CS2 kg-1 and LOQs were 0.02 and 0.4 mg CS2 kg-1 for the chromatographic and
spectrophotometric methods, respectively. Acceptable accuracy was obtained for both methods (RSDs < 15.9% and recoveries from 87.7-107.4%). There was no significant difference between the techniques and detectors employees.
Keywords: dithiocarbamate, fungicide, lettuce, gas chromatography, UV-Vis spectrophotometry
Introduction
Dithiocarbamates (DTCs) are important fungicides and the most widely used group of pesticides in agriculture, due to their high efficiency for the control of fungal and bacterial pathogens, low production costs and relatively
low mammalian acute toxicity.1-3 Furthermore, these
compounds are also used as vulcanization accelerators and
antioxidants in the rubber industry.2
Generally, DTCs are not considered to be highly toxic, but short-term exposure can cause eye, respiratory and skin irritation.4 The toxicological significance of such fungicides
in food is related to the metabolite or its degradation product ethylenethiourea (ETU), which is known to be
carcinogenic, mutagenic and teratogenic.5
A variety of methods have been developed to analyze DTC residues in different crops. Many of these methods are based on acid hydrolysis of DTC in the presence of tin(II) chloride and subsequent analysis of the evolved carbon
disulfide (CS2) by different techniques such as UV-Vis
spectrophotometry,6,7 gas chromatography (GC),8-12 or
headspace GC.13 Detection techniques for some individual
DTCs, using capillary electrophoresis (CE)14 or liquid
chromatography (LC) are also available.9,15 Other less
common techniques, such as voltammetry,8 flow injection
analysis (FIA)16,17 and immunoassay,18 have also been
used for the determination of this class of pesticides, but have also never found widespread applications in routine laboratories.
Lettuce is considered the main leafy vegetable crop
in Brazil.19 The maximum residue level (MRL) for DTCs
withdrawn from the National Sanitary Surveillance Agency
(ANVISA) list in 2005.20 Nowadays, the Brazilian MRL
for DTC’s in lettuce is 3 mg CS2 kg-1, only from permitted
use of methiram.21
DTCs are still one of the most frequently detected pesticides in the European Union and this pesticide class also showed the highest frequency of exceedances of maximum residue limits (MRLs) in the monitoring program
of pesticide residues in food products.1 In Brazil, Jardim
and Caldas20 analyzed a total of 13,556 samples of fruits
and vegetables between 2001 and 2010. Dithiocarbamates were the pesticides that most frequently exceeded the Brazilian MRL during that period. According to the report of Brazilian National Monitoring Program on Pesticide
Residues (PARA), ANVISA (2012)22 45% of lettuce
samples showed unsatisfactory results for DTC.
The DTCs represent one of the most complex pesticides group to be determined due to their low stability in vegetable matrices and low solubility in water or polar organic solvents. The most widely used method to analyze DTC residues in fruits and vegetables is the analysis of CS2.
Although it is time consuming, UV-Vis spectrophotometric analysis is still relatively frequently used worldwide to determine residues of DTCs. For instance, gas chromatographic with electron capture detector (GC-ECD) is still the analytical technique employed by the EU Reference Laboratory for Residues of Pesticides-Single Residue Methods (EURL-SRM) for dithiocarbamate determination.23 Therefore, the purpose of this study was to
compare critically and statically the performance of the gas chromatographic methods using three different detection systems (electron capture detection (ECD), pulsed flame photometric detection (PFPD) and mass spectrometry (MS)) with a UV-Vis spectrophotometric method for the determination of DTCs in lettuce.
Experimental
Chemicals and reagents
Iso-octane, pesticide grade (Lab-scan Analytical Sciences, Dublin, Ireland), toluene, pesticide grade (Mallinckrodt, St. Louis, USA), solution of tin(II) chloride
1.5% in 4 mol L-1 hydrochloric acid (Boom, Meppel, The
Netherlands), hydrochloric acid (Nuclear, São Paulo, Brazil), tin(II) chloride (Nuclear, São Paulo, Brazil), copper acetate (Vetec, Rio de Janeiro, Brazil), diethanolamine (Nuclear, São Paulo, Brazil), ethanol (Vetec, Rio de Janeiro, Brazil), sodium hydroxide (Merck, Darmstadt, Germany) and lead acetate (Vetec, Rio de Janeiro, Brazil) were used. Pesticide reference material of thiram (99% purity)
and carbon disulfide (99.9%) were purchased from Dr. Ehrenstorfer (Augsburg, Germany).
Reference materials and solutions
For the spectrophotometric method the following
solutions were prepared: tin(II) chloride 1.5% (m/v) in
hydrochloric acid (4 mol L-1), lead acetate aqueous solution
30% (m/v), sodium hydroxide solution (2.5 mol L-1) and
a solution of complexing reagent (25 g of diethanolamine and 12 mg of copper acetate in 250 mL of ethanol).
A carbon disulfide stock solution (1000 µg mL-1)
was prepared in iso-octane (chromatographic method) or ethanol and complexing reagent (spectrophotometric method) and stored at –18 °C.
The stock solution of thiram (1000 µg mL-1, solution A)
was prepared in toluene and it was diluted with iso-octane
to produce the working analytical solution 100 µg mL-1
(solution B), which was used as a spike solution for the recovery experiments in both methods. These solutions
were stored at –18 °C and were stable for one year.24
Apparatus and experimental conditions
Chromatographic method
Chromatographic analyses were carried out on a gas chromatograph model 3800 (Varian, Walnut Creek, USA) equipped with a pulsed flame photometric detector (PFPD), operated in the sulfur mode and an electron capture detector (ECD). GC-MS experiments were performed on a gas chromatograph model 3800 (Varian) coupled to a Varian Saturn 2000 ion trap detector (ITD). Both GCs were equipped with an autosampler model 8400 (Varian), a 1079 injector and a capillary column, CP-Sil 8 CB
(50 m × 0.32 mm i.d. × 1.2 µm film thickness) obtained
from Varian (Middelburg, The Netherlands). The injector temperature was 250 °C; the column oven was programmed
from 45 (hold for 1 min) to 250 oC (hold for 0 min) at
10 oC min-1. The carrier gas was helium (99.999% purity,
from Air Liquide, France) with a constant flow-rate of
2 mL min-1. The injection volume was 4 µL, with a split
ratio of 1:10 for GC-ECD and GC-ITD-MS, and 1:15 for GC-PFPD. The detector temperatures were 300 °C and 250 °C for the ECD and for the PFPD, respectively. The GC-ITD-MS transferline and trap were set at 230 °C and the manifold at 120 °C. For GC-ITD-MS, a selected mass
range (m/z 70-80) was used for the acquisition mode.
Spectrophotometric method
a heating mantle. One neck of the flask was connected to a nitrogen (White Martins, Brazil) inlet tube, the second one was used to add the hydrolysis reagent (acidic tin(II) chloride solution) and the center flask neck was used to introduce the sample and to connect a reflux condenser, which was then connected to the three traps in series. The first two traps were used to remove any interference
and in the third trap, CS2 reacted with the complexing
reagent (Figure 1). The spectrophotometric analyses were carried out in a dual beam UV-Vis spectrophotometer (PerkinElmer, Germany) at 435 nm, after complexation of
the CS2 with diethanolamine and copper.
Sample preparation and analysis
The methods for determining DTCs are based on acidic hydrolysis to CS2 in the presence of tin(II) chloride.26 If the
origin of the CS2 is known, for example by the known use
of a certain DTC, an appropriate conversion factor can be used to give a result expressed as the corresponding DTC
from the CS2 result. In this paper, thiram was used for the
validation studies. In this case, 1 mol thiram decomposes
to give 2 mol CS2 (Figure 2). The molecular mass of thiram
is 240 g and of CS2 is 76 g (2 mol = 152 g). The conversion
factor is thus 240/152 = 1.58, and the concentration of thiram = CS2 concentration × 1.58.4
Chromatographic method
The blank lettuce (without DTC) used for the recovery studies were acquired from supermarkets in Amsterdam (The Netherlands) and from an organically grown products open market in Santa Maria (RS, Brazil). The samples were prepared as described below.
The lettuce leaves were coarsely cut in a food chopper and shortly homogenized. A mass of 50 ± 0.5 g of blank lettuce was directly weighed in a 250 mL polytetrafluoroethylene (PTFE)-coated, screw-capped glass bottle and for the recovery study, an appropriate volume of spike solution of thiram
was added to blank lettuce. Then, 25 mL of iso-octane and 150 mL of tin(II) chloride solution in hydrochloric acid were added. The bottles were closed immediately and heated for 2 h in a water bath (Thermo Haake, Karlsruhe, Germany), at a temperature of 80 °C, under continuous mechanical shaking. The bottles were cooled to room temperature in a cold-water bath. After cooling, 1 mL aliquot of the upper organic layer of each bottle was transferred to autosampler vials (by means of a Pasteur pipette) and analyzed by GC-ECD, GC-PFPD and GC-ITD-MS.
UV-Vis spectrophotometric method
A mass of 50 ± 0.5 g of homogenized blank lettuce was
transferred to the three-neck round-bottom flask, connected to the condenser cooled with water and to traditional in-series-three-trap reaction system. In the first two traps, were added 10 mL of lead acetate solution and 10 mL of sodium hydroxide solution, respectively, to remove possible volatile interferences, mainly H2S and SO2. In the third trap
was added 15 mL of complexing reagent.
For the recovery study, an appropriate volume of stock solution of thiram was added to the sample. Then, 220 mL
of hot tin(II) chloride acid solution was added and the N2
flow and the heating mantle were turned on. After boiling for 1 h, the system was turned off and the solution in the third trap was transferred to a 25 mL volumetric flask, the volume was completed with ethanol, and the absorbance was measured at 435 nm.
Preparation of analytical solutions
Chromatographic method
Known volumes of CS2 solution (40 µg mL-1 in iso-octane)
were transferred to clean glass vials to prepare a series of analytical solutions ranging from 0.08 to 2.0 µg CS2 mL-1,
in iso-octane, corresponding to 0.04 to 1.0 mg CS2 kg-1 in
the sample. These solutions were injected into three different GC systems to obtain the analytical curves.
Figure 1. Reaction between CS2 and complexing reagent (diethanolamine and copper).25 R = ethanol.
Spectrophotometric method
Known volumes of CS2 solution (50 µg mL-1) were
transferred to 25 mL volumetric flasks, together with 15 mL of complexing solution and the final volume was added up with ethanol. The solutions were allowed to stand for 15 min and the absorbance was measured with the spectrophotometer UV-Vis. Two analytical curves were constructed, in the range from 0.4 to 2.2 and from 2.2 to
8.9 µg CS2 mL-1, corresponding to 0.2 to 1.0 and 1.0 to
4.4 mg CS2 kg-1 in the sample, respectively.
Method validation procedure
The following parameters were evaluated: linearity of analytical curves, limits of detection (LOD) and quantification (LOQ), precision (repeatability and intermediate precision) and trueness, determined as recovery percentage.
Chromatographic methods
The linearity of the analytical curve was evaluated by injecting six times each analytical solution at five
concentrations in the range of 0.08 to 2.0 µg CS2 mL-1,
in each one of those three chromatographic systems. The
estimated instrument LODi from the analytical curve
experiments was determined as the lowest detectable concentration giving a response with a relative standard deviation (RSD) of < 33%. The repeatability and intermediate precision of the instrument’s detector response were determined by the replicate analysis (n = 6)
of analytical solutions (0.1, 0.2 and 2.0 µg CS2 mL-1) on
one day and on three different days, respectively. The repeatability of the method was determined as the relative standard deviation (RSD%) of the recovery studies. Recovery experiments were carried out with blank lettuce, spiked with thiram at two concentrations (corresponding to 0.05 and 0.4 mg CS2 kg-1), with six replicates for each
concentration (n = 6). The method LOQm was defined as
the lowest validated level with a recovery between 70 and 120% and RSD < 20%.
Spectrophotometric method
The linearity was evaluated by analyzing analytical solutions at seven concentrations in the range of 0.4 to
8.9 µg CS2 mL-1. The LOD and LOQ were determined by
blank lettuce analysis (n = 6) and calculating three or ten times the SD of the absorbance measured, respectively. The repeatability and intermediate precision of the instruments were determined by the replicate analysis (n = 6) of analytical solutions (0.6, 1 and 4 µg CS2 mL-1) on one day
and on two different days, respectively. The repeatability
of the method (RSD%) was determined by the analysis of the recovery samples. Recovery experiments were carried out on blank lettuce, spiked with thiram at concentrations
corresponding to 0.4, 0.8 and 2 mg CS2 kg-1, with six
replicates for each level (n = 6).
Statistical analysis
The results obtained from UV-Vis spectrophotometric and chromatographic methods were statistically evaluated
by paired t-test variance, with 95% confidence interval,
using software Minitab Release® 14. For all 3 detector
system response was applied paired t-test for recoveries
obtained from spike concentration 0.05 mg CS2 kg-1. For
results obtained from spike concentration 0.4 mg CS2 kg-1,
the comparison was between both analytical techniques.
Results and Discussion
The UV-Vis spectrophotometric and chromatographic
methodshave been fully optimized for various crops in
previous studies.2 In this study, the methods were validated
for lettuce and critically and statically compared as to sensitivity and selectivity.
Method validation and performance
Table 1 shows the results of the linearity studies, the
estimated LODi and LOQi based on repeated analysis
of CS2 analytical solutions which were analyzed by
chromatographic and spectrophotometric methods. All methods showed a very satisfactory linearity, with r2 > 0.99.27,28 All three chromatographic methods showed
the same detectability, and thus the same LODs and LOQs (Table 1), and all three were more sensitive than the UV-Vis spectrophotometric method.
The chromatographic detection systems proved to have no significant matrix effect, that is the difference in detector response between the analytical solutions in organic solvent and those prepared in blank matrix extract did not differ by more than 20%. This is true, provided that a clean injector liner with new carbofrit is first deactivated by some sample extract injections.
The relative selectivity of the three chromatographic detectors can be observed from the chromatograms (Figure 1) obtained with blank matrix extracts and the same extract redissolved in calibration solutions (“standard in matrix extracts” or “matrix-matched calibration”).
chromatographic resolution of both methods was always sufficient due to the optimized capillary GC conditions.
The flame pulsation in the PFPD improved selectivity and sensitivity and this is an advantage, even compared with GC-ITD-MS, because that detection system does not have such a good sensitivity for low masses, like for
CS2 (m/z 76). However, with GC-ITD-MS it was possible
to confirm unequivocally the identity of the CS2 with the
isotope mass of 78. When the GC-ECD was used, many interferences and negative peaks were observed (Figure 3).
The MS (ITD) detector was less selective (more generic) than the PFPD, but due to the mass spectrometric information, it is the most specific detector, due to the measurement of mass 76 and the confirmation mass of 78 at the typical isotopic ratio of 10:1. This confirmation
is only possible from the 0.2 µg mL-1 concentration on,
which corresponds with a method sample concentration of 0.1 mg kg-1.
After determining the estimated method LODm and
LOQm (via dividing the instrument LOD and LOQ by
a concentration factor of 2), the recovery study was performed at 3 spike concentrations with the lowest spike level being equal to the expected achievable (target)
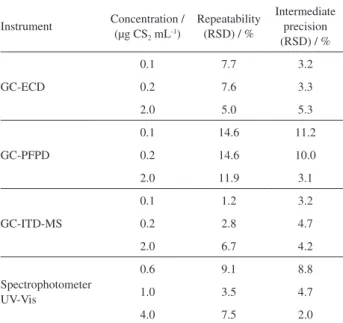
LOQm. The repeatability and intermediate precision of the
detector’s response were tested and appeared to be very satisfactory, as shown in Table 2.
The average recoveries and relative standard deviations (RSDs) obtained with chromatographic and spectrophotometric methods are shown in Table 3. For the chromatographic methods, the blank lettuce was fortified with thiram solution with corresponding concentrations of 0.05 and 0.4 mg CS2 kg-1. The recoveries are in the range of
88.9 to 107.4%, with RSD ranging from 2.8 to 15.9%, and are more than satisfactory to meet the method validation performance criteria is as to accuracy and precision of the analytical methods. The results in Table 3 demonstrate that only the repeatability of the GC-ECD was somewhat lower than the other methods, resulting in RSDs values exceeding 10%, but still below the required 20%. For the
Table 1. Linearity, LOD and LOQ data of CS2 analytical solutions analyzed by chromatographic and spectrophotometric methods
Method Linear range /
(µg CS2 mL-1) Slope Intercept r² LOD / (mg kg-1) LOQ / (mg kg-1)
GC-ECD
0.08-2.0
19.908 1.194 0.9954 0.02 0.05
GC-PFPD 20.207 0.228 1.0000 0.02 0.05
GC-ITD-MS 9009.4 65.865 0.9999 0.02 0.05
Spectrophotometric 0.4-2.2 0.0511 –0.0191 0.9955 0.28 0.40
2.2-8.9 0.0716 0.0699 0.9995
GC-ECD: gas chromatographic electron capture detector; GC-PFPD: gas chromatographic pulsed flame photometric detector; GC-ITD-MS: gas chromatographic ion trap detector mass spectrometry; LOD: limit of detection; LOQ: limit of quantification.
Figure 3. Chromatograms of blank lettuce extract (A) and lettuce extract spiked at 0.05 mg CS2 kg-1 (B), obtained by (a) GC-ECD; (b) GC-PFPD;
(c) GC-ITD-MS.
spectrophotometric method, the recoveries were in the range of 87.7 to 94.2%, with a RSD ranging from 6.0 to 9.7%, and thus also met the requirements easily.
Comparing the results from Table 3 for spike
concentration of 0.4 mg CS2 kg-1, no significant differences
methods (excepted to GC-ECD). The results demonstrated that the spectrophotometric method, although less sensitive, maintains the ability to analyze DTCs with good precision
and accuracy. To achieve a lower LODm and LOQm applying
the UV-Vis spectrophotometric method, instead of 50 g sample, a higher sample amount could be taken.
Statistical analysis
The results of p-value from Paired t-test for
chromatographic method was 0.005522, showing that difference among those 3 GC detectors is not statistically
significant. The p-value of 0.02612 obtained from spike
concentration of 0.4 mg CS2 kg-1, demonstrated not
statistically significant differences between techniques. However, GC-ECD results showed some difference when compared with those others (GC-PFPD, GC-ITD-MS and UV-Vis spectrophotometry).
Conclusions
The results obtained from validation studies allow us to conclude that all the evaluated methods are appropriate to determine residues of DTC in lettuce. However, the chromatographic methods were simpler, faster and more sensitive, giving them an advantage over UV-Vis spectrophotometry. Additionally, the sample preparation for the chromatographic methods can be carried out simultaneously for many samples, in a simplified way and does not use toxic chemicals, like lead acetate (UV-Vis spectrophotometry). Among the chromatographic detectors, there were no significant differences responses,
at concentration 0.05 mg CS2 kg-1. The GC-PFPD and
GC-ITD-MS were more selective and more specific than the GC-ECD method and should be strongly recommended for routine applications in monitoring studies and for MRL enforcement purposes. However, there were no significant
difference between both techniques at 0.4 mg CS2 kg-1
concentration.
Acknowledgments
The authors would like to thank the UFSM, CNPq, FAPERGS/CAPES 0219/2015 and Netherlands Food and Consumer Product Safety Authority (Wageningen, The Netherlands) for the opportunity to develop this study.
References
1. López-Fernández, O.; Rial-Otero, R.; González-Barreiro, C.; Simal-Gándara, J.; Food Chem.2012, 134, 366.
2. Crnogorac, G.; Schwack, W.; TrAC, Trends Anal. Chem. 2009, 28, 40.
3. Gonzalvez, A.; Garrigues, S.; Armenta, S.; Guardia, M.; Anal. Chim. Acta 2011, 688, 191.
4. Coldwell, M. R.; Pengelly, I.; Rimmer, D. A.; J. Chromatogr. A
2003, 984, 81.
Table 2. Repeatability and intermediate precision of the instruments at three spiking concentrations
Instrument Concentration / (µg CS2 mL-1)
Repeatability (RSD) / %
Intermediate precision (RSD) / %
GC-ECD
0.1 7.7 3.2
0.2 7.6 3.3
2.0 5.0 5.3
GC-PFPD
0.1 14.6 11.2
0.2 14.6 10.0
2.0 11.9 3.1
GC-ITD-MS
0.1 1.2 3.2
0.2 2.8 4.7
2.0 6.7 4.2
Spectrophotometer UV-Vis
0.6 9.1 8.8
1.0 3.5 4.7
4.0 7.5 2.0
GC-ECD: gas chromatographic electron capture detector; GC-PFPD: gas chromatographic pulsed flame photometric detector; GC-ITD-MS: gas chromatographic ion trap detector mass spectrometry; RSD: relative standard deviation.
Table 3. Recoveries and relative standard deviations (%), for different spike concentrations, obtained by GC-ECD, GC-PFPD, GC-ITD-MS and UV-Vis spectrophotometric methods
Method Spike level /
(mg CS2 kg-1)
Recovery average (n = 6) / %
RSD / %
GC-ECD
0.05 88.9 15.9
0.4 107.4 2.8
GC-PFPD
0.05 93.9 9.6
0.4 92.8 5.0
GC-ITD-MS 0.05 94.0 9.7
0.4 97.4 8.1
Spectrophotometric UV-Vis
0.4 87.7 9.7
0.8 94.2 6.9
2.0 94.0 6.0
5. Ripollés, C.; Sancho, J. V.; López, F. J.; Hernández, F.; J. Chromatogr. A 2012, 1243, 53.
6. Kesari, R.; Gupta, V. K.; Talanta1998, 45, 1097.
7. Caldas, E. D.; Miranda, M. C. C.; Conceição, M. H.; Souza, L. C. K. R.; Food Chem. Toxicol. 2004, 42, 1877.
8. Mathew, L.; Reddy, M. L. P.; Rao, T. P.; Iyer, C. P.; Damodaran, A. D.; Talanta1996, 43, 73.
9. Blasco, C.; Font, G.; Picó, Y.; J. Chromatogr. A 2004, 1028, 267.
10. Vryzas, Z.; Papadakis, E. N.; Papadopoulou-Mourkidou, E.; J. Agric. Food Chem. 2002, 50, 2220.
11. Caldas, E. D.; Conceição, M. H.; Miranda, M. C. C.; Souza, L. C. K. R.; Lima, J. F.; J. Agric. Food Chem. 2001, 49, 4521. 12. Abakerli, R. B.; Sparrapan, R.; Sawaya, A. C. H. F.; Eberlin,
M. N.; Jara, J. L. P.; Rodrigues, N. R.; Fay, E. F.; Luiz, A. J. B.; Galvao, T. D. L.; Martins, D. S.; Yamanishi, O. K.; Toledo, H. H. B.; Food Chem.2015, 188,71.
13. Royer, A.; Ménand, M.; Grimault, A.; Communal, P. Y.; J. Agric. Food Chem. 2001, 49, 2152.
14. Lee, A. W. M.; Chan, W. F.; Yuen, F. S. Y.; Lo, C. H.; Chan, R. C. K.; Liang, Y.; Anal. Chim. Acta1997, 339, 123. 15. Garcinuño, R. M.; Fernández-Hernando, P.; Cámara, C.;
J. Chromatogr. A 2004, 1043, 225.
16. Nascimento, D. B.; Nascimento, P. C.; Gomes, H. M.; J. Agric. Food Chem. 1999, 47, 212.
17. Kubo, H.; Tsuda, Y.; Yoshimura, Y; Homma, H.; Nakazawa, H.; Anal. Chim. Acta2003, 494,49.
18. Queffelec, A. L.; Boisdé, F.; Larue, J. P.; Haelters, J. P.; Corbel, B.; Thouvenot, D.; Nodet, P.; J. Agric. Food Chem. 2001, 49, 1675.
19. Sala, F. C.; Costa, C. P.; Hortic. Bras.2012, 30, 187. 20. Jardim, A. N. O.; Caldas, E. D.; Food Control2012, 25, 607.
21. Agência Nacional de Vigilância Sanitária (ANVISA); Resolução No. 3.754, de 22 de Setembro de 2014, Adequação da Relação de Monografias dos Ingredientes Ativos de Agrotóxicos,
Domissanitários e Preservantes de Madeira, Publicação Diário Oficial da União, de 23 de Setembro de 2014, p. 32.
22. Brazilian Program for Pesticide Residue Analysis in Food, 2014. http://portal.anvisa.gov.br/documents/111215/117818/ Relat%25C3%25B3rio%252BPARA%252B2011-12%252B- %252B30_10_13_1.pdf/d5e91ef0-4235-4872-b180-99610507d8d5, accessed in July 2016.
23. European Union, Reference Laboratory for Residues of Pesticides/Single Residue Methods (EURL-SRM); 2009. http://www.crl-pesticides.eu/library/docs/srm/meth_ DithiocarbamatesCs2_EurlSrm.PDF, accessed in July 2016. 24. European Commission, Directorate-General for Health and
Food Safety; Guidance Document on Analytical Quality Control and Method Validation Procedures for Pesticides Residues
Analysis in Food and Feed; SANTE,2015.
25. Abakerli, R. B.; Sparrapan, R.; Sawaya, A. C. H. F.; Eberlin, M. N.; Jara, J. L. P.; Rodrigues, N. R.; Fay, E. F.; Luiz, A. J. B.; Galvão, T. D. L.; Martins, D. S.; Yamanishi, O. K.; Toledo, H. H. B.; Food Chem. 2015, 188, 71.
26. Cullen, T. E.; Anal. Chem. 1964, 36, 221.
27. Agência Nacional de Vigilância Sanitária (ANVISA); Resolução No. 899, Guia para Validação de MétodosAnalíticos e Bioanalíticos, de 29 de Maio de 2003.
28. Ribani, M.; Bottoli, C. B. G.; Collins, C. H.; Jardim, I. C. S. F.; Melo, L. F. C.; Quim. Nova2004, 27, 771.
Submitted: May 10, 2016
Published online: August 4, 2016