Article
J. Braz. Chem. Soc., Vol. 26, No. 8, 1583-1590, 2015. Printed in Brazil - ©2015 Sociedade Brasileira de Química 0103 - 5053 $6.00+0.00
A
*e-mail: [email protected]
Maleic Anhydride as a Compatibilizer and Plasticizer in TPS/PLA Blends
Samuel H. Clasen,*,a Carmen M. O. Müllerb and Alfredo T. N. Piresa
aGrupo de Estudo em Materias Poliméricos, Departamento de Química and bDepartamento de Ciência e
Tecnologia de Alimentos, Universidade Federal de Santa Catarina, 88040-900 Florianópolis-SC, Brazil
In recent decades, starch has been studied as a raw material due to low production costs. The limitations associated with starch being highly permeable to water vapor and its mechanical properties being dependent on the relative humidity have been investigated. The proprieties of thermoplastic starch/poly(lactic acid) (TPS/PLA) blends have been studied by researchers, as well as the incorporation of compatibilizers to improve the interfacial interaction between the blend components. The purpose of this study was to evaluate the effect of maleic anhydride (MA) as a compatibilizer and a plasticizer. The blends were prepared in a torque rheometer through different mixture processes. Blends prepared with grafted MA showed interfacial adhesion and small domains of PLA in the TPS matrix, due to the use of MA as a compatibilizer. The presence of free MA in the TPS/PLA blends affected the mechanical and thermal properties, suggesting a plasticizer effect.
Keywords: maleic anhydride, plasticizer, compatibilizer, TPS/PLA blend
Introduction
Polymers of petrochemical origin dominate the packaging market due to their low production costs, consolidated technology and functional characteristics. However, the environmental problems caused by petrochemical materials, mainly associated with the fact that they are not biodegradable, and the growing concern regarding the consequences of using these materials have motivated research on biodegradable polymeric materials.
Within the class of biodegradable polymers, those obtained from renewable sources are attracting most interest, especially starches, due to their low production costs. The materials produced from starch have the characteristic of being brittle and therefore they require the incorporation of plasticizers to produce flexible materials. When adding a plasticizer to starch in the presence of heat and shear stress, the disruption of the starch granules occurs and the material formed is known as thermoplastic starch (TPS).1-3 Starch plasticizers with hydroxyl groups,
such as glycerol, are predominantly used. TPS films have low permeability to gases such as O2 and CO2; however,
because they are hydrophilic, they have high water vapor permeability and their mechanical properties are dependent on the relative humidity.4,5
The strategy of producing blends of polyesters with TPS has been used to decrease the dependence on the relative humidity and increase the rigidity, obtaining a material with permeability characteristics and mechanical properties suitable for use as a laminate. One material which can be used to produce TPS blends with properties that enable their use as laminates is poly(lactic acid) (PLA). A difficulty encountered in the production of TPS and PLA blends is that PLA is a hydrophobic polymer which makes the TPS/PLA blend immiscible.6-8 To enhance the interfacial
adhesion, a compatibilizing agent, such as maleic anhydride (MA) or methylene diphenyldiisocyanate (DMI), may be added.9,10
Wootthikanokkhan et al.11 evaluated the effectiveness of
compatibilization for the blending of TPS with PLA grafted with MA and observed through Fourier transform infrared spectroscopy (FTIR) and nuclear magnetic resonance (NMR) that the graft reaction was effective and that compatibility between the blend components was achieved.
Huneault and Li7 studied the use of MA as a
compatibilizer for blends of PLA/TPS and observed that the compatibilized blends contained TPS domains of 1-5 mm, compared with 5-30 mm in the blends without compatibilizer. MA is a good compatibilizing agent and its presence in the blend affects the dependence on the relative humidity.
incorporation of materials of different natures, ease of scale up, versatility and energy efficiency. In addition, a torque rheometer can be employed for the blend production.
The purpose of this study was to evaluate the effect of MA used as a coupling agent and as a plasticizer.
Experimental
Materials
The cassava starch (Manihotesculento), with 20 to 25% of amylose and 12% of moisture, was supplied by Indemil (Diadema-SP, Brazil). Poly(lactic acid) was purchased from Cargill Agrícola S.A. (Diadema, Brazil) (lot 3251D). Glycerol (analytical grade) was supplied by Dynamics (São Paulo, Brazil). Maleic anhydride (analytical grade, 99%) was purchased from Vetec Química Fina (Duque de Caxias, Brazil) (lot 04323HJ) and dicumyl peroxide (DP) (analytical grade, 98%) was supplied by Sigma-Aldrich (lot 0905407, Saint Louis, USA). All of the chemical reagents were used without further purification.
Thermoplastic starch/PLA blends
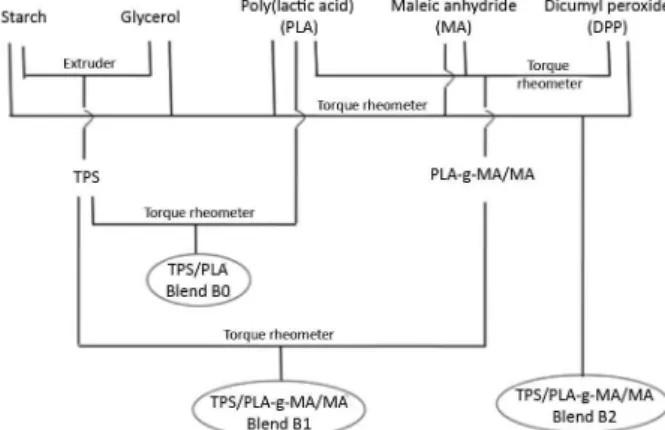
The blends were obtained using a torque rheometer, and the process was carried out in a Haake Polylab QC rheometer. To obtain the blends, three different mixing procedures were applied maintaining the TPS at 70%: (i) TPS/PLA at 70/30 (Blend B0) m/m; (ii) TPS/PLA-g-MA/MA at 70/30 m/m (Blend B1) (where the PLA was previously grafted with 2% MA and the grafted polymer was used without the removal of free maleic anhydride) and; (iii) starch/glycerol/PLA/MA/DP at 49/21/29.2/0.6/0.2 by mass (Blend B2). In the first and second procedures, the TPS was previously prepared in a single screw extruder (model EL-25, Taboão da Serra, Brazil, L/D = 30) at 150 °C and with starch/glycerol at 70/30 m/m. Figure 1 shows a representative scheme for each mixing
procedure. The temperature applied in both processes was 170 °C and the rotation speed was 30 rpm. Subsequently, the blends were pressed at 150 °C applying16 × 105 Pa for 5 min
in a Bovenal thermopress (model P15 ST, Rio do Sul, Brazil).
Characterization
Determination of free MA and PLA molar weight in TPS/ PLA blends
Blends B1 and B2 were maintained in chloroform (5/95 m/v), a solvent of PLA and maleic anhydride, under mechanical stirring, for 24 h. The insoluble TPS was filtered out and the process repeated. The components present in the chloroform solution were evaluated gravimetrically, after solvent evaporation.
The titration technique was used for the quantification of free maleic anhydride in the TPS/PLA blends. The extracted material (PLA, PLA-g-MA and free MA) (1 g) was solubilized in 5 mL of chloroform and added to 30 mL of ethanol (non-solvent of PLA and solvent of MA). The dispersed polymer was separated through centrifugation (10 min at 1900 × g) and then filtered through a cellulose acetate filter with a pore size of 0.45 mm (Chromafil-Xtra CA-45/25). Next, 5 mL of pure aniline was added to the filtrated and the mixture was titrated with a 0.05 mol L−1
solution of ethanolic sodium hydroxide. The percentage of free maleic anhydride was calculated using equation 1.
( )
(
MA NaOH titrated)
free
MW × C × V × 100
MA %
sample
w × 0.02
= (1)
where wsample is the weight of the sample, MWMA is the molar
weight of maleic anhydride, CNaOH is the concentration of
the sodium hydroxide solution and Vtitrated is the volume
of NaOH at the equivalence point. The percentage shown in equation 1 is relative to the initial amount of maleic anhydride.
Using the insoluble component (PLA and PLA-MA) the molar weight was determined through gel permeation chromatography (GPC) employing high performance liquid chromatography (HPLC, model LC-20, Shimadzu, Kyoto, Japan). Three columns connected in series were used to detect the polymers according to their molar weight: GPC-801 (up to 1.5 × 10³ g mol−1), GPC-804 (up
to 4.0 × 10⁵ g mol−1) and GPC-807 (up to 2.0 × 10⁸ g mol−1).
The columns were filled with a porous gel comprised of styrene-divinylbenzene, with length and diameter of 30 cm and 8 mm, respectively. PLA (0.02 g) was dissolved in 4 mL of tetrahydrofuran and the resulting solution was filtered through a cellulose acetate filter with a pore size of 0.45 mm (Chromafil-Xtra CA-45/25). Injection of the
sample (20 µL) was carried out at ambient temperature and the analysis was performed at 35 °C. The chromatograph was calibrated using styrene standards with molar weights ranging from 580 g mol−1 to 3,800,000 g mol−1.
Scanning electron microscopy (SEM)
The blend specimens were fractured under liquid nitrogen. The fractured samples were placed in a desiccator containing silica for 24 h. The specimens were coated with gold to avoid charging by the electron beam and analyzed by scanning electron microscopy (EOL JSM-6701F).
Dynamic mechanical analysis
The stress-strain analysis was performed using a dynamic mechanical analyzer (DMA Q800 TA Instruments). Specimens were cut with a width of 5.3 mm, length between 10 and 25 mm and thickness of 0.5 to 1.0 mm. Initially, the samples were maintained at 23 °C with a relative humidity (RH) of 58% and the tensile tests were performed at 25 °C, increasing the force at a rate of 0.5 N min−1 up to 18 N. The elasticity modulus was
calculated from the stress-strain curves considering the results of at least three tests for each sample. To determine the glass transition temperature (Tg) a heating ramp of
−50 °C to 150 °C was applied at a rate of 2 °C min−1 with
a frequency of 1 Hz.
Water vapor permeability
The water vapor permeability (WVP) of the films was determined in appropriate diffusion cells, with RH values of 2% (inside the cell) and 75% (outside the cell). The WVP was calculated using equation 2.12
(
)
w
s w1 w 2
W K
SP a a
=
− (2)
where δ is the average film thickness, S is the film permeation area (0.005 m2), a
w1 (RH1/100) is the water
activity in the chamber, aw2 (RH2/100) is the water activity
inside the cell, Ps is the water vapor pressure at the
experimental system temperature (25 °C) and W (water mass/time) was calculated using the linear regression of mass variation over time, under steady-state permeation. All tests were conducted in triplicate.
Sorption isotherms
The sorption isotherms were obtained through the static method, using saturated saline solutions to obtain different relative humidity conditions.13 The samples were previously
dried for 10 days in desiccators containing silica. Samples with 0.500 ± 0.001 g (in triplicate) were then placed in
desiccators containing different saturated salt solutions providing values for the equilibrium relative humidity (ERH) of 11, 33, 43, 58, 75 and 81%. A hygrometer (Instrument, model ITHT 2210, São Paulo, Brazil) was used to control the relative humidity. The desiccators were kept for 15 days in an environment at 25 ± 2 °C for the samples to reach the equilibrium moisture content. The Guggenheim-Anderson-de Boer (GAB) model was used to represent the experimental equilibrium data. The GAB model parameters were determined by non-linear regression, using the Statistica software program (version 7.0, 2004, Oklahoma, USA).
Statistic analysis
The Statistica software program (version 7.0, 2004, Oklahoma, USA) was used for all of the statistical analysis. Analysis of variance (ANOVA) and the Tukey test for the comparison of means were applied in the experimental data analysis. The significance level considered was 0.05.
Results and Discussion
Evaluation of quantity of PLA, PLA-g-MA and MA in TPS/PLA blends
Table 1 shows the total weight extraction percentages for PLA, PLA-g-MA and MA related to the initial composition of the components, and the free MA percentage related to the initial weight of MA in the TPS/PLA blends produced using a torque rheometer. As expected, the samples which did not contain MA (Blend B0), showed a higher percentage of extraction, in agreement with the initial composition of the components, suggesting an absence of interaction between the PLA and the TPS matrix. As discussed in previous studies, this blend is immiscible.7 However, for Blends B1 and B2, the
of all components (Blend B2). This may be related to the low degree of interaction between the PLA and the reagents (initiator and maleic anhydride), reinforcing the finding that with the absence of glycerol in the medium the grafting reaction was less favored. The percentage of grafted MA is consistent with the values for PLA and MA extracted from the blends, and the blends which showed a low percentage for the extraction of PLA and MA showed the highest percentage of grafted maleic anhydride.
The decrease in the percentage extracted was not affected by the decreased in percentage of free MA (Blends B1 and B2, shown in Table 1). This suggests that the grafting reaction occurs in the PLA macromolecular backbone through a competitive reaction with the starch or glycerol components. However, radical grafting to the PLA is favored compared with a nucleophilic attack of the hydroxyl groups of the starch and glycerol on the carbonyl carbon of the maleic anhydride.
Morphology
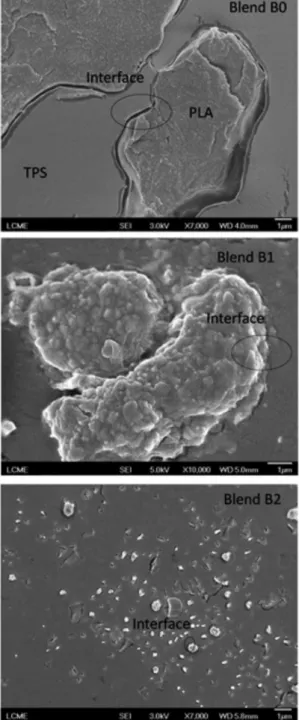
The morphology of the samples can be evaluated from the SEM micrographs of the fractured surfaces of the TPS/PLA blends obtained through different procedures (Figure 2). Blend B0 (without MA) shows a surface without roughness and with discontinuity at the interface between the PLA domains and the TPS matrix, as indicated in Figure 2. A similar result was obtained by Müller et al.,14
with 70/30 m/m TPS/PLA blends produced in an extruder. Blend B1 (with previously grafted MA) showed interfacial domains/matrix adhesion, due to interactions between specific groups of the TPS and the MA grafted onto the PLA backbone. The compatibility of the polymer blend is related to the hydrogen bonding between the OH groups present in glucose (the repeating unit of starch) and the molecules of MA grafted onto the PLA polymer chain. A reduction in the domains of PLA grafted with MA in the TPS matrix observed in Blends B1 and B2 indicates a greater interaction between the components at the interface and a better dispersion of PLA and PLA-g-MA in the TPS matrix, possibly promoted by the dissolution of the PLA
and PLA-g-MA in the TPS matrix. This is in agreement with the degree of maleic anhydride grafted, i.e., the blend with the smallest domains of PLA in the TPS matrix was the blend with the highest percentage of grafted MA. Huneault and Li7 showed that in PLA/TPS blends (PLA
matrix) with MA grafted onto the PLA backbone there is a reduction in the TPS domains in the PLA matrix, due to phase compatibility. This interphase interaction occurred for TPS/PLA-g-MA obtained through both processes, that is, from the physical mixture of components or previous grafting of the maleic anhydride onto the PLA backbone.
Table 1. Extraction percentages for PLA, PLA-g-MA and MA, and percentage of free MA in the blends
Sample Extractiona / % Free MAb / %
Blend B0 93 ± 7 −
Blend B1 41 ± 2 75 ± 4
Blend B2 31 ± 3 44 ± 3
aTotal weight of PLA, MA and PLA-g-MA extracted in relation to the
initial composition of the components and bin relation to the initial MA
weight. Average ± standard error.
This is in agreement with the degree of maleic anhydride grafted, i.e., as the degree of grafting increases the size of the PLA domains decreases, as shown in Figure 1. Blend B0 (without MA) had the largest domain size, and Blend B2 (with a greater amount of MA grafted) had the smallest domain size.
PLA molar weight after mechanical process
The normalization of the data on the relative peak height for the molar weight versus elution time for the samples of PLA extracted from the TPS/PLA blends and PLA not subjected to a mechanical process was performed by adopting the maximum peak height of each chromatogram. The PLA extracted from the TPS/PLA blends produced in the torque rheometer showed a wider distribution of the molar weight, suggesting that degradation of the PLA backbone occurred during the mechanical process. Blends B0, B1 and B2 showed increases of 28, 36 and 29%, respectively, in the chains with lower molar weight, estimated from the peak area on the chromatogram.
Table 2 shows the values for the average molar weight (Mw) and dispersity of the PLA sample extracted from
the TPS/PLA blends and the PLA without mechanical processing. The values showed a significant reduction in molar weight and an increase in dispersity, indicating a wider molar weight distribution for these samples.
Rheological and mechanical properties
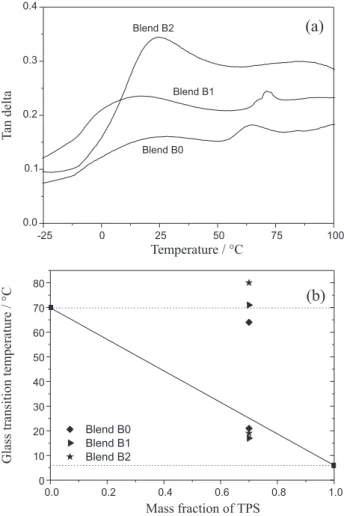
Figure 3a shows the tan delta versus temperature curves for the TPS/PLA laminate, which indicates two glass transition temperatures (Tg) related to the TPS and
the PLA. Based on the Tg values previously reported
for the pure components,14,15 the values (Fox equation)
expected when the blends are miscible were estimated, as indicated in Figure 3b by the solid line. On considering the TPS/PLA blend (composition 70/30 m/m) to be miscible, a single glass transition temperature of 25 °C was estimated. The Tg values determined from the DMA curves for the
components of the blends obtained are given in Figure 3b.
The fact that there are two Tg values for the samples
indicates immiscibility of the blend components. It can be seen that the Tg values for the PLA follow a different
pattern in relation to those for TPS. The higher Tg value
for the PLA is related to a higher degree of MA grafting (Blend B2). These results suggest that the MA grafted onto the PLA polymer chain decreases the mobility of the PLA chains, and the free MA has no effect, whereas for the TPS it can be observed that with a higher amount of free MA, the Tg value decreased, indicating that the free MA acts as
a plasticizer in the TPS matrix.
Table 2. Molar mass, dispersity and crystallinity of PLA unprocessed and extracted from TPS/PLA blends and Young’s modulus of TPS/PLA laminates
Sample Molar weight × 10−4 Dispersity Crystallinity / % Young modulus / MPa
Blend B0 5.0 2.1 52 143 ± 15a
Blend B1 4.1 1.8 41 26 ± 6b
Blend B2 4.9 2.0 38 11 ± 2b
PLA 7.9 1.7 54 −
Mean ± standard error. Different lower-case letters represent a significant difference (p < 0.05) between the means according to the Tukey test.
-25 0 25 50 75 100
0.0 0.1 0.2 0.3 0.4
Blend B1
Blend B0
Temperature / °C
T
an delta
Glass transition temperature / °C
(a) Blend B2
0.0 0.2 0.4 0.6 0.8 1.0 0
10 20 30 40 50 60 70 80
Blend B0 Blend B1 Blend B2
Mass fraction of TPS
(b)
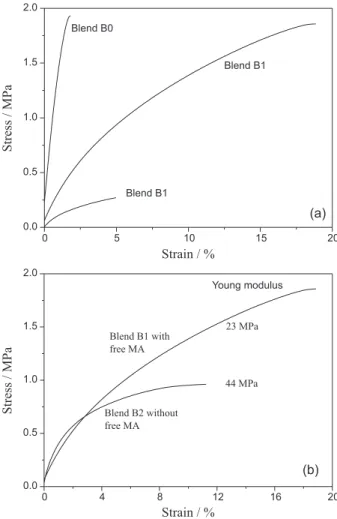
Figure 4a shows the stress-strain curves for the TPS/PLA laminate. The Young’s modulus (Table 2) is related to the stiffness of the polymers, a more rigid polymer having a higher modulus. Blend B0, without MA, showed a greater rigidity and lower strain than blends containing MA in their composition. The behavior observed for this TPS/PLA blend maybe due to the absence of PLA plasticizer.
Blends B2 and B1 had Young’s modulus values 82 and 93% lower than that of Blend B0 (without MA), respectively. The reduction in the Young’s modulus for the blends with MA is associated with the effects of the free and grafted MA. The MA grafted onto the PLA macromolecular backbone promoted a reduction in the crystallinity of PLA (Table 2).16 The results of a study by
Hwang et al.17 indicated that PLA grafted with MA had a
lower Young’s modulus due to decreased crystallinity of the polymer in the presence of the grafted MA. Another effect is related to the blends with ungrafted MA, i.e., free MA, which acts as a plasticizer, decreasing the Young’s modulus. However, the effect of free MA on
the mechanical properties of the TPS/PLA blends is not often discussed. It was observed that MA can act as a plasticizer or compatibilizer in the TPS/PLA blend, with free and grafted MA modifying the micro- and macroscopic properties. As a plasticizer, MA can reduce the Tg and increase the mobility of the polymer chains
with a decrease in the blend rigidity, and the grafted MA reduces the crystallinity of the PLA-g-MA, leading to a reduction in the Young’s modulus of TPS/PLA blends.
Figure 4b shows the stress-strain curves for Blend B1, prepared with previously grafted MA obtained: (i) from the torque rheometer process; and (ii) after removal of the MA, which was not grafted under the reaction conditions. The curves suggest that free MA acts as a plasticizer, reducing the rigidity and increasing the strain of the blend, while the results for the samples without free MA in the blend composition indicate that the grafted MA acts as compatibilizer with greater rigidity compared the samples with free MA (Figure 4b). Another important point is to consider is that MA is the main “actor” in reducing the value of the Young’s modulus, considering that the same TPS production procedure was applied for Blends B0 and B1. If the dilution process were the main factor influencing the Young’s modulus, the values for Blends B0 and B1 would be similar.
These results suggest that the free MA (i.e., ungrafted MA) acts as a plasticizer, decreasing the crystallinity and increasing the strain of the blend. Blend B1 showed greater strain than the other blends, in agreement with the quantification data for MA, which indicates that this blend contained the highest percentage of free MA (75%).
Water vapor permeability
The WVP of the TPS/PLA laminate determined gravimetrically is shown in Table 3. The magnitude of the values is in agreement with the data obtained by Müller et al.,14 who studied TPS/PLA blends with different
concentrations of PLA and plasticizers. The data indicates no significant difference between the samples; however, when compared to samples obtained by Müller et al.4
they showed a higher WVP. It was expected that, with the addition of a coupling agent, a decrease in the WVP would occur, however, the opposite trend was observed. The decrease in the PLA molar weight influenced the WVP by increasing the amount of hydroxyl groups and thus the solubility coefficient, thereby increasing the interactions with water and consequently the WVP.
Table 3 shows the WVP for the different laminates. The permeability values are in the range of 0.5 to 1.3 × 10⁻⁶ m g h–1 Pa–1 m–2 for the samples obtained using
0 5 10 15 20
0.0 0.5 1.0 1.5 2.0
Blend B1
Blend B1
Strain / %
Blend B0
(a)
0 4 8 12 16 20
0.0 0.5 1.0 1.5 2.0
Blend B2 without free MA
23 MPa
Strain / %
Stress / MPa
Stress / MPa
Blend B1 with free MA
44 MPa
(b)
Young modulus
the torque rheometer, suggesting that a reduction in the molar mass is the predominant factor associated with a reduction in the water vapor permeability.
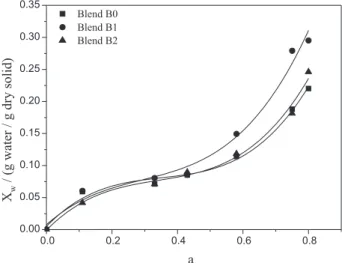
Sorption isotherms
Figure 5 shows the moisture sorption isotherms for the TPS/PLA blends, where the solid lines correspond to the fitting of the GAB model. The values for each parameter of the GAB model (m0, k and C) are given in Table 3.
The moisture sorption isotherms for all laminates showed the sigmoidal characteristic of hydrophilic materials, presenting different values for the equilibrium moisture content (≥ 50% relative humidity). The data in Table 3, including the values for the fitted parameters of the GAB model, are consistent with those obtained in previous studies on starch films.14
The m0 values were significantly higher for Blend B2
compared with Blends B0 and B1, while the m0 values
for Blends B0 and B1 showed no significant difference between them. These data are consistent with the results for the water vapor permeability discussed earlier, where Blend B2 provided the highest value.
Increased equilibrium moisture and water vapor permeability for the modified samples is unexpected
behavior, because the compatibility of the blends was expected to decrease these parameters. However, the increase in the hydroxyl groups due to the reduction in the molar weight of the PLA may have increased the hydrophilicity of the blends, leading to greater absorption of moisture.
The values for the parameter C, associated with the heat of sorption of the monolayer, did not have a significant effect on the sorption isotherms. Also, it was noted that the values for the parameter k were not significantly affected by changes in the TPS/PLA laminate obtained using the torque rheometer.
Conclusions
For the blends studied, the influence of free and grafted MA on the PLA backbone can lead to interesting characteristics in relation to the micro- and macroscopic properties. TPS/PLA blends obtained using a torque rheometer showed a reduction in the average molar weight. On the other hand, as unexpected, the blends did not affect the barrier properties in relation to water vapor permeability and the absorption of water in the monolayer.
However, the TPS/PLA blends, with free or grafted MA in the blend composition, showed higher strain than the blends without MA suggesting that: (i) the free MA acts as a plasticizer; and (ii) the grafted MA acts as a compatibilizer at the domain/matrix interface, which influences the flexibility of the blends. On the other hand, the mixing processes carried out to produce Blend B2 resulted in smaller PLA domains compared with the other procedures (Blends B0 and B1) and affected the compatibility properties. These results indicate that specific micro- and macroscopic properties can be obtained by controlling the plasticizer and compatibilizer or the mixing processes used to produce the blends.
Acknowledgements
The authors are grateful for the financial support provided by CAPES and CNPq and the LCME/UFSC by performed microscopy.
Table 3. Fitting of the GAB model to the sorption isotherms and data on the water vapor permeability of TPS/PLA laminate
Sample WVP × 10
–6 /
(m g h−1 Pa−1 m−2)
Parameter of GAB model
m0 k C
Blend B0 0.67 ± 0.12a 0.049 ± 0.002a 0.97 ± 0.02ab 4825
Blend B1 1.04 ± 0.04a 0.048 ± 0.001b 1.01 ± 0.01ab 122
Blend B2 1.12 ± 0.31a 0.070 ± 0.001b 0.96 ± 0.01ab 20
Mean ± standard error. Different lower case letters represent a significant difference (p < 0.05) between the means according to the Tukey test.
0.0 0.2 0.4 0.6 0.8
0.00 0.05 0.10 0.15 0.20 0.25 0.30 0.35
Blend B0 Blend B1 Blend B2
X
/ (g water / g dry solid)
w
aw
References
1. Averous, L.; Boquillon, N.; Carbohydr. Polym. 2004, 56, 111. 2. Rodrigues-Gonzalez, F. J.; Ramsay, B. A.; Favis, B. D.;
Carbohydr. Polym. 2004, 58, 139.
3. Tajiddin, S.; Xie, F.; Nicholson, T. M.; Liu, P.; Halley, P. J.;
Carbohydr. Polym. 2011, 83, 914.
4. Müller, C. M. O.; Yamashita, F.; Laurindo, J. B.; Carbohydr. Polym. 2008, 72, 82.
5. Soares, F. C.; Yamashita, F.; Müller, C. M. O.; Pires, A. T. N.;
Polym. Test. 2014, 33, 34.
6. Bolay, N. L.; Lamure, A.; Leis, N. G.; Subhani, A.; Chem. Eng. Process. 2012, 56, 1.
7. Huneault, M. A.; Li, H.; Polymer 2007, 48, 270.
8. Wang, N.; Yu, J.; Chang, P. R.; Ma, X.; Carbohydr. Polym. 2008,
71, 109.
9. Wang, H.; Sun, X.; Seib, P.; J. Appl. Polym. Sci. 2001, 82, 1761. 10. Wootthikanokkhan, J.; Wongta, N.; Sombatsompop, N.;
Kositchaiyong, A.; Wong-On, J.; Ayutthaya, S. I.; Kaabbuathong, N.; J. Appl. Polym. Sci. 2011, 124, 1012.
11. Wootthikanokkhan, J.; Kasemwananimit, P.; Sombatsompop, N.; Kositchaiyong, A.; Ayutthaya, S. I.; Kaabbuathong, N.; J. Appl. Polym. Sci. 2012, 126, E388.
12. ASTM E 96-00: Standard Test Methods for Water Vapor Transmission of Materials, Philadelphia, 2002.
13. Bell, L. N.; Labuza, T. P.; Moisture Sorption: Practical Aspects of Isotherm Measurement and Use, 2nd ed.; AACC Egan Press:
Egan, 2000.
14. Müller, C. M. O.; Pires, A. T. N.; Yamashita, F.; J. Braz. Chem. Soc. 2012, 23, 426.
15. Jonoobi, M.; Harun, J.; Mathew, A. P.; Oksman, K.; Compos. Sci. Technol. 2010, 70, 1742.
16. Garlotta, D.; J. Polym. Environ.2001, 9, 63.
17. Hwang, S. W.; Lee, S. B.; Lee, C. K.; Lee, J. Y.; Shim, J. K.; Selke, S. E. M.; Sota-Valdez, H.; Matuana, L.; Rubino, M.; Auras, R.; Polym. Test. 2012, 31, 333.
Submitted: February 26, 2015