Article
0103 - 5053 $6.00+0.00*e-mail: [email protected]
Evaluation of a Simple Hyphenated System for Flow Injection Solid-Phase
pre-Concentration and Capillary Electrophoresis
Nilson A. Assunção,a Carlos E. S. Miranda,a,b Fernando M. Lanças,a
Maria Fernanda G. G. Rosiasc and Emanuel Carrilho*,a
aInstituto de Química de São Carlos, Universidade de São Paulo, Av. Trabalhador São Carlense, 400,
CP 780, 13570-970 São Carlos-SP, Brazil
bCurso de Ciências Farmacêuticas, Universidade de Ribeirão Preto, Av. Costábile Romano, 2.201, Ribeirânia,
14096-900 Ribeirão Preto-SP, Brazil
cCentro de Energia Nuclear na Agricultura (CENA), Universidade de São Paulo, Av. Centenário, 303,
13400-970 Piracicaba-SP, Brazil
Nesse trabalho apresentamos um sistema hifenizado envolvendo as duas técnicas analíticas: eletroforese capilar (CE) e análises por injeção em fluxo (FIA), denominado de FIA-CE. Parâmetros como a influência do fluxo e a natureza do eluente frente ao sistema CE foram avaliados. O sistema demonstrou-se promissor quanto à possibilidade de aplicações em diferentes áreas da química analítica. O aumento da sensibilidade foi da ordem de 660% devido ao emprego de colunas de troca iônica no sistema FIA. Esse resultado comprova o grande potencial do sistema FIA-CE.
In this work, the development and evaluation of a hyphenated flow injection-capillary electrophoresis system with on-line pre-concentration is described. Preliminary tests were performed to investigate the influence of flow rates over the analytical signals. Results revealed losses in terms of sensitivity of the FIA-CE system when compared to the conventional CE system. To overcome signal decrease and to make the system more efficient, a lower flow rate was set and an anionic resin column was added to the flow manifold in order to pre-concentrate the analyte. The pre-concentration FIA-CE system presented a sensitivity improvement of about 660% and there was only a small increase of 8% in total peak dispersion. These results have confirmed the great potential of the proposed system for many analytical tasks especially for low concentration samples.
Keywords: instrumentation, automation, flow injection analysis, solid-phase extraction
Introduction
Hyphenated systems involving flow injection (FI) analysis and capillary electrophoresis (CE) with pre-concentration have been successfully reported in literature1-10
since they allowed overcoming one of the main drawbacks of CE, which is low sensitivity. Such systems increase the levels of detectability due to the pre-concentration step, and simultaneously are time saving since sample pre-concentration is carried out on-line. Additionally, the FI-CE system with on-line pre-concentration is an elegant system specially when compared to the batch-based system and
also could be considered more efficient than these one. Solid phase extraction (SPE) based on packed micro-columns connected in series with capillary inlet has attracted considerable interest. This approach has been widely employed because it allows both elimination of matrix interference and analyte pre-concentration simultaneously. Analyte elution using organic solvents often provides the eluted analyte a suitable medium for further pre-concentration by field amplification effects in CE.11However,
The first FI-CE prototypes presented a great advance since it allowed sample sequential injections with no interruption of the applied high voltage, what is not possible with a conventional CE system. It should be also emphasized that those FI-CE systems did not cause any significant increase on peak dispersion and presented good repeatability.1,2 Despite of good features obtained with the
FI-CE system, a serious loss of sensitivity was observed. To overcome this drawback, a solid phase extraction column was added to the flow manifold. Chen et al.3
have developed a pre-concentration FI-CE system, which allowed an increase in detectability nearly 1 to 2 times as well as kept peak dispersion in acceptable levels. An on-line pre-concentration system using ion exchange resin for nitrate ions analysis in water samples was developed by Arce et al.8 FIA-CE systems present great versatility,
which is very useful for many analytical procedures.4-26
However, there is still a lot to be explored in this issue. On-line solution management is one of the most important advantages the FI systems can offer considering coupling with CE.
A pioneer FIA-CE system with a split-flow interface was used for on-line pre-concentration of pseudo-ephedrine by solid phase extraction on a micro-column packed with C18. Sensitivity enhancements of 180 fold in a 4 min sample loading were thus achieved with a sample throughput of 9 h−1 and 4.7% relative standard
deviations (n = 10, 2 µg mL−1 pseudo-ephedrine) for
peak area evaluation, without significant loss of column efficiency.27
Continuous flow systems have great potential for solving a wide variety of analytical problems. These systems offer major advantages for the analysis of liquid samples, especially water, whose pretreatment is normally quite simple. However, although different alternatives have been proposed to perform multi-analyte determinations, based on design of specific manifolds, the main and simpler applications developed are concerned to sample pretreatment. For many real applications, this aspect is a limitation, because a different set of treatments is generally required for a given sample. This is why so much attention has been paid in the past to the integration of flow systems with methods based in separation techniques such as chromatography.28-30
In this work, an anionic resin column was added to the flow manifold that was coupled to commercial CE equipment in order to overcome one of the most serious disadvantages of FI-CE systems, which is low sensibility. Pre-concentration flow parameters such as the nature and concentrations of eluent solution, elution flow rate, loading time, pre-concentration flow rate were carefully
studied to establish best analytical conditions for analyte pre-concentration.
Experimental
Reagents
All reagents were analytical-grade and the solutions were prepared in ultra pure water obtained from a Milli-Q Plus System (Millipore, Milford, MA). Benzoic acid, sodium tetraborate, sodium hydroxide and hydrochloric acid were purchased from Merck (Rio de Janeiro, Brazil). Sodium chloride was purchased from Synth (Rio de Janeiro, Brazil).
Solutions
A 10 mmol L-1 benzoic acid was used as stock solution.
Buffer solutions were prepared from sodium tetraborate with 10 mmol L-1 and pH was adjusted to 10 by using
sodium hydroxide. The eluent solutions used for analyte desorption from the column were: 1.5 mol L-1 sodium
chloride, sodium hydroxide or hydrochloric acid. Sodium hydroxide solutions with 0.1 and 1.0 mol L-1 were used for
capillary conditioning.
Equipment and accessories
The CE equipment was a Waters Quanta 4000 (Milford, MA, USA) with UV-visible detector operated in direct mode and using a fused silica capillary (Polymicro Technologies, Phoenix, AZ) with 60 cm total length, 52.5 cm of effective length, 75 µm i.d. and 375 µm o.d. for analyte separation and detection. The analyte was monitored at 214 nm. Electric field was 250 V cm-1.This system was used in CE
and FI-CE experiments.
Procedure
In the system depicted in Figure 1, the sample solution is flowing through the column for analyte concentration. At the same time, loop L is loaded with eluent solution and the carrier solution is flowing through the analytical path passing by the interface in which the capillary is fixed. When the injector is switched, both column and loop L are inserted into the analytical path. Then, the eluent solution is moved forward by the carrier solution up to the resin column for analyte elution. As the analyte ions are eluted from column, they are transported towards interface. When those species reach the interface, they are affected by electric field, which causes the analyte to be electrokinetically injected into the capillary. Simultaneously to injection, electrophoresis separation is started.
Before using the capillary for the first time, it is necessary to activate the silanol groups from the capillary inner surface. This procedure is carried out by conditioning the capillary with a 1 mol L-1 sodium
hydroxide solution followed by 0.1 mol L-1 sodium
hydroxide solutions. In next step, the capillary was washed with water and buffer solution, subsequently. Each one of these steps last nearly 5 min. Between the analytical runs, 0.1 mol L-1 sodium hydroxide and
buffer solution are introduced in the capillary for 2 min. Inside the capillary, the analytes are separated under the influence of the electroosmotic flow, which is pH-dependent and the effect of the electric field generated by the high voltage applied to the system.
Results and Discussion
The nature and concentration of the eluent solution
Preliminary results have indicated that the best eluent concentration for quantitative analyte elution was 1.5 mol L-1 hydrochloric acid. Higher concentrations, up to
3.0 mol L-1, lead to a greater mass effect, which guarantees a
better quantitative desorption. However, this concentration caused a great production of bubbles, which probably occurred due to the neutralization reaction between hydrochloric acid and hydroxide present in the buffer solution. The electric field was then interrupted due to excess of bubbles since electrophoresis separation becomes impracticable. Therefore, despite the good mass effect, this concentration could not be reproducibly used. On the other hand, 1.0 mol L-1 hydrochloric acid concentration
was too low to assure quantitative analyte desorption. Thus, 1.5 mol L-1 was selected since allowed not only an efficient
elution but also a stabilized electric field.
Two other eluent solutions, sodium chloride and sodium hydroxide, were tested to verify whether they would produce or not a better elution efficiency. They were used with the same concentration levels defined for the hydrochloric acid, i.e., 1.5 mol L-1. According to Figure 2, when sodium
chloride was used, the analytical signals were similar to those obtained with hydrochloric acid in terms of signal profile. The difference in terms of migration times observed between those two eluent solutions may be explained by changes in the ionic strength caused by sodium ions. It is
Figure 1. FI-SPE-CE system. A: Holder and buffer reservoir; B: Detector; C: Interface; D: injector and column (loop with length 2.5 cm and 0.8 mm of i.d.); E: trash; F: peristaltic pump; G: buffer solution and samples; H: High Voltage source.
also interesting to point out that bubbles were no longer a problem when sodium chloride was used. However, some spurious signals probably caused by impurities contained in sodium chloride were eventually observed.
When sodium hydroxide was employed as eluent solution, the analyte peak presented a minor magnitude and a severe broadening. This probably occurred due to the hydroxide ions low selectivity to resin, which avoided analyte quantitative desorption. In this study, the buffer solution used was sodium tetraborate 10 mmol L-1, with pH
10. A 15 kV high voltage was used for electrophoresis run and the eluent solution loop was 2.5 cm long. The acidity range used in this work leads the species inside the capillary to full ionic form. Such ionic forms presented high ionic mobility against direction of electroosmotic flow.
Effect of the resin mesh size
The resin mesh-size and the procedure used for SPE column packing could also have had some influence in bubble production inside the system. Since a 50-100 mesh size resin was used, there were relatively great interstitial spaces inside the column. In addition, the resin was introduced into column under low pressure, which led to irregular packing. The sum of these two factors could explain the bubbles observed. If a smaller mesh-size were used, better results would be probably reached due to minimization of dead volume inside the column. Furthermore, dead volume could also contribute for the undesirable increase of the sample zone dispersion.
Effect of eluent loop volume
The results obtained when different loop lengths were tested demonstrated the eluent solution loop with 2.5 cm long was the most suitable. When loops with 5.0 and 7.5 cm were used the production of bubbles was increased. This happened as a consequence of the greater volume of eluent solution introduced inside the column, which intensified the neutralization reaction between the hydrochloric acid and the basic buffer, as previously mentioned.
Since the loop with 2.5 cm long presented the best results for hydrochloric acid, this length was also adopted for both sodium chloride and sodium hydroxide eluent solutions. It must be also considered that a larger volume of eluent solution introduced into the column would change the ionic strength of the solution and consequently the electrophoretic mobility and, therefore, the electroosmotic flow. However, this type of effect involves a complex combination of factors,15 which needs to be more carefully
evaluated for analyte separation.
Effects of the concentration time
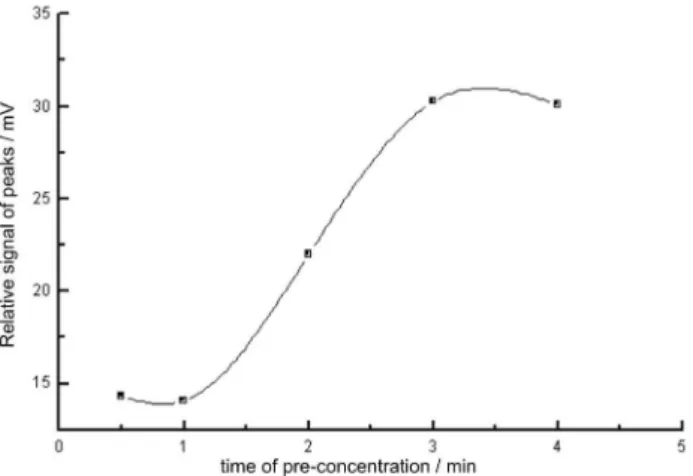
A long pre-concentration time allows high enrichment factors to be reached, however, this implies in a considerably great consumption of sample solutions. This is disadvantageous in some analytical procedures, e.g., biological fluids or forensic sample analysis. It should be also stressed that long pre-concentration times means low analytical throughput, which is one of the main disadvantages of the pre-concentration procedures. Moreover, the consumption of micro-volumes is an intrinsic characteristic of capillary electrophoresis. Thus, to make the FI-CE coupling successful, it is necessary to minimize sample solution consumption from the FI systems. According to Figure 3, as pre-concentration time was increased the magnitude of analytical signal was also increased improving analyte quantification level. After a pre-concentration time of 3 min, the relative intensity of the signal presented an asymptotic behavior, which express that the breakthrough point was reached.16 When
the breakthrough point is reached, there is no more increase on magnitude of the analytical signal because all resin active sites are no longer available. As depicted in Figure 3, after a pre-concentration time of 3 min, the column was apparently saturated thus, the analytes passed unretained through the column. Therefore, a pre-concentration time of 2 min was selected considering not only a good level of quantification but also a satisfactory analytical throughput was reached.
Effect of elution flow-rate
solution and the resin active sites for analyte quantitative release.16 Therefore, if the elution flow-rate is increased, a
greater volume of eluent is required to allow a quantitative analyte elution. In this case, some conductivity change in buffer solution could take place and as a consequence the efficiency of the separation could be harmed. In this study, three different flow-rates of elution were tested since there was a limitation imposed by interface. It should be also stressed that high flow-rates could cause an increase of the interface pressure, leading to a disruption of connections. The range of flow-rate studied was 1-6 mL min-1 and best
results for elution flow-rates found were 1 mL min-1.
Effect of pre-concentration time on signal intensity
To evaluate the effect of the pre-concentration time on signal intensity, tests with different concentrations of benzoic acid (1-1000 µmol L-1) were carried out. In
these tests, 1.5 mol L-1 hydrochloric acid solution was
used as eluent. The analyte pre-concentration time was 2 min, a voltage of 15 kV was applied to the system and a 10 mmol L-1 sodium tetraborate solution pH 10.0 was the
buffer solution. From the results obtained in this study, it was possible to verify that an increase in the concentration of the sample solution did not lead to a proportional dispersion of the respective signal, as it can be verified in both Figure 4 and Table 1. This fact can be pointed out as the most positive aspect of the proposed methodology and it can be attributed to the no occurrence of dispersive effects during the electrophoretics process. The dispersion found in the system is only related to the connections of FI and CE systems.
When data from CE and FIA-CE systems, presented in Table 1, are compared, a reduction in signal intensity around 5 times and an increase in total dispersion over 6 fold were observed for the last one. Such behavior can be explained only in terms of signal reduction and not as a consequence of dispersive effect increase. This signal reduction could be probably caused by the split-flow.
To overcome such loss, a SPE column with an ion exchange resin was inserted in the flow manifold. When compared to the conventional CE system, the pre-concentration FI-SPE-CE system presented an increase of 660% in of analytical signal. These results demonstrated that the inclusion of a pre-concentration step in FI-SPE-CE system has a great potential for analysis of samples whose concentration are below detection limit of a conventional CE system.
In comparative studies between conventional CE and FI-SPE-CE system, a 100 µmol L-1 benzoic acid solution
was directly analyzed by a conventional CE system. Afterwards, this solution went through a 100-fold dilution being subsequently analyzed by using pre-concentration FI-CE system.
When both systems were compared in terms of dispersion, FI-SPE-CE system presented dispersion three times greater than the conventional CE system. The proper evaluation of the dispersive effect was carried out taking into account how great the difference between sample and buffer concentration was and how intense the electric field through the sample zone was. It is also necessary to consider the changes in ionic strength due to variation in conductivity inside of capillary and after elution of analytes from SPE column.
Analytical features
Detection limits were calculated for the three analytical systems: CE, FI-CE and pre-concentration FI-SPE-CE Figure 4. Direct comparison of dectectability among CE, CE, and
FI-SPE-CE systems. The electrophoretic conditions were the same of Figure 2. A: 100 µmol L-1 (CE system); B: 1 µmol L-1 (FIA-CE system with pre-concentration); C: 10 µmol L-1 (FIA-CE system with pre-concentration); D: 100 µmol L-1 (FIA-CE system with pre-concentration).
Table 1. Comparison of total peak dispersion, peak height and area for CE, FI-CE and FI-SPE-CE for pre-concentration systems
Concentration / (µmol L-1)
σ2 (tot) / (10-2 cm2)
Peak Height / (mV)
Peak Area / (Area units)
1.0a 3.8 1.7 2380
10.0a 3.9 3.0 26000
100.0a 4.1 13.0 254000
100.0b 1.2 2.0 2100
100.0c _ ND 0
1000.0b 2.3 16.0 272000
1000.0c 14.8 3.2 29000
according to IUPAC recommendations.16 Limits were:
4.2 × 10⁻⁵ mol L-1 for CE, 1.6 × 10⁻⁴ mol L-1 for FI-CE
and 3.7 × 10⁻⁷ mol L-1 for FI-SPE-CE, respectively. A
pre-concentration time of 2 min allowed a 26-fold enrichment factor and a sample consumption of 2.5 mL of sample
per determination. The proposed pre-concentration system presented good linearity (y = 112.84x + 1.725 and r = 0.9999) and an analytical throughput of 4 h-1 for analysis
of a highly mobile anionic species, such as benzoate.
Conclusions
Efficiency of the pre-concentration FI-SPE -CE system has been demonstrated by figures of merit presented in this work. The proposed system improved detectability of the conventional CE just by inserting a resin column in flow manifold. Such procedure allowed that a 26-fold enrichment factor was obtained spending a small sample volume. In addition, FI-CE coupling was carried out using a very simple device, which can be easily machined. All practical shortcomings related to FI-CE coupling such as proper grounding and electrical connections were completely overcome. Finally, it should be stressed that the proposed system can be easily automatized just replacing the acrylic injector by computer-controlled solenoid valves. Such system is already under development in our laboratory, in which the FI-SPE-CE is being used for concentration of drugs and biomarkers in plasma.
Acknowledgments
This work was supported by Capes, CNPq and FAPESP. Authors would like to thank Professor Boaventura Freire do Reis (CENA/USP) for his helpful discussions.
References
1. Kuban, P.; Engstrom, A.; Olsson, J. C.; Thorsen, G.; Tryzell, R.; Karlberg, B.; Anal. Chim. 1997, 337, 117.
2. Fang, Z. -L.; Liu, Z. -S.; Shen, Q.; Anal. Chim. 1997, 346, 135.
3. Chen, H. W.; Fang, Z. L.; Anal. Chim. 1999, 394, 13. 4. Kuban, P.; Karlberg, B.; Anal. Chem. 1997, 69, 1169. 5. Liu, Z.; Fang, Z. L.; Anal. Chim. 1997, 353, 199. 6. Chen, H. –W.; Fang, Z. L.; Anal. Chim. 1998, 376, 209. 7. Chen, H. L.; Wang, K. T.; Pu, Q. S.; Chen, X. G.; Hu, Z. D.;
Electrophoresis 2002, 23, 2865.
8. Arce, L.; Kuban, P.; Rios, A.; Valcarcel, M.; Karlberg, B.; Anal.
Chim. 1999, 390, 39.
9. Kuban, P.; Pirmohammadi, R.; Karlberg, B.; Anal. Chim. 1999,
378, 55.
10. Pu, Q. –S.; Fang, Z. -L.; Anal. Chim. 1999, 398, 65. 11. Lara, F. J.; García-Campaña, A. M.; Alés-Barrero, F.;
Bosque-Sendra, J. M.; Electrophoresis 2005, 2418, 26. 12. Kuban, P.; Karlberg, B.; Anal. Chim. 2000, 404, 19.
13. Fang, Q.; Wang, F. -R.; Wang, S. –L.; Liu, S. -S.; Xu, S. –K.; Fang, Z. L.; Anal. Chim. 1999, 390, 27.
14. Cheng, Y. Q.; Chen, H. L.; Fan, L. Y.; Chen, X. G.; Hu, Z. D.;
Anal. Chim. 2004, 525, 239.
15. Wang, J. W.; Cai, P. X.; Mo, J. Y.; Chen, Z. G.; Anal. Lett. 2005,
38, 857.
16. Santos, B.; Simonet, B. M.; Rios, A.; Valcarcel, M.;
Electrophoresis 2004, 25, 3427.
17. Kuban, P.; Reinhardt, M.; Muller, B.; Hauser, P. C.; J. Environ.
Monit. 2004, 6, 169.
18. Kuban, P.; Kuban, P.; Hauser, P. C.; Kuban, V.; Electrophoresis
2004, 25, 35.
19. Kuban, P; Kuban, P.; Kuban,V.; Anal. Bioanal. Chem. 2004,
378, 378.
20. Chen, H. L.; Fan, L. Y.; Chen, X. G.; Hu, Z. D.; Zhao, Z. F.; Hooper, M.; J. Sep. Sci. 2003, 26, 863.
21. Kuban, P.; Kuban, P.; Kuban, V.; Electrophoresis 2003, 24, 1935.
22. Cai, Z. X.; Chen., H. W.; J. Liq. Chromatogr. Relat. Technol.
2003, 26, 1695.
23. Fan, L.; Liu, L.; Chen, H.; Chen, X.; Hu, Z.; J. Chromatogr.
2005, 1062, 133.
24. Fang, Z. L.; Chen, H. W.; Fang, Q.; Pu, Q. S.; Anal. Sci. 2000,
16, 197.
25. Kuban, P.; Karlberg., B.; Anal. Chim. 2000, 404, 9.
26. Kuban, P.; Oldhoff, O.; Karlberg, B.; J. Chromatogr.1999, 857, 321.
27. Chen, H. W.; Fang, Z. L.; Anal. Chim. 1997, 355, 135. 28. Valcárcel, M.; Ballesteros, E.; Gallego, M.; Trends Anal. Chem.
1994, 13, 68.
29. Ballesteros, E.; Cardenas, M. S.; Gallego, M.; Valcárcel, M.;
Anal. Chem. 1994, 66, 628.
30. Cardenas, M. S.; Ballesteros, E.; Gallego, M.; Valcárcel, M.; J.
Chromatogr. 1995, 672, 7.
31. Reis, B. F.; Gine, M. F.; Zagatto, E. A. G.; Lima, J. L. F. C.; Lapa, R. A.; Anal. Chim. 1994, 293, 129.
Received: October 5, 2007 Web Release Date: July 23, 2008