Article
J. Braz. Chem. Soc., Vol. 25, No. 11, 1975-1983, 2014. Printed in Brazil - ©2014 Sociedade Brasileira de Química 0103 - 5053 $6.00+0.00
A
*e-mail: [email protected]
Cold Vapor Atomic Absorption Spectrometric Determination of Cadmium after
Solid Phase Extraction on Modified TiO
2Nanoparticles
Reza Hafezi Moghaddam, Ali Mohammad Haji Shabani, Shayessteh Dadfarnia* and Neda Baghban
Department of Chemistry, Yazd University, 89195-741 Yazd, Iran
O cádmio de uma amostra aquosa foi quantitativamente adsorvido em uma microcoluna
empacotada com cadion imobilizado em nanopartículas de TiO2 recobertas por dodecilsulfato
de sódio. O cádmio retido foi eluido com uma solução de ácido clorídrico 2,5 mol L-1 e medido
por espectroscopia de absorção atômica com vapor frio (CVAAS). As influências de diferentes variáveis, como pH, taxas de fluxo da amostra e do eluente, quantidade do sorvente e volume da amostra, na recuperação do cádmio foram investigadas. Sob condições ótimas, um volume de 200 mL de amostra resultou em um fator de pré-concentração de 100. A precisão (RSD%, n = 8)
em 0,05 µg L-1 de cádmio foi 3,6% e o limite de detecção, baseado em três vezes o desvio padrão
do branco (3Sb), foi de 1,3 ng L
-1. O método foi aplicado com sucesso à determinacão de cádmio
em amostras de arroz, peixe, leite e água.
Cadmium was quantitatively adsorbed from aqueous sample onto a microcolumn packed with
cadion immobilized on sodium dodecyl sulfate-coated TiO2 nanoparticles. The retained cadmium
was eluted with 2.5 mol L-1 hydrochloric acid solution and measured by cold vapor atomic
absorption spectrometry (CVAAS). The influences of different variables such as pH, sample and eluent flow rates, amount of the sorbent and volume of the sample on the recovery of cadmium were investigated. Under the optimum conditions, a sample volume of 200 mL resulted in a
preconcentration factor of 100. The precision (RSD%, n = 8) at the 0.05 µg L-1 level of cadmium
was 3.6% and the limit of detection based on three times the standard deviation of blank solution
(3Sb) was 1.3 ng L-1. The method was successfully applied to the determination of cadmium in
rice, fish, milk, and water samples.
Keywords: cadmium, solid phase extraction, cold vapor atomic absorption spectrometry,
cadion, modified TiO2 nanoparticles
Introduction
Cadmium is a highly toxic non-essential element for animals, plants and humans even at low concentrations and can be accumulated in kidneys, liver and lungs.1 Cadmium
is found in phosphate fertilizers, industrial dusts, tobacco smoke, food and some water supplies. The International Agency for Research on Cancer (IARC) classified
cadmium as a human carcinogen.2 The World Health
Organization (WHO) has set a maximum permissible level of 3.0 µg L-1 for this element in drinking water.3 Therefore,
determination of trace or ultra-trace amounts of Cd in water and food samples is of special interest.
The determination of cadmium at trace levels have been performed using a variety of instrumental analytical techniques such as flame atomic absorption spectrometry (FAAS),4 electrothermal atomic absorption spectrometry
(ETAAS),5 inductively coupled plasma optical emission
spectrometry (ICP-OES),6 spectrofluorimetry,7 neutron
activation analysis (NAA),8 and differential pulse anodic
stripping voltammetry (DPASV).9,10 In recent years, cold
vapor generation of cadmium for atomic absorption spectrometry as an alternative sample introduction technique has attracted more attention.11-13 The main
step usually is required due to the very low concentration of this element in the environmental samples.
S eve r a l p r o c e d u r e s f o r t h e s e p a r a t i o n a n d preconcentration of cadmium from aqueous samples have been developed, including solid phase extraction (SPE),14,15
coprecipitation,16 cloud point extraction (CPE),17,18
liquid-liquid extraction (LLE),19 temperature-controlled ionic liquid
dispersive liquid-phase microextraction (TCIL-DLPME),20
and ultrasound-assisted emulsification solidified floating organic drop microextraction (USAE-SFODME).21 Among
these separation and preconcentration methods, solid phase extraction has become increasingly more popular because of its advantages of simplicity, rapidity, ease of automation, low cost, low consumption of organic solvents, high recovery and high preconcentration factor. Different substances such as microcrystalline naphthalene,22 XAD
resins,23 modified alumina,24 activated carbon25, titanium
dioxide,26 and polyurethane foam27 have been proposed as
solid phase extractants. In recent years, a variety of metal oxide nanoparticles (NPs) such as Al2O3,
28 Fe 3O4,
29 CeO 2,
30
ZrO231 and TiO232 have been used as the new solid phase
materials for the extraction of metal ions from aqueous samples. Metal oxide nanoparticles have an excellent adsorption capacity toward metal ions owing to their high reactivity, small size and large surface area.33 Chemical
or physical modification of NP surface with appropriate chelating ligand can improve its affinity and selectivity towards metal ions.34,35
1-(4-nitrophenyl)-3-(4-phenylazophenyl)triazene (cadion), which forms a red water-insoluble chelate with cadmium (Figure 1), is a highly sensitive reagent commonly used for its spectrophotometric determination.36
In this work, the use of cadion immobilized on surfactant-coated TiO2 NPs for the solid phase extraction of trace
amounts of cadmium from aqueous solutions prior to its determination by cold vapor atomic absorption spectrometry is reported.
Experimental
Apparatus
An Analytik Jena model novAA® 300 (Jena, Germany)
atomic absorption spectrometer with deuterium lamp background correction was used for all absorption
measurements. A cadmium hollow cathode lamp (Analytik Jena, Germany) operated at 3.0 mA was used as the radiation source. The wavelength and spectral band pass were set at 228.8 and 1.2 nm, respectively.
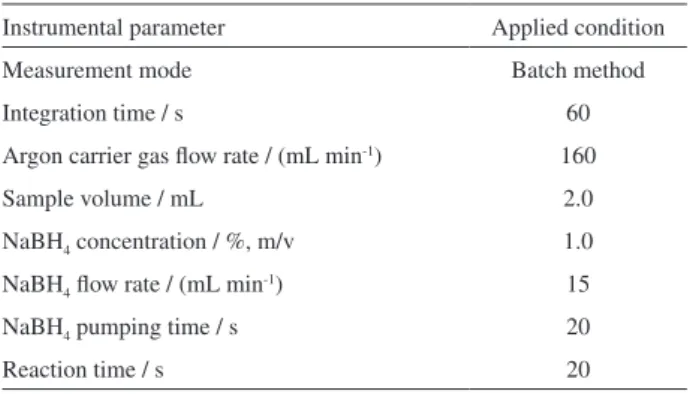
An Analytik Jena hydride generator (model HS-60, Jena, Germany) was used to produce the cadmium vapor. The vapor generator was used in batch mode. The cadmium ions were reduced to metallic cadmium with sodium tetrahydroborate and argon was used as the carrier gas. Important parameters for cold vapor atomic absorption spectrometric determination of cadmium were investigated and optimized. All the measurements were carried out in the optimized conditions given in Table 1.
The pH measurement was done by a Metrohm pH meter (model 691, Herisau, Switzerland) equipped with a combined glass-calomel electrode. The sample and eluent flow rates through the microcolumn were adjusted using a peristaltic pump (EYELA SMP-23, Tokyo, Japan).
Reagents
TiO2 nanoparticles (99.5% purity) were purchased from
Sigma-Aldrich (St. Louis, MO, USA). Other chemicals were of the highest purity available from Merck (Darmstadt, Germany) and used as received. Double-distilled deionized water was used to prepare all the solutions. A stock solution of Cd(II) at a concentration of 1000 mg L-1 was prepared
by dissolving appropriate amount of Cd(NO3)2.4H2O in 1%
(v/v) nitric acid solution. Working solutions were prepared daily by serial dilution of the stock solution. A 1.0% (m/v) sodium tetrahydroborate solution was prepared daily by dissolving an appropriate amount of NaBH4 in 0.3%
(m/v) sodium hydroxide. A 0.04% (m/v) cadion solution was prepared by dissolving 0.04 g of cadion in 100 mL of ethanol. The glassware used was soaked overnight in 10% nitric acid solution and was subsequently rinsed with double-distilled deionized water.
Table 1. Analytical parameters for the cold vapor atomic absorption spectrometric determination of cadmium
Instrumental parameter Applied condition
Measurement mode Batch method
Integration time / s 60
Argon carrier gas flow rate / (mL min-1) 160
Sample volume / mL 2.0
NaBH4 concentration / %, m/v 1.0
NaBH4 flow rate / (mL min-1) 15
NaBH4 pumping time / s 20
Reaction time / s 20
Preparation of the sorbent
TiO2 NPs were suspended in 25 mL of a solution
containing 100 mg of sodium dodecyl sulfate (SDS) and mixed with a magnetic stirrer. Then, 25 mL of cadion solution (0.04% m/v) were added and the pH was adjusted to approximately 2.5 with 1 mol L-1 hydrochloric acid
solution and mixed for 20 min. The mixture was filtered through Millipore filter using a vacuum pump. The solid phase was washed twice with distilled water, air dried and kept in a closed brown bottle for subsequent use. The modified sorbent was stable at least for 2 months.
Preparation of the microcolumn
The microcolumn was made of polytetrafluoroethylene (PTFE, Teflon®) tubing (35 mm in length × 3.0 mm i.d.) filled with a homogeneous mixture of 60 mg cadion-modified TiO2 NPs and 60 mg of glass beads, which were
retained in the column by a small portion of glass wool at both ends of the column. Glass beads were added to cadion-modified TiO2 NPs to prevent them from packing
the column too tight and improve the flow rate and backpressure in the system.35
Recommended procedure
The pH of sample or standard solution containing 1-36 ng of cadmium was adjusted to about 8.0 with diluted sodium hydroxide or hydrochloric acid solution and was passed through the microcolumn at a flow rate of 5 mL min-1 with the help of a peristaltic pump. The retained
cadmium on the microcolumn was then eluted using 2 mL of 2.5 mol L-1 HCl at a flow rate of 2 mL min-1 and was
transferred to the reduction cell. Five milliliters of 1% (m/v) NaBH4 solution as the reducing agent were added through
the peristaltic pump (Figure 2). The produced cadmium vapor was then directed to the quartz cell by a stream of argon at 160 mL min-1 and was quantified by atomic
absorption spectrometry. All measurements were performed by integrated absorbance mode (peak area).
Sample preparation
Water samples were filtered through a Millipore filter (0.45 µm pore size); the pH of the samples was adjusted to 8.0 with diluted sodium hydroxide or hydrochloric acid solution, and was treated according to the recommended procedure.
Fish muscle samples were oven dried at 40 ºC for about 2 h and 500 mg of dried sample was refluxed with 20 mL of
nitric acid (65%) at 200 ºC for 2 h. Then, 10 mL of K2S2O8
(5% m/v) was added and the solution was heated for one hour. After complete digestion, it was cooled, filtered, neutralized with sodium hydroxide solution and diluted to 200 mL with deionized water.37 Fifty milliliters of this
solution were analyzed according to the recommended procedure.
Milk samples were analyzed according to the given procedure;38,39 thus, 5 mL of cow milk were treated with
5 mL concentrated nitric acid and 2 mL of 30% hydrogen peroxide and digested on a hot plate at 90 ºC. Then the temperature of mixture was gradually increased to 120 ºC until brown fumes appeared and the organic matrix of milk was oxidized. After cooling, the solution was filtered and the pH was adjusted to approximately 8. The solution was then transferred to a 50 mL flask and diluted to the mark with distilled water. The final solution was treated according to the recommended procedure.
Rice samples were digested according to the given procedure in the literature,40 i.e., the samples were washed
thoroughly with distilled water, grounded and dried. An amount of 0.5 g of the rice sample was weighed and added to a beaker; 10 mL of concentrated HNO3 were added and
the mixture was kept overnight. Then, 2 mL of concentrated HClO4 were added and the solution was evaporated to near
dryness on a heater-stirrer at 130 ºC for about 3 h. The clear solution was neutralized and diluted to 200 mL with distilled water. The pH was adjusted to 8 by the addition of diluted sodium hydroxide solution and was treated according to the recommended procedure.
Results and discussion
Modification of TiO2 nanoparticles with SDS-cadion
are in contact with the solvent and the hydrophobic tails are in the center of spherical nanostructure of micelles. However, when the concentrations of surfactants are slightly below the CMC, ionic surfactant molecules can be adsorbed on the active solid surfaces such as alumina, silica, iron oxides and titania exposed to the solution, forming one layer (hemi-micelles) and two layer (ad-(hemi-micelles) aggregates on these surfaces. Then, hydrophobic compounds can be sorbed into the hydrocarbon cores of these micellar surface aggregates. The sorption of SDS on TiO2 nanoparticles was found
to be highly dependent on the pH of solution. TiO2 NPs
can strongly adsorb negatively charged SDS surfactant
ions at pH below 6 (the isoelectric point of TiO2 NPs)
due to columbic attraction. Thus, when TiO2 NPs were
shaken with acidified solution containing cadion and SDS, the ligand was trapped homogeneously on the hemi-micelles or ad-hemi-micelles formed by SDS on TiO2 NPs and
the color changed from white to yellow. The modified sorbent was then characterized by Fourier transform infrared spectroscopy (FTIR). The IR spectra of TiO2 NPs,
pure cadion and cadion immobilized on sodium dodecyl sulfate-coated TiO2 NPs were recorded using KBr pellets
(Figure 3). Comparison of the IR spectra of bare TiO2 NPs,
cadion and modified TiO2 NPs indicated that modified TiO2
NPs contain the peaks corresponding to TiO2 NPs and some
bands of the cadion (3272 cm-1 of N–H stretching, 1595 cm-1
of N=N, 1478 and 1508 cm-1 of C=C stretching of aromatic
rings, and 1109, 1170 and 1250 cm-1 of N–C stretching).
Some IR bands of SDS (1210 cm-1 of S=O asymmetric
stretching, 1148 cm-1 of S=O symmetric stretching and
2918 cm-1 of aliphatic C–H stretching) are also observed
in modified TiO2 NPs spectrum. Thus, it was shown that
cadion was successfully immobilized onto the surfaces of the SDS-coated TiO2 NPs.
Figure 4 portrays the scanning electron spectroscopy
(SEM) images of the naked TiO2 NPs and cadion
immobilized on the sodium dodecyl sulfate-coated TiO2
NPs. According to SEM images, although the average size of cadion immobilized on sodium dodecyl sulfate-coated TiO2 NPs is increased, it is still in the nano range (about
75 nm).
Effect of variables on sorption and elution of cadmium ions
In order to establish the best conditions for sorption and desorption of cadmium, the influence of various variables such as pH, type, concentration and volume of eluent, sample and eluent flow rates, sample volume, and amount of adsorbent was studied and optimized.
Effect of pH
The reaction between cadmium ions and cadion reagent may be influenced by the pH of the sample solution. Therefore, the effect of the pH on the extraction efficiency of 10 ng Cd from 50 mL of solution was studied by varying the pH of solution in the range of 2.0-12.0. The pH was adjusted by adding either diluted hydrochloric acid or sodium hydroxide solution. As shown in Figure 5, the highest recoveries of Cd were obtained in the pH range 7.0-10.0. At pH greater than 10, recoveries of cadmium extremely decreased probably due to precipitation of cadmium as cadmium hydroxide. On the other hand, the gradual decrease in the recovery of analyte at pH lower than 7 is due to the competition between the proton and cadmium ions for the reaction with the ligand. Therefore, pH 8 was selected for the subsequent studies.
Effect of elution parameters
To ensure the quantitative elution of the cadmium ions from the modified TiO2 NPs, the type, volume and
concentration of the eluent were studied. Two milliliters of different eluents (3 mol L-1) such as hydrochloric
acid, nitric acid, acetic acid and ammonia solution were examined. The results revealed that hydrochloric acid was more effective than the others. The effect of hydrochloric acid concentration was then studied in the range of 0.5 to 3.0 mol L-1. As shown in Figure 6, the recovery of the
analyte increased with an increase in the hydrochloric acid concentration up to 2.5 mol L-1 and then remained constant
at higher concentration. Therefore, subsequent experiments were performed with hydrochloric acid at concentration of 2.5 mol L-1. The influence of the eluent volume on the
desorption of cadmium was also investigated in the range of 0.5-3.0 mL. The results showed that at a volume higher than Figure 4. SEM images of (a) TiO2 NPs and (b) cadion immobilized on
sodium dodecyl sulfate-coated TiO2 NPs.
Figure 5. Effect of pH on the recovery of 10 ng cadmium from 50 mL of sample solution. Conditions: sample flow rate, 4 mL min-1; eluent, 2 mL of 3 mol L-1 HCl; eluent flow rate, 2 mL min-1; amount of sorbent, 80.0 mg.
2 mL, the recovery of analyte was quantitative. Therefore, a volume of 2 mL was selected as the optimum volume of the eluent in further studies.
Effect of sample and eluent flow rates
The effect of the sample and eluent flow rates on the retention and elution of cadmium ions was also studied. The effect of sample flow rate, in the range of 2.0-9.0 mL min-1 was investigated by passing 50.0 mL
of sample solution containing 20 ng of cadmium through the microcolumn with a peristaltic pump. The results showed that the retention of cadmium is relatively fast and independent of flow rate up to 5.0 mL min-1. Therefore,
a sample flow rate of 5.0 mL min-1 was selected for
subsequent studies.
The effect of the eluent flow rate on the desorption of cadmium from the microcolumn was also studied in the range of 2.0-7.0 mL min-1 and it was found that the recovery
remained constant at the flow rates up to 3.0 mL min-1. Thus,
a flow rate of 3.0 mL min-1 was selected for the eluent.
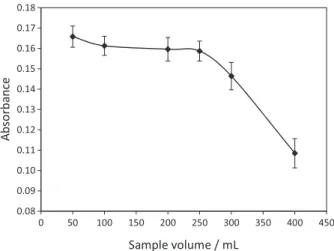
Effect of sample volume
To attain the maximum preconcentration factor, the influence of the sample volume on the recovery of cadmium was studied. An aliquot of 50-400 mL of aqueous solution containing 10 ng of cadmium was passed through the microcolumn under the optimum conditions. The recoveries were found to be quantitative and constant up to 250 mL (Figure 7). Therefore, the breakthrough volume for the method is 250 mL and a maximum preconcentration factor of 125 can be obtained based on consideration of the final eluent volume (2 mL) and the breakthrough volume (250 mL).
Effect of the amount of adsorbent
The amount of adsorbent is an important parameter affecting quantitative recovery. In order to estimate the optimum amount of sorbent, the recoveries of cadmium were investigated by varying the amounts of the modified sorbent from 10.0 to 120.0 mg. The results indicated that the quantitative recoveries of Cd were achieved when the amount of sorbent was greater than 60.0 mg. Therefore, 60 mg of the modified TiO2 NPs were used in subsequent
studies.
Sorbent capacity
The maximum sorption capacity of cadion immobilized
on SDS-coated TiO2 NPs was examined in a batch
experiment. One hundred milligrams of the sorbent were added to 50 mL of the solution containing 0.3 mg of Cd at pH 8 and the mixture was shaken for 30 min. It should be noted that the sorption of analyte to the sorbent increased with time up to 15 min and then levelled off, thus, in order to guarantee the achievement of equilibrium the mixture was shaken for 30 min. After centrifugation of the mixture, the amount of cadmium left in the solution was determined by flame atomic absorption spectrometry. The maximum sorption capacity of the modified TiO2 NPs was
calculated by the difference between the initial and final concentrations of analyte in the solution and was found to be 1590 ± 42 µg g-1. This high capacity suggested high
performance of the microcolumn even in the presence of competing cations.
Interference studies
The interference of common coexisting metal cations and anions on the solid phase extraction and determination of cadmium was investigated under the optimized conditions. For this purpose, 50 mL of solution containing 10 ng of cadmium and various amounts of coexisting ions were analyzed according to the recommended procedure. A relative error of less than 5% in the determination of cadmium was considered to be within the range of experimental error. As shown in Table 2, even at the presence of high concentration of foreign ions, the cadmium ions in binary mixtures were quantitatively retained on the modified TiO2 NPs. Thus, the proposed method is selective
for the determination of the analyte.
Analytical performance
Under the optimum conditions, for a sample volume of 200 mL, the calibration graph exhibited linearity over the Figure 7. Effect of sample volume on the recovery of cadmium.
range of 0.005-0.180 µg L-1 of cadmium. The equation of
the calibration graph was A = 2.7771C + 0.0245 (where A is the absorbance and C is the concentration of cadmium in µg L-1) with a correlation coefficient (r2) of 0.9990.
The limit of detection (LOD), defined as 3Sb / m (where
Sb is standard deviation of 5 replicate measurements of
the blank and m is the slope of the calibration graph) was 1.3 ng L-1. The precision of the method was evaluated
by passing 200 mL of solution containing cadmium through the microcolumn and repeating this procedure eight times. The relative standard deviation (RSD%) for eight replicate measurements of 50 ng L-1 cadmium was
3.6%. The enhancement factor of 98.1 was obtained from the ratio between the slopes of the calibration graphs constructed with the preconcentrated samples and the ones not submitted to the preconcentration step. The closeness of the enhancement factor (98.1) to the preconcentration factor (100) further indicates the quantitative retention and elution of analyte by the sorbent. A single microcolumn was used up to 9 times in different days without a significant loss in its performance.
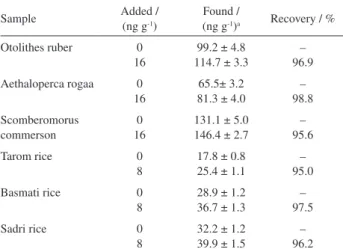
Application
The proposed method was applied to the determination of cadmium in well water, river water (taken from Karoon River) and seawater (taken from the Persian Gulf), cow milk, fish and rice samples. In order to validate the method, the recovery experiments were carried out by spiking the samples with a known amount of cadmium before treatment. The results are summarized in Tables 3 and 4. The recoveries are in the range of 95.0-98.8%, and indicate the applicability of the method for the determination of cadmium in different real samples. Furthermore, the accuracy of milk analysis was checked by independent analysis using electrothermal atomic absorption spectrometry. The results were found to be 473 ± 10 and 560 ± 12 for low fat and high fat milk, respectively, which is in agreement with the results obtained by the given procedure.
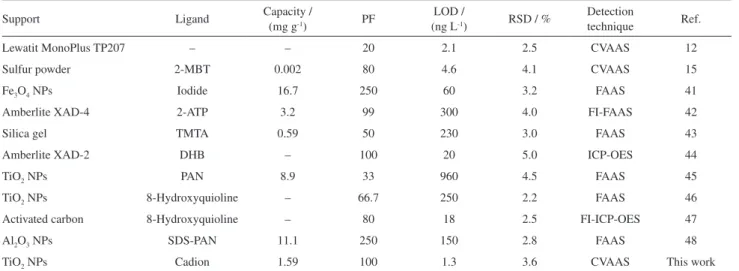
Comparison with other SPE methods
The figures of merit of the presented method were compared with some of the previously reported solid phase extraction methods for the separation and determination of cadmium and the results are shown in Table 5. As it can be seen, the preconcentration factor (PF) of the proposed method is larger than the other CVAAS techniques and the detection limit is better than the other SPE methods.
Conclusions
Cadion immobilized on sodium dodecyl sulfate-coated TiO2 NPs has been successfully applied as a novel sorbent
for the separation and preconcentration of ultratrace levels of cadmium prior to its determination by cold vapor atomic absorption spectrometry. The method is simple, convenient, inexpensive and environmentally friendly. The Table 2. Tolerance limits of foreign ions on the solid phase extraction
and determination of 10 ng of cadmium from 50 mL sample solution
Foreign iona Mole ratio
(ion / Cd2+)
Ca2+, K+, Na+, Mg2+, Cl–, NO
3–, F–, SO42– 5000 Pb2+, Zn2+, Co2+, Mn2+, Bi3+, Sb3+ 1000
Cr3+, Ni2+, Cu2+, Ag+, Fe3+, Sn2+, Se4+, Hg2+ 800
aAll cations were as their nitrate salts and all anions were as their sodium salts.
Table 3. Determination of Cd ions in water and cow milk samples
Sample Added /
(ng L-1)
Found /
(ng L-1)a Recovery / %
Well water 0
20
69.7 ± 2.0 89.2 ± 3.7
– 97.5
Sea water 0
20
144.1 ± 4.5 163.5 ± 4.1
– 97.0
River water 0 20
97.9 ± 4.3 117.6 ± 2.6
– 98.5 Pasteurized milk (low fat) 0 50
470.3 ± 18.5 518.8 ± 25.2
– 97.0 Pasteurized milk (high fat) 0 50
565.0 ± 24.5 614.2 ± 23.3
– 98.4
aMean and standard deviation related to three determinations.
Table 4. Determination of Cd ions in rice and fish samples
Sample Added /
(ng g-1)
Found /
(ng g-1)a Recovery / %
Otolithes ruber 0 16
99.2 ± 4.8 114.7 ± 3.3
– 96.9
Aethaloperca rogaa 0 16
65.5± 3.2 81.3 ± 4.0
– 98.8 Scomberomorus commerson 0 16
131.1 ± 5.0 146.4 ± 2.7
– 95.6
Tarom rice 0
8
17.8 ± 0.8 25.4 ± 1.1
– 95.0
Basmati rice 0 8
28.9 ± 1.2 36.7 ± 1.3
– 97.5
Sadri rice 0
8
32.2 ± 1.2 39.9 ± 1.5
– 96.2
Table 5. Comparison of this work with some reported SPE methods for preconcentration and determination of cadmium
Support Ligand Capacity /
(mg g-1) PF
LOD /
(ng L-1) RSD / %
Detection
technique Ref.
Lewatit MonoPlus TP207 – – 20 2.1 2.5 CVAAS 12
Sulfur powder 2-MBT 0.002 80 4.6 4.1 CVAAS 15
Fe3O4 NPs Iodide 16.7 250 60 3.2 FAAS 41
Amberlite XAD-4 2-ATP 3.2 99 300 4.0 FI-FAAS 42
Silica gel TMTA 0.59 50 230 3.0 FAAS 43
Amberlite XAD-2 DHB – 100 20 5.0 ICP-OES 44
TiO2 NPs PAN 8.9 33 960 4.5 FAAS 45
TiO2 NPs 8-Hydroxyquioline – 66.7 250 2.2 FAAS 46
Activated carbon 8-Hydroxyquioline – 80 18 2.5 FI-ICP-OES 47
Al2O3 NPs SDS-PAN 11.1 250 150 2.8 FAAS 48
TiO2 NPs Cadion 1.59 100 1.3 3.6 CVAAS This work
PF: preconcentration factor; LOD: limit of detection; RSD: relative standard deviation; 2-MBT: 2-mercaptobenzothiazole; 2-ATP: 2-aminothiophenol; TMTA: 2,4,6-trimorpholino-1,3,5-triazin; DHB: dihydroxybenzoic acid; PAN: 1-(2-pyridylazo)2-naphthol; SDS: sodium dodecyl sulfate; CVAAS: cold vapor atomic absorption spectrometry; FAAS: flame atomic absorption spectrometry; ICP-OES: inductively coupled plasma optical emission spectrometry; FI-ICP-OES: flow injection inductively coupled plasma optical emission spectrometry.
method has good sensitivity, high selectivity and relative high preconcentration factor. The proposed method allows determination of cadmium in different real samples with good accuracy and reproducibility.
References
1. Silva, R. L.; Roldan, P. S; Gine, M. F.; J. Hazard. Mater. 2009, 171, 1133.
2. Liu, Y.; Chang, X.; Wang, S.; Guo, Y.; Din, B.; Meng, S.; Anal. Chim. Acta 2004, 519, 173.
3. Ciftci, H.; Desalination 2010, 263, 18.
4. Haji Shabani, A. M.; Dadfarnia, S.; Motavaselian, F.; Ahmadi, S. H.; J. Hazard. Mater. 2009, 162, 373.
5. Borges, D. L. G.; Dias, L. F.; da Veiga, M. A. M. S.; Curtius, A. J.; J. Braz. Chem. Soc. 2003, 14, 291.
6. Mikula, B.; Puzio, B.; Talanta 2007, 71, 136. 7. Dong, Y.; Gai, K.; J. Braz. Chem. Soc. 2006, 17, 135. 8. Lavi, N.; Alfassi, Z. B.; Analyst 1990, 115, 817.
9. Muñoz, C.; Zúñiga, M.; Arancibia, V.; J. Braz. Chem. Soc. 2010, 21, 1688.
10. Cesarino, I.; Marino, G.; Matos, J. R.; Cavalheiro, T. G.; J. Braz. Chem. Soc. 2007, 18, 810.
11. Lampugnani, L.; Savetti, C.; Tsaleve, D.; Talanta 2003, 61, 683.
12. Şahan, S.; Şahin, U.; Talanta, 2012, 88, 701.
13. Ritschdorff, E. T.; Fitzgerald, N.; Mclaughlin, R. L. G.; Brindle, I. D.; Spectrochim. Acta, Part B 2005, 60, 139.
14. Bortoleto, G. G.; Macarovscha, G. T.; Cadore, S.; J. Braz. Chem. Soc. 2004, 15, 313.
15. Pourreza, N.; Ghanemi, K.; J. Hazard. Mater. 2010, 178, 566.
16. Prasad, K.; Gopikrishna, P.; Kala, R.; Rao, T. P.; Naidu, G. R. K.; Talanta 2006, 69, 938.
17. Dadfarnia, S.; Haji Shabani, A. M.; Kamranzadeh, E.; J. Braz. Chem. Soc. 2010, 21, 2353.
18. Andrade, F. P.; Nascentes, C. C.; Costa, L. M.; J. Braz. Chem. Soc. 2009, 20, 1460.
19. Amorim, F. A. C.; Ferreira, S. L. C.; Talanta 2005, 65, 960. 20. Bamdad, F.; Ardalani, M.; Sangi, M. R.; J. Braz. Chem. Soc.
2014, 25, 246.
21. Zhang, J.-W.; Wang, Y.-K.; Du, X.; Lei, X.; Ma, J.-J.; Li, J.-C.; J. Braz. Chem. Soc. 2011, 22, 446.
22. Fan, Z.; Hu, B.; Jiang, Z.; Spectrochim. Acta, Part B 2005, 60, 65.
23. Duran, C.; Gundogdu, A.; Bulut, V. N.; Soylak, M.; Elci, L.; Sentürk, H. B.; Tüfekci, M.; J. Hazard. Mater. 2007, 146, 347. 24. Asadoulahi, T.; Dadfarnia, S.; Haji Shabani, A. M.; J. Braz.
Chem. Soc. 2007, 18, 1353.
25. Ghaedi, M.; Shokrollahi, A.; Kianfar, A. H.; Mirsadeghi, A. S.; Pourfarokhi, A.; Soylak, M.; J. Hazard. Mater. 2008, 154, 128. 26. Vassileva, E.; Hadjiivanov, K.; Stoychev, T.; Daiev, C.; Analyst
2000, 125, 693.
27. Farag, A. B.; Soliman, M. H.; Abdel-Rasoul, O. S.; El-Shahawi, M. S.; Anal. Chim. Acta 2007, 601, 218.
28. Afkhami, A.; Saber-Tehrani, M.; Bagheri, H.; Madrakian, T.; Microchim. Acta 2011, 172, 125.
29. Zhang, S.; Niu, H.; Hu, Z.; Cai, Y.; Shi, Y.; J. Chromatogr. A 2010, 1217, 4757.
30. Recillas, S.; Colón, J.; Casals, E.; González, E.; Puntes, V.; Sánchez, A.; Font, X.; J. Hazard. Mater. 2010, 184, 425. 31. Shakerian, F.; Dadfarnia, S.; Haji Shabani, A. M.; Shiralian
32. Lian, N.; Chang, X.; Zheng, H.; Wang, S.; Cui, Y.; Zhai, Y.; Microchim. Acta 2005, 151, 81.
33. Kaur, A.; Gupta, U.; J. Mater. Chem. 2009, 19, 8279. 34. Yang, L.; Hu, B.; Jiang, Z.; Pan, H.; Microchim. Acta 2004,
144, 227.
35. Baghban, N.; Haji Shabani, A. M.; Dadfarnia, S.; Int. J. Environ. Anal. Chem. 2013, 93, 1367.
36. Hayashibe, Y.; Sayama, Y.; Analyst 1996, 121, 7.
37. Pourreza, N.; Ghanemi, K.; J. Hazard. Mater. 2010, 178, 566. 38. Elatrash, S.; Atoweir, N.; Int. J. Chem. Sci. 2014, 12, 92. 39. Peters, J. B.; Recommended Methods of Manure Analysis;
Cooperative Extension Publishing: Madison, 2003.
40. Oymak, T.; Tokalıoğlu, Ş.; Yılmaz, V.; Kartal, Ş.; Aydın, D.; Food Chem. 2009, 113, 1314.
41. Baghban, N.; Haji Shabani, A. M.; Dadfarnia, S.; Chin. J. Anal. Chem. 2012, 59, 782.
42. Lemos, V. A.; Novaes, C. G.; Lima, A. S.; Vieira, D. R.; J. Hazard. Mater. 2008, 155, 128.
43. Madrakian, T.; Zolfigol, M. A.; Solgi, M.; J. Hazard. Mater. 2008, 160, 468.
44. Bezerra, M. A.; Santos, W. N. L.; Lemos, V. A.; Korn, M. G. A.; Ferreira, S. L. C.; J. Hazard. Mater. 2007, 148, 334.
45. Manzoori, J. L.; Amjadi, M.; Hallaj, T.; Int. J. Environ. Anal. Chem. 2009, 89, 749.
46. Zhou, Q. X.; Zhao, X. N.; Xiao, J. P.; Talanta 2009, 77, 1774. 47. Cerutti, S.; Silva, M. F.; Gasquez, J. A.; Olsina, R. A.; Martinez,
L. D.; Spectrochim. Acta, Part B 2003, 58, 43.
48. Ezoddin, M.; Shemirani, F.; Abdi, K.; Saghezchi, M. K.; Jamali, M. R.; J. Hazard. Mater. 2010, 178, 900.
Submitted: June 1, 2014