1
1. Background
T h e f u e l c e l l, a n e l e c t r o c h e m i c a l device that generates electricity, is often referred to as “green power generators” and is rapidly becoming a globally high-potential industry. Many countries focus their policies on developing relevant technologies, and promoting the investment and education. With significant public- and private-sector resource investment, production of the fuel cell has increased nearly 20-fold in the past five years (Fuel Cell Today, 2011). Taiwanese government
1 Department of Library and Information Science, National Taiwan University, Taipei, Taiwan 2 Archives Service Division, National Archives Administration, Taipei, Taiwan
* Corresponding Author: Mu-Hsuan Huang, Email: [email protected]
A Scientometric Study of Fuel Cell Based on Paper and
Patent Analysis
Mu-Hsuan Huang
1, Hsiao-Wen Yang
2Abstract
The study utilizes bibliometrics to explore papers and patents in the field of fuel cell to examine the scientific and technical development in the area. The research data were retrieved from the WOS database and USPTO patent data from the period between 1991 and 2010, which consists of 20,758 papers and 8,112 patents. The authors analyzed numbers of papers and patents to examine the trends in the papers and patents in different countries, organizations and individuals. The results indicate upward growth in both papers and patents in fuel cell, with a higher growth rate for papers. The study shows that major paper and patent output are concentrated in a small number of countries. An imbalance exists between the number of papers published and the patents granted in organizations. The organizations that published papers and patents vary in type and category. Very few individual researchers are able to produce high numbers of both papers and patents.
Keywords: Bibliometric; Fuel Cell; Patent; Paper
has identified fuel cell as a key development area for energy industries, despite its small size, dense population, and limited natural resources (Bureau of Energy, Ministry of Economic Affairs, 2012). Facing severe international competition on the development of fuel-cell-related technologies, Taiwan needs to be more updated with current research environment to enhance its advantages.
Bibliometric analysis is a commonly used quantitative research method for evaluating scientific and technological literature in
2
different countries (Glänzel & Meyer, 2003; Meyer, 2002; Narin, 1994). The basis of the approach is built on the assumption that papers and patents are the main results of the science and technology research. Therefore, the analysis of papers or patents through mathematical and statistical calculations can offer a useful insight into the quantity, growth pattern, distribution, and the nature of authors/inventors. Likewise, the analysis is also instrumental in understanding different degrees of productivity a n d d i s t r i b u t i o n f r o m a n i n d i v i d u a l, organizational, scientific field, or national perspective. The patterns and development trends obtained from the analysis can also provide valuable information to forecast future development (Anderson, Williams, Seemungal, Narin, & Olivastro, 1996; Narin, 1994).Using bibliometrics to compile and analyze data on papers and patents of same area simultaneously can provide a better prediction of the future development. However, most fuel-cell-related bibliometrics studies concentrate on papers or patents separately, such as studies by Rabeharisoa (1992), Barrett (2005), and Verspagen (2007). There are very few studies that target both papers and patents for analysis, and most are focused on one single country. For example, Klitkou, Nygaard, and Meyer (2007) analyzed the academic papers and patents published by academic research institutions and
industrial organizations in Norway from 1990 to 2002 to explore output performance. Also, Rabeharisoa (1992) compiled and analyzed patents applied for in France between 1960 and 1987 and the academic papers published by these patent inventors to construct an exchange network between the technical and scientific aspects of the research. In Taiwan, most studies on the fuel cell have focused on patent analysis. Chen (2010) looked into papers and patents in the fuel cell field from 1965 to 2008 with bibliometric analysis, focusing on testing the growth patterns of the literature and the identification of main authors/inventors of the papers/patents.
With an aim to understand the output of both papers and patents in the fuel cell field and to further test the related research results, this study compiles and analyzes the related papers and patents between 1991 and 2010 to identify scientific and technical development trends in fuel cell. In addition, the study further moves to understand the distribution, development patterns, main sources and relations from the perspective of countries, organizations and individuals. By evaluating the development o f f u e l c e l l t e c h n o l o g i e s f r o m s e v e r a l perspectives, the findings obtained from this study can be used as points of reference in the formation of strategies to promote relevant technological development.
3
2. Methodology
B i b l i o m e t r i c s w a s s e l e c t e d a s t h e research method for this study to better understand the outputs and unique features of the field. Research subject and method are detailed below:
2.1 Objects of study
The data used for this study include invention patents provided by the Patent Full-Text and Image Database (PatFT) of the U.S. Patent and Trademark Office (USPTO), papers from Science Citation Index (SCI) and Social Sciences Citation Index (SSCI) sub-databases of ISI’s Web of Science (WOS) database.
A large number of overseas corporations have been elected to apply for patents in the States for its large market and advanced key technologies development. Consequently, US patents can be viewed as a microcosm of global technological development. With this in mind, the USPTO patent database was selected as the source of patent data. Paper data were retrieved from WOS database, which encompasses a large number of academic periodicals. We used names of different types of fuel cell as key words (Appendix table) to search for each database. The collection of data retrieved consists of 20,758 papers and 8,112 patents related to fuel cell between 1991 and 2010.
2.2 Research methods
This study aims to explore papers and patents in fuel cell through bibliometrics analysis. To ensure valid results, authority control is first taken upon retrieving the bibliometric data from the database and prior to further compilation. For all retrieved data of papers and patents, this study conform various names for each institutions by cross-checking its official website and related acquisition information provided by Fuel Cell Today, Bloomberg Businessweek, PatentBuddy.com, European Research Ranking and the Energy Citations Database built by the U.S. Department of Energy. Also, this study built authority controls records for names of individuals and institutions to avoid mistakes of spelling or abbreviations.
Next, the data is grouped into two separate files – papers and patents with relevant information. The papers file includes title, publication date, journal title, author, organization and nationality, etc. The patents file includes patent number, patent name, file date, patent date, name of inventor, assignees and nationality, IPC number, USPC number, etc.
Upon the compilation of all the relevant papers and patents, output numbers by country, organization and individual are then obtained. The output is counted by the nation for paper
4
authors’ organizations and patent assignees in the country. If co-authors or co-assignees belong to different organizations with different nation, each country will be counted once. The following indices are applied to find the distribution and correlational between the outputs:(1) The percentage of papers or patents by individual country is calculated to obtain the Herfindahl-Hirschman Index (HHI) of countries and to measure the concentration of countries’ paper or patent outputs. The HHI was originally a measure of the size of firms in relation to the industry and an indicator of the amount of competition among them (Evans, 2008; Huang, Tang, & Chen, 2011; Larivière, Gingras, & Archambault, 2009). The calculation equation is:
HHI=
HHI is computed as where Si is the market share of country i, and N is the number of countries. The HHI ranges from 0 to 1. If HHI below 0.15 indicates the market is competitive and there is no dominator in it. The HHI between 0.15 and 0.25 indicates a moderately competitive market, and if HHI higher than 0.25 indicates a high concentrated or monopolistic market, There is one or more dominators in this market (U.S. Department of Justice and the Federal Trade Commission, 2010).
(2) Using the number of papers and patents produced by organizations, the paper-patent ratio is calculated to compare the gap between the paper and patent outputs in one organization. When the ratio is closer to 1, the outputs of paper and patent in one organization are more balanced. The equation is as follows:
Paper - Patent Ratio =
3. Results and Discussion
This study analyzes the scientific and technological development of fuel cell to observe the overall distribution of number of papers and of patents based on 20,758 papers and 8,112 patents on the topic. Further, the study compares the output of papers and patents by individual countries, organizations and individuals to determine the main sources of science and technical development.
3.1 Overall output of papers and patents on fuel cells
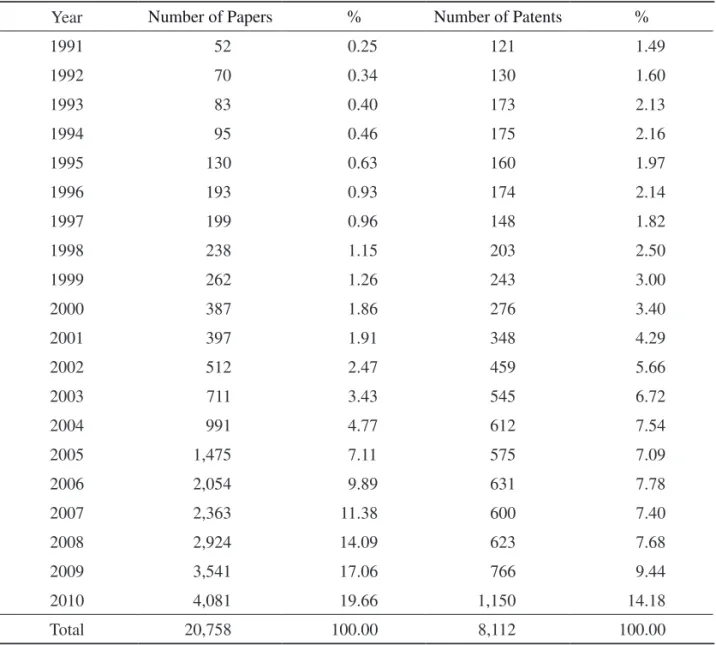
Data compiled in this study are yearly paper and patent output as shown in Table 1. The total number of papers on fuel cell from 1991 to 2010 is 20,758, about 2.56 times larger than the number of patents in this period, 8,112.
"the one with higher paper number or patent number in the organization" "the one with lower paper number or
patent number in the organization"
5
As shown in Table 1, there are 20,758 papers collected during the period 1991 to 2010 in the field of fuel cell, roughly 2.56 times of that of patents collected. The annual output of patents collected is higher than that of papers during 1991 to 1995. From 1996 to 2002, the annual output of patents started to lag behind the output of papers. Prior to 2003, the difference between numbers of papers and patents remained relatively low, but since 2003, the number of papers has drastically increased each year, widening the gap between papers and patents. From 2007 to 2010, the number of papers accounted for more than 10% of the total papers annually and increased significantly every year. In contrast, the number of the fuel cell patents remained stagnate from 2004 to 2008 until in 2009 when the number started to increase more visibly.Although the increasing patterns of the output of fuel cell papers and patents are not consistent, both outputs have grown rapidly from 2009 to 2010. Paper began to experience faster growth trend in comparison with that of patents since 2003 (Figure 1).
3.2 The output of papers and patents by country
3.2.1 Number of papers by country
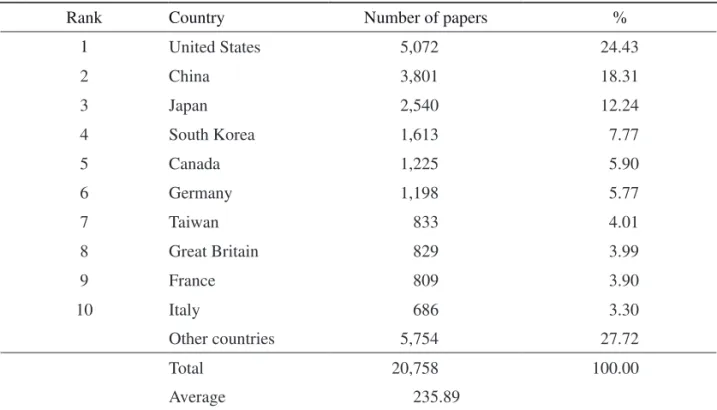
The papers on fuel cells are published by authors from 88 countries. A comparison of the
number of papers published by each of the top ten countries is shown in Table 2. The United States published the highest number of papers. Top 3 countries, the United States, China and Japan, published in total of 11,413 papers, accounting for more than half of the total papers. The total number of papers published from the remaining countries is 5,754, only 3.29% greater than that of United States alone. The table shows that there is a large gap exists between the top three countries and the rest.
Figure 2 shows that the number of papers has increased from 2003, particularly in China and South Korea, which rank second and fourth respectively. China’s publication of papers surpassed Japan’s in 2005, and the discrepancy between China and Japan has widened since. By 2009, the number of papers from China exceeded that of papers from the United States for the first time. Number of papers published in South Korea has nearly surpassed that of Japan’s since 2008. This reflects South Korea’s increasing effort in scientific research in fuel cell. Taiwan ranks eighth with 833 papers published, which accounts for 3.4% of the total number of papers. The number of papers published in Taiwan is slightly higher than the numbers that of by Great Britain, France and Italy. The number of fuel cell papers published in Taiwan has grown, although there has shown a decreasing rate of growth.
6
Table 1. Number of Papers and Patents in 1991-2010
Year Number of Papers % Number of Patents %
1991 52 0.25 121 1.49
1992 70 0.34 130 1.60
1993 83 0.40 173 2.13
1994 95 0.46 175 2.16
1995 130 0.63 160 1.97
1996 193 0.93 174 2.14
1997 199 0.96 148 1.82
1998 238 1.15 203 2.50
1999 262 1.26 243 3.00
2000 387 1.86 276 3.40
2001 397 1.91 348 4.29
2002 512 2.47 459 5.66
2003 711 3.43 545 6.72
2004 991 4.77 612 7.54
2005 1,475 7.11 575 7.09
2006 2,054 9.89 631 7.78
2007 2,363 11.38 600 7.40
2008 2,924 14.09 623 7.68
2009 3,541 17.06 766 9.44
2010 4,081 19.66 1,150 14.18
Total 20,758 100.00 8,112 100.00
3.2.2 Number of patents by country
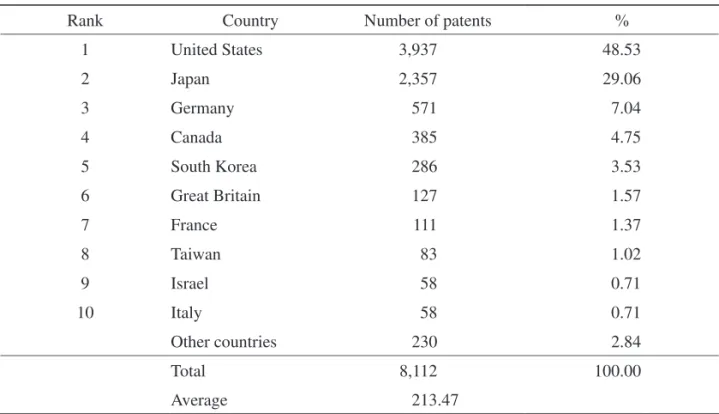
The 8,112 total patents were produced by inventors from 38 countries. Table 3 lists the top ten countries with the highest number of patents. The United States and Japan are the top two countries with highest numbers of patents, holding 77.59 % of the total patents (77.59%). The total number of patents from the countries
ranking from third to tenth is less than half that of the United States. The 28 remaining countries have produced only 230 patents in total. Table 3 shows that fuel cell patents are still dominated by the United States and Japan, and that patents by these two exceed patents by other countries by a very large margin.
7
Figure 1. Distribution of Papers and Patents from 1991-2010
Table 2. Top 10 Countries of Paper Publications (1991-2010)
Rank Country Number of papers %
1 United States 5,072 24.43
2 China 3,801 18.31
3 Japan 2,540 12.24
4 South Korea 1,613 7.77
5 Canada 1,225 5.90
6 Germany 1,198 5.77
7 Taiwan 833 4.01
8 Great Britain 829 3.99
9 France 809 3.90
10 Italy 686 3.30
Other countries 5,754 27.72
Total 20,758 100.00
Average 235.89
8
Figure 2. Distribution of Papers of Top 10 Countries from 1991-2010
Table 3. Top 10 Countries of Patent Publications (1991-2010)
Rank Country Number of patents %
1 United States 3,937 48.53
2 Japan 2,357 29.06
3 Germany 571 7.04
4 Canada 385 4.75
5 South Korea 286 3.53
6 Great Britain 127 1.57
7 France 111 1.37
8 Taiwan 83 1.02
9 Israel 58 0.71
10 Italy 58 0.71
Other countries 230 2.84
Total 8,112 100.00
Average 213.47
圖資11-2.indb 8
9
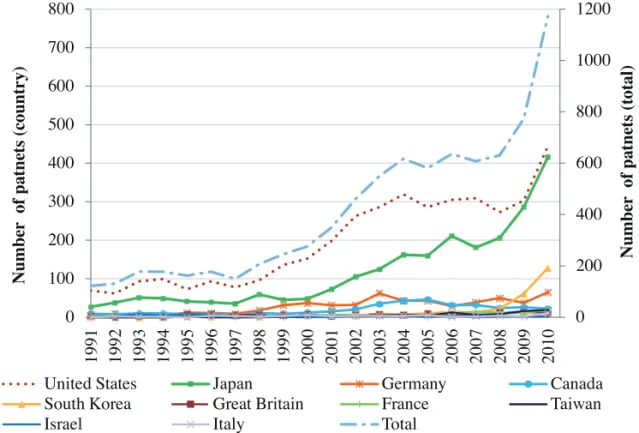
The year-by-year distribution of number of patents by the top ten countries is shown in Figure 3. We can see that all of the countries except for the United States and Japan have produced fewer than 50 patents each year. Hence, United States and Japan have largely influenced the overall distribution. The number of patents obtained by Japan began to increase from 2001 and eventually surpassed the United States in 2009. The steady rise in the number of patents shows Japan’s strength in technological development fuel cell. Similarly, South Korea, which ranks fifth in patent output, showed rapid growth from 2008 to 2010, going from 22 patents to 128 patents– a nearly six foldgrowth that indicates South Korea’s strong drive in developing fuel cell technologies. Taiwan‘s number of patents is far below the overall average of 213, but has increased at a greater rate from 2009 to 2010, with 83 patents and ranks the eighth.
3.2.3 C o m p a r i s o n o f p a p e r a n d p a t e n t
output by country
To further compare and evaluate different countries’ technical output in fuel cell, this study cross-analyzes the 88 countries with papers on fuel cell and the 38 countries with fuel cell patents. The 33 countries with both paper and patent outputs are identified for correlation analysis on their numbers of papers
Figure 3. Distribution of Patents of Top 10 Countries in 1991-2010
圖資11-2.indb 9
10
and patents and on rankings by papers and patents. At a significant level (p<0.01), thePearson correlation coefficient of the number of papers and patents by the 33 countries is 0.793, showing high correlation that exists between number of papers and number of patents in each country. This means the countries with a high number of papers tend to have high numbers of patents, and vice versa.
Closer observation on the rankings of the top ten countries by papers and patents, as in Table 4, shows that China, which ranks second in number of papers, has produced only 16 patents, which ranks the 15th . Similarly, Israel, which ranks ninth in patent, ranks no
higher than 30th in paper publication. Beside these two countries, nine other countries – the United States, Japan, South Korea, Canada, Germany, Taiwan, Great Britain, France and Italy – are in the top ten in both paper and patent publication. This is consistent with the above analysis: the number of papers on fuel cells is highly correlated to the number of patents in fuel cell.
The HHI is calculated with the attempt to determine whether there has been monopoly or over-dominance paper and patent output in the field of fuel cell. From our study, the HHI for the 88 countries that produce papers on fuel cell is 0.13, meaning the market is competitive;
Table 4. Top 10 Countries in Paper and Patent Publications (1991-2010)
Rank of papers Country Number of papers Number of patents Rank of patents
1 United States * 5,072 3,937 1
2 China 3,801 16 15
3 Japan * 2,540 2,357 2
4 South Korea * 1,613 286 5
5 Canada* 1,225 385 4
6 Germany * 1,198 571 3
7 Taiwan* 833 83 8
8 Great Britain * 829 127 6
9 France * 809 111 7
10 Italy * 686 58 9
32 Israel 75 58 9
- Other countries 5,754 230
-- Total 20,758 8,112
-Note. *Top ten countries with highest numbers of both papers and patents.
11
but the HHI for the 38 countries which produce fuel cell patents is 0.33, indicating a highly concentrated market. Considering the data on patents for this study was obtained from the USPTO’s PatFT database, the United States has relative advantage in this study. Therefore, a separate HHI calculation was conducted for patents excluding the United States. The resulting HHI value of 0.35 means even without the patents published by the United States, those of the other countries a r e s t i l l h i g h l y c o n c e n t r a t e d. A n a l y s i s above indicates that the development and publication of fuel cell patents are dominated by a small number of countries.3.3 The publication of papers and patents by organizations
The organizations authors work for and the organizational assignees of patents are first identified. These organizations are then categorized into two types, academic and industry, followed by the calculation of papers and patents by organizations.
3.3.1 Distribution and correlation of number
of papers and patents by organizations
Our compilation shows that the 20,758 papers used for this study are produced by 3,213 organizations, with an average of 6.46 papers per organization. 8,112 patents are produced by 1,109 organizations, with an average of 7.14 patents per organization.
In order to find the distribution of the outputs by organizations which produce papers and patents on fuel cell, these organizations were classified by their paper and patent productivity as being in the top 1%, top 2-5%, top 6-20%, or the remaining 80%. Next, analysis is conducted in accordance with each categories’ percentage of total papers and percentage of total patents. Table 5 shows that more than 80% of both papers and patents were published by organizations in the top 20% by paper or patent production. More than 30% of the total patents were produced by the top 1% of organizations. Also in Figure 4 shows that a small number of organizations are with high production rates dominate the majority
Table 5. Concentration of Publication of Papers and Patents from Organizations
Productivity Number of paper organizations Number of papers* total papers% of Number of patent organizations Number of patents* Total patents% of
Top 1% 32 6,964 21.88 11 2,637 31.63
Top 2%-5% 129 8,960 28.15 44 2,061 24.72
Top 6%-20% 482 9,546 29.99 167 1,999 23.97
Bottom 80% 2,572 6,357 19.97 887 1,641 19.68
Note. *For co-authored or co-assignee works, each organization is credited with one publication.
12
of technical output. Their productivities approximately follow 80/ 20 rule (Egghe, 1986; Trueswell, 1969).To explore the relationship between number of papers and number of patents by organizations, a correlation analysis is conducted on the 325 organizations which produced the papers or patents. The Pearson correlation coefficient was 0.0333, revealing a very low degree of correlation between the two, also below a significant level (p>.05). The analysis shows that organizations’ paper output may not be directly proportional to their patent output, and vice versa.
3.3.2 Publication of papers and patents by
major organizations
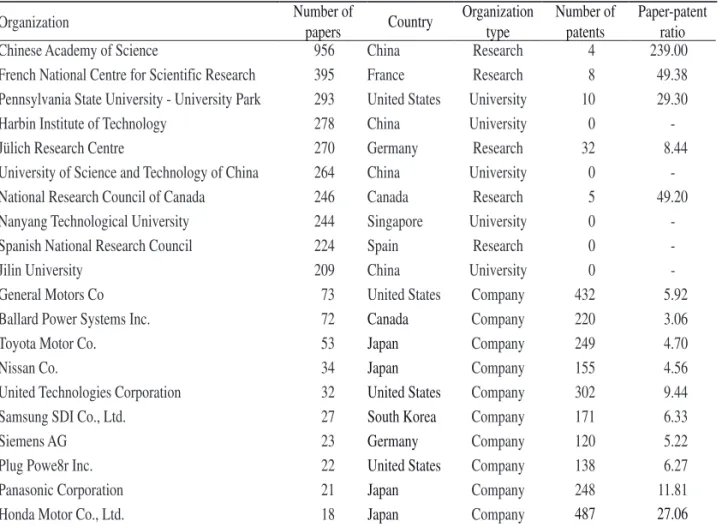
To further explore the major organizations with high numbers of paper and patent publications, our study identifies both the top 10 paper and patent productivity organizations, and ranks these 20 organizations in table 6 by their paper numbers with patent numbers to analyze the correlation between paper and patent outputs.
Table 6 shows that most of the top 10 paper productivity organizations are academic organizations; four of them are based in China, among which Chinese Academy of Science leads with 956 papers. Interestingly, among Figure 4. The Relationship Between Organizations’ Productivity and Their Production
of Papers and Patents
13
the ten organizations, half of them have not published any patents; furthermore, even the half of these organizations which have published patents have only small number of patents and rank within the top 100. The only exception is Jülich Research Centre in Germany.Table 6 also shows that the top 10 patent productivity organizations are mostly from industry institutions. By industry type, the majority of these organizations are from the
automobile industry, including firms such as Honda, General Motors, Toyota, and Nissan; electrical industry including Panasonic, Samsung, and Siemens. The list shows that these industries are the major players in the technical development of fuel cell. Another organization is Ballard Power Systems, which ranks sixth. This is the largest company in Canada which develops fuel cell. All of the 10 organizations with the highest number of Table 6. Top 10 Productivity Organizations of Papers and Patents (1991-2010)*
Organization Number of papers Country Organization type Number of patents Paper-patent ratio
Chinese Academy of Science 956 China Research 4 239.00
French National Centre for Scientific Research 395 France Research 8 49.38 Pennsylvania State University - University Park 293 United States University 10 29.30 Harbin Institute of Technology 278 China University 0
-Jülich Research Centre 270 Germany Research 32 8.44
University of Science and Technology of China 264 China University 0 -National Research Council of Canada 246 Canada Research 5 49.20 Nanyang Technological University 244 Singapore University 0 -Spanish National Research Council 224 Spain Research 0
-Jilin University 209 China University 0
-General Motors Co 73 United States Company 432 5.92
Ballard Power Systems Inc. 72 Canada Company 220 3.06
Toyota Motor Co. 53 Japan Company 249 4.70
Nissan Co. 34 Japan Company 155 4.56
United Technologies Corporation 32 United States Company 302 9.44
Samsung SDI Co., Ltd. 27 South Korea Company 171 6.33
Siemens AG 23 Germany Company 120 5.22
Plug Powe8r Inc. 22 United States Company 138 6.27
Panasonic Corporation 21 Japan Company 248 11.81
Honda Motor Co., Ltd. 18 Japan Company 487 27.06
Note. *All the organizations are ranged by paper productivity. The first 10 are the top 10 in paper
productivity and the latter 10 are the top 10 in patent productivity.
14
patents also have produced papers, but their rankings for papers also lag behind the top 80, reaching as far down as 382nd.In general, the majority of organizations with the highest numbers of papers or patents are based in countries with the highest numbers of papers and patents. Cases in point include the United States, China, Japan, Germany, Canada and South Korea. This pattern reflects the status of the United States, Japan, South Korea and the leading powers in Europe as major players in both scientific research and technological development in regards to fuel cell.
If we take a closer look at the comparison of organizations granted with papers and patents, the paper-patent ratio for the Chinese Academy of Science is 239, the highest on the list, while the lowest ratio for Ballard Power Systems is 3.06. This shows that a wide gap existing among these organizations’ paper and patent outputs. Also, the organizations with high number of papers and those with high number of patents are not directly correlated.
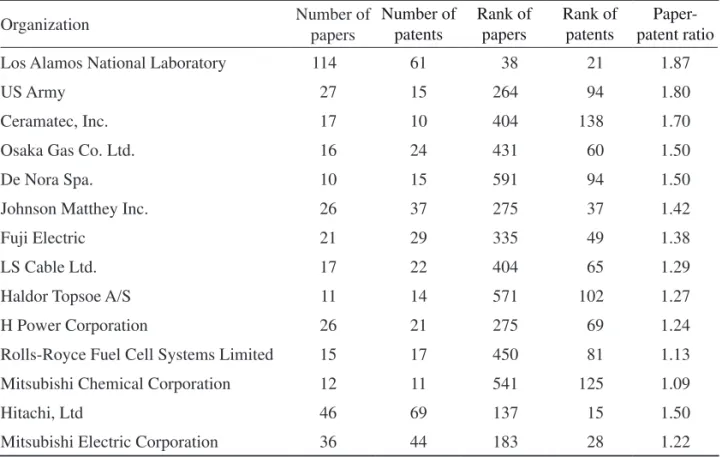
Among the 325 organizations mentioned above in publication of papers and patents, there are 25 organizations with the ratio of paper-patent equal to 1, having similar outputs in both papers and patents. However, most of the organizations have only produced 1 paper, and the highest number is 4. Similarly, among those 69 organizations with paper-patent ratios
ranged between 1-2, there are 14 organizations with more than 10 papers and patents, as shown in Table 7, the paper output of which mostly fall under 50 with patent output of less than 40. Thus it is clear that the output numbers of organizations with equal outputs of papers and patents are low.
The analysis of organizations with papers and patents finds that very few organizations can have high output numbers in both papers and patents. The only exceptions here are Germany’s Jülich Research Centre, listed in Table 6, and the United States’ Los Alamos National Laboratory from Table 7. These two are the only ones listed in both the top 50 lists of organizations’ paper output and patent output. On the contrary, the output number of organizations with balanced output of paper and patents tend to be on the low side, and most of them are not main sources of paper or patent outputs. The finding indicates that imbalance exists in outputs of papers and patents by organizations, and this situation may be caused by the different characteristics between academic organizations and industry institutions for their preference of research strategies.
3.4 Publication of papers and patents by individuals
T h e 20,758 p a p e r s o n f u e l c e l l a r e categorized by authors, identifying 26,477
15
Table 7. Organizations with Papers and Patents ≥10 and Paper-patent Ratio Between 1-2
Organization Number of papers Number of patents Rank of papers Rank of patents patent ratio
Paper-Los Alamos National Laboratory 114 61 38 21 1.87
US Army 27 15 264 94 1.80
Ceramatec, Inc. 17 10 404 138 1.70
Osaka Gas Co. Ltd. 16 24 431 60 1.50
De Nora Spa. 10 15 591 94 1.50
Johnson Matthey Inc. 26 37 275 37 1.42
Fuji Electric 21 29 335 49 1.38
LS Cable Ltd. 17 22 404 65 1.29
Haldor Topsoe A/S 11 14 571 102 1.27
H Power Corporation 26 21 275 69 1.24
Rolls-Royce Fuel Cell Systems Limited 15 17 450 81 1.13
Mitsubishi Chemical Corporation 12 11 541 125 1.09
Hitachi, Ltd 46 69 137 15 1.50
Mitsubishi Electric Corporation 36 44 183 28 1.22
authors in total (including co-authors). The number of papers published by each author varies by large margins. The majority of the authors (57.36%) have only published 1 paper. On the other end of the spectrum, one author has produced 135 papers. The total number of authors who have produced more than 10 papers accounts for only 4.81% of the total authors, but their papers have a 32.85% share of the total. Evidently, the results of research are mostly produced by a small number of researchers.
As for patents issued to individual inventors, the total 8,112 patents have been invented by 10,297 inventors (including
co-inventors). Among them, one inventor has been granted 59 patents. Similarly to paper production situation, most of the inventors have been granted one patent (58.11%); the number of inventors with more than 10 patents is 3.8% of total inventors, while their production take up 24.95% of the total patents, almost 1/4 of the total. As in the case of papers, fuel cell patents are also concentrated in a small number of inventors.
Take a further observation based on the personal production with the total production relationship in Table 8, the top 20% productive authors take up 60% of the total papers and
16
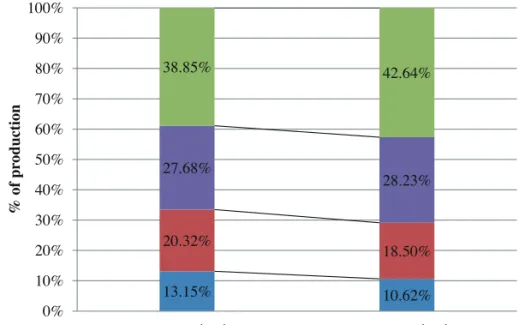
the top 20% productive inventors own 56% of the total patents. Both the top 1% productive individuals of papers and patents have more than 10% of the total production. In Figure 5 also shows the concentration relationship ofindividuals’ productions for papers and patents. Because more than half of individuals in our study data only produced one paper or one patent, we didn’t analyze the correlation between all individuals’ productivities in paper Table 8. Concentration of Publication of Papers and Patents from Individuals
Productivity Number of authors Number of papers* % of total papers Number of inventors Number of patents* % of total patents
Top 1% 265 9,737 13.15 103 2,728 10.62
Top 2%-5% 1,059 15,034 20.32 412 4,751 18.50
Top 6%-20% 3,972 20,491 27.68 1,546 7,249 28.23
Bottom 80% 21,181 28,763 38.85 8,248 10,950 42.65
Total 26,477 74,034 100.00 10,309 25,678 100.00
Note. *For co-author or co-inventor works, each author or inventor is credited once.
Figure 5. Relationships Between Individuals’ Productivity and Their Production of
Papers and Patents
21.88% 31.63% 28.15%
24.72% 29.99% 23.97% 19.97% 19.68%
0% 10% 20% 30% 40% 50% 60% 70% 80% 90% 100%
paper organizations patent organizations
%
of
p
rod
u
ct
ion
the top 1% productivity the top 2%-5% productivity the top 80% productivity the top 6%-20% productivity
17
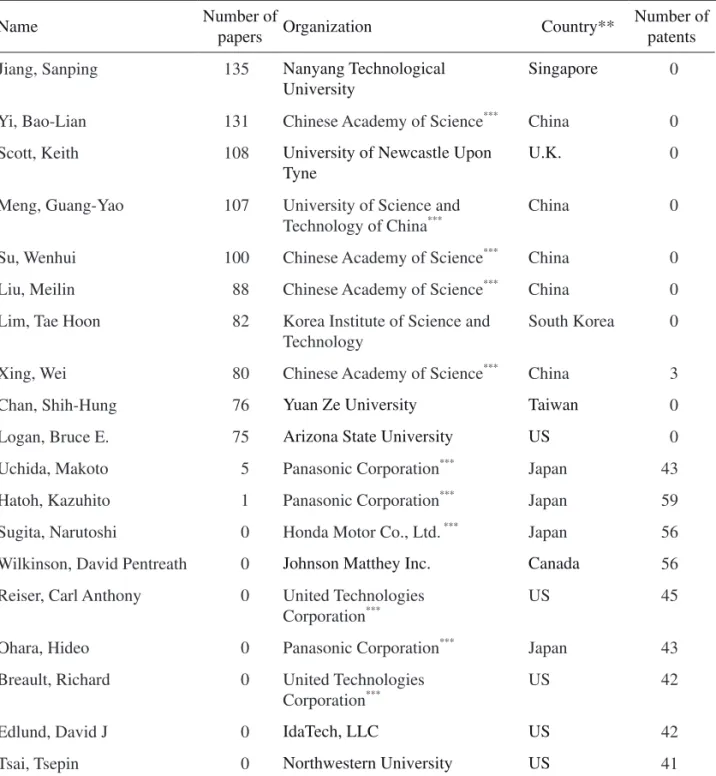
Table 9. Top 10 Productivity Authors of Papers and Inventors of Patents (1991-2010)*
Name Number of papers Organization Country** Number of patents
Jiang, Sanping 135 Nanyang Technological University
Singapore 0
Yi, Bao-Lian 131 Chinese Academy of Science*** China 0 Scott, Keith 108 University of Newcastle Upon
Tyne
U.K. 0
Meng, Guang-Yao 107 University of Science and
Technology of China*** China 0
Su, Wenhui 100 Chinese Academy of Science*** China 0
Liu, Meilin 88 Chinese Academy of Science*** China 0
Lim, Tae Hoon 82 Korea Institute of Science and Technology
South Korea 0
Xing, Wei 80 Chinese Academy of Science*** China 3
Chan, Shih-Hung 76 Yuan Ze University Taiwan 0
Logan, Bruce E. 75 Arizona State University US 0
Uchida, Makoto 5 Panasonic Corporation*** Japan 43
Hatoh, Kazuhito 1 Panasonic Corporation*** Japan 59
Sugita, Narutoshi 0 Honda Motor Co., Ltd. *** Japan 56 Wilkinson, David Pentreath 0 Johnson Matthey Inc. Canada 56 Reiser, Carl Anthony 0 United Technologies
Corporation*** US 45
Ohara, Hideo 0 Panasonic Corporation*** Japan 43
Breault, Richard 0 United Technologies
Corporation*** US 42
Edlund, David J 0 IdaTech, LLC US 42
Tsai, Tsepin 0 Northwestern University US 41
Note. * All individuals are ranged by paper productivity. The first 10 are the top 10 in paper productivity and the latter 10 are the top 10 in patent productivity.
**The country is the nationality of the organization.
***Organizations within top 10 rankings in the number of papers or patents.
18
and patent, but focused on the authors of papers and patents and their characteristics. From the perspective of main authors, Table 9 shows that among the 10 authors with the highest papers productive between 1991 and 2010, the top 3 are Jiang San-ping from Nanyang Technological University, Singapore, Yi Bao-Lian from the Chinese Academy of Science in China, and Keith Scott from the University of Newcastle in Great Britain. The 10 authors from the list are from 7 different organizations: four of them are from the Chinese Academy of Science in China, which is also the organization with the highest number of papers. If the top 10 productive authors are categorized by where their organizations are located, five of the authors who have produced high numbers of papers are in China, with one each of the other five coming from Singapore, Great Britain, the United States, South Korea, and Taiwan.From the perspective of main inventors, Table 9 also shows that among the ten inventors with the highest patents, the top three are Kazuhito Hatoh of Panasonic Corporation, Japan; Narutoshi Sugita of Honda Motor Co., Ltd., Japan; and David Pentreath Wilkinson of Johnson Matthey Inc., Canada. These ten inventors are staff members of one school and six corporations: three of the inventors are on the staff of Panasonic Corporation in
Japan and two are staff of United Technologies Corporation in the United States. Categorized by country, five are from the United States, four from Japan, and one from Canada. Among these inventors, only Makoto Uchida and Kazuhito Hatoh from Panasonic Corporation have published papers on fuel cell, although only five and one paper(s) respectively. None of the other inventors have published any papers.
The data from Table 9 shows that in organizations with more papers or patents production, the workforce also has a stronger capacity for scientific research or technical d e v e l o p m e n t. H o w e v e r, j u s t a s m o s t organizations can only focus on either papers or patents, individuals are often involved in only one of the two as well. It’s rare to find organizations or individuals that are strong in both paper and patent production. As with the top ten authors with highest number of papers, among them, only Xing Wei from the Chinese Academy of Science produced three patents. The rest of the authors have none. Similarly, among the top ten inventors of patents, only Makoto Uchida and Kazuhito Hatoh have published papers, though only five and one paper(s) respectively. The other seven inventors have published none. Among the 20 authors and inventors, none made the top 50 rankings for both categories.
19
4. Conclusion
This study employs bibliometric analysis to explore trends in papers and patents of fuel cell during the period from 1991 to 2010. This study compares the outputs by country, organization, and individual in order to locate the sources of these outputs. The following results have been obtained from this analysis.
4.1 Both number of papers and number of patents show a growing trend, with a higher growth rate for papers.
The resulting data from this study reveals that the number of papers during this period has increased by year, increasing more rapidly from 2003. Although the number of patents has not increased as rapidly as that of papers, it has also increased along an upward curve. The growth of patents is marked by different growth trends in different years. Both number of papers and patents started to rise sharply in 2009 and 2010.
4.2 Countries with high paper output tend to have high patent output, and papers and patents on fuel cell are concentrated in a small number of countries.
In regards to paper and patent output by country, a high correlation exists between the two – countries with high numbers of papers tend to also have high numbers of patents, and vice versa. In regard to the ten countries with
the highest numbers of papers and patents, there are many countries that overlap: both include the United States, Japan, South Korea, Canada, Germany, Great Britain, France, Italy and France. These countries have produced a large portion of the technologies in the field of fuel cell. The distribution of patents is particularly concentrated. Taiwan is ranked as one of the top ten countries in number of papers and patents in fuel cell, but still lags behind most of the top ten countries; its increase rate is also far behind that of South Korea.
4.3 The distributions of papers and patents for organizations match the 80/20 principle.
The analysis of this study finds the d i s t r i b u t i o n o f p a p e r s a n d p a t e n t s f o r organizations are in line with the “80/20 principle,” which is to say that 80% of the outputs are produced by 20% of the organizations. Following this line of thought, the organizations with highest number of papers or patents are also the ones where high-output authors or inventors belong. By this logic, the number of papers or patents for organizations with high outputs will continue to grow in scale.
4.4 Organizations with high numbers of papers rarely produce equally high numbers of patents.
Our data reveals a low correlation between number of papers and number of patents in
20
the same organizations. That means that the organizations with high numbers of papers do not necessarily have high numbers of patents, and vice versa. On the other hand, among the ten organizations with highest numbers of papers and patents, only Jülich Research Centre of Germany makes the top 50 in both categories. A larger discrepancy exists between the numbers of papers and patents for the other organizations.4.5 A c a d e m i c i n s t i t u t i o n s a r e t h e m a i n organizations for the publication of papers, while industrial organizations are the predominant ones for patents.
Statistics from this study reveal that the organizations with highest numbers of journal articles tend to be schools and research institutions, while those with the highest numbers of patents are predominantly industrial institutions, mainly in the automobile and electrical industries. These organizations are mostly located in the United States, China and Japan, which are also countries with high paper and patent outputs. Similarly, the authors and inventors with highest numbers of papers and patents are also from these educational, research, and industrial institutions with high paper and patent outputs.
4.6 Very few authors or inventors have high numbers of both papers and patents.
Of the ten authors with highest number of papers published and the inventors with highest number of patents granted, most are members of the organizations with the highest numbers of papers or patents, and there is no overlap in the individuals listed in each category. Further observation of the numbers of papers and patents reveals a large discrepancy: Most of these authors/ inventors tend to be strong in only one kind of scientific or technological output publication; none of them achieve high outputs for both.
As for the analytical results of this study, there is a lot of gap between the productivity of paper and patent for different countries, organizations and individuals. The different characteristics of academic institutes and industrial institutes influence their members in paper and patent productivity, resulting an imbalance. So in terms of the developments of fuel cell industry, cooperation between industrial institutes and academic institutes is encouraged, in order to stimulate industrial institutes to publish more papers and academic institutes to obtain more patents and promote the scientific and technological interactions in the fuel cell field. The technological developments by Koreans in the fuel cell should be watched closely, do that Taiwan can gain in depth understanding of its position in relation.
21
References
Anderson, J., Williams, K., Seemungal, D., Narin, F., & Olivastro, D. (1996). Human g e n e t i c t e c h n o l o g y: E x p l o r i n g t h e links between science and innovation.
Te c h n o l o g y A n a l y s i s & S t r a t e g i c
M a n a g e m e n t , 8(2), 135-156. d o i: 10.1080/09537329608524240
Barrett, S. (2005). Patent analysis identifies trends in fuel cell R&D. F u e l C e l l s
Bulletin, 2005(11), 12-13. doi: 10.1016/ S1464-2859(05)70832-4
Bureau of Energy, Ministry of Economic Affairs. (2012). T h e w h i t e p a p e r o n
energy industry and technology of 2012.
Retrieved from http://web3.moeaboe.gov. tw/ECW/populace/content/SubMenu. aspx?menu_id=62
Chen, P. H. (2010). A Scientometric study on
hydrogen energy literature and patent
(Unpublished master’s thesis). Department of Information and Library Science, Tamkang University, New Taipei City. E g g h e, L. (1986). O n t h e 80/20 r u l e.
Scientometrics, 10(1), 55-68. doi: 10.1007/ BF02016860
Evans, J. A. (2008). Electronic publication and the narrowing of science and scholarship.
S c i e n c e , 3 2 1(5887), 395-399. d o i: 10.1126/science.1150473
Fuel Cell Today. (2011). The fuel cell today
industry review 2011. Retrieved from
http://www.fuelcelltoday.com/analysis/ i n d u s t r r e v i e w/2011/t h e-i n d u s t r y-review-2011
Glänzel, W., & Meyer, M. (2003). Patents cited in the scientific literature: An exploratory study of ‘reverse’ citation relations.
S c i e n t o m e t r i c s , 5 8(2), 415-428. doi:
10.1023/A:1026248929668
H u a n g, M. H., Ta n g, M. C., & C h e n, D. Z. (2011). Inequality of publishing p e r f o r m a n c e a n d i n t e r n a t i o n a l collaboration in physics. Journal of the
American Society for Information Science
and Technology, 62(6), 1156-1165. doi:
10.1002/asi.21516
Klitkou, A., Nygaard, S., & Meyer, M. (2007). Tracking techno-science networks: A case study of fuel cells and related hydrogen technology R&D in Norway.
S c i e n t o m e t r i c s , 7 0(2), 491-518. doi:
10.1007/s11192-007-0213-6
Larivière, V., Gingras, Y., & Archambault, É. (2009). The decline in the concentration of citations, 1900-2007. Journal of the
American Society for Information Science
and Technology, 60(4), 858-862. doi:
10.1002/asi.21011
Meyer, M. (2002). Tracing knowledge flows in innovation systems. Scientometrics, 54(2), 193-212. doi: 10.1023/A:1016057727209
22
N a r i n, F. (1994). P a t e n t b i b l i o m e t r i c s.S c i e n t o m e t r i c s , 3 0(1), 147-155. doi:
10.1007/BF02017219
Rabeharisoa, V. (1992). A special mediation between science and technology: When inventors publish scientific articles in fuel cells research. In H. Grupp (Ed.),
Dynamics of science-based innovation (pp.
45-72). New York: Springer Verlag. doi: 10.1007/978-3-642-86467-4_3
Trueswell, R. L. (1969). Some behavioral patterns of library users: The 80/20 rule.
Wilson Library Bulletin, 43(5), 458-461.
U. S. Department of Justice and the Federal Trade Commission. (2010). Horizontal
m e rg e r g u i d e l i n e s. Retrieved from
h t t p://w w w.j u s t i c e.g o v/a t r/p u b l i c/ guidelines/hmg-2010.html.
Verspagen, B. (2007). Mapping technological trajectories as patent citation networks: A study on the history of fuel cell research.
Advances in Complex Systems, 10(1),
93-115. doi: 10.1142/S0219525907000945
(Received: 2012/10/5; Accepted: 2013/5/28)
23
Appendix. Table Lists of Some Keywords
Alkaline Fuel Cells Biofuel Cells Biological Fuel Cells Direct Methanol Fuel Cells Enzymatic Fuel Cells Fuel Cells
Hybrid Fuel Cells Hydrogen Fuel Cells Micro Fuel Cells
Molten Carbonate Fuel Cells Nanomaterial Fuel Cells Solid Oxide Fuel Cells Phosphoric Acid Fuel Cells Polymer Electrolyte Fuel Cells
Proton Exchange Membrane Fuel Cells Phosphoric Acid Fuel Cells
24
1 國立臺灣大學圖書資訊學系
Department of Library and Information Science, National Taiwan University, Taipei, Taiwan 2 檔案管理局應用服務組
Archives Service Division, National Archives Administration, Taipei, Taiwan
* 通訊作者Corresponding Author: 黃慕萱Mu-Hsuan Huang, Email: [email protected]
註:本中文摘要由作者提供。
以APA格式引用本文:Huang, M.-H., & Yang, H.-W. (2013). A scientometric study of fuel cell based on paper and patent analysis. Journal of Library and Information Studies, 11(2), 1-24. doi: 10.6182/jlis.2013.11(2).001
以Chicago格式引用本文:Mu-Hsuan Huang and Hsiao-Wen Yang. “A scientometric study of fuel cell based on paper and patent analysis.” Journal of Library and Information Studies 11 no.2 (2013): 1-24. doi: 10.6182/jlis.2013.11(2).001
燃料電池領域論文與專利之科學計量分析
A Scientometric Study of Fuel Cell Based on Paper and
Patent Analysis
黃慕萱
1楊曉雯
2Mu-Hsuan Huang
1, Hsiao-Wen Yang
2摘 要
本研究以書目計量法探討1991年至2010年燃料電池領域科學與技術的發展,研究對象分
別為WOS資料庫及美國USPTO專利資料庫所收錄之20,758篇期刊論文及8,112篇專利。本研究
發現在整體趨勢方面,燃料電池領域論文與專利均呈現顯著的成長趨勢,且論文的成長速度較 快;在國家分析方面,燃料電池領域的論文與專利高度集中在少數國家,論文數高的國家往往 專利數也高。在機構分析方面,論文數高的機構與專利數高的機構少有重複,且兩者的機構類 型亦不相同;而在個人分析方面,論文數高的個人與專利數高的個人重複性更低,顯示個人難 以兼具論文及專利的高產量。
關鍵字:書目計量學、燃料電池、專利、論文