A STATISTICAL BASIS FOR SELECTING PARAMETERS
FOR THE EVALUATION OF SOIL PENETRATION
RESISTANCE
Tairone Paiva Leão1; Álvaro Pires da Silva2*
1
University of Tennessee, Department of Earth and Planetary Sciences, 306 Earth and Planetary Sciences Building, TN - 37996-1410 - USA.
2
USP/ESALQ - Depto. de Ciência do Solo, C.P. 9 - 13418-900 - Piracicaba, SP-Brasil. *Corresponding author <[email protected]>
ABSTRACT: Measurements of soil penetration resistance (SR) have been frequently used for the evaluation of soil structural quality for plant growth. However, different data analysis approaches have been used, without a previous evaluation of their statistical quality. In this study we tested the hypothesis that the mean is the parameter with best statistical properties to evaluate alterations in soil penetration resistance in response to soil use and management, as compared to other SR statistical parameters. Undisturbed (5 × 5 cm) soil cores were collected from three sampling sites with different degrees of compaction: an undisturbed site under native scierophylous forest (NC); a site under short-duration grazing with post-grazing residue maintained at 2.0 to 2.5 Mg (Total Dry Matter) TDM ha-1 (LR); and a site under short-duration grazing with post-grazing residue maintained at 3.0 to 3.5 Mg
TDM ha-1
(HR). The statistical quality of the parameters from undisturbed soil samples of SR profiles: mean (x), median (M), maximum (max), percentage of linear penetrability at 2 MPa (PLP2MPa), and the
parameters from Probit analysis intercept (n) and slope (m) was evaluated using the ANOVA and LSD
tests. Results from the F ratio, P > F values and LSD tests show that mean, median and maximum were
the parameters with better statistical properties as criteria to evaluate alterations in soil penetration resistance in response to soil use and management as compared to other statistical SR parameters, validating the hypothesis of the research.
Key words: LSD, probit analysis, means comparison test, soil physical quality assessment
CRITÉRIOS ESTATÍSTICOS NA SELEÇÃO DE PARÂMETROS PARA
AVALIAÇÃO DA RESISTÊNCIA DO SOLO À PENETRAÇÃO
RESUMO: A quantificação da resistência do solo à penetração (RP) é freqüentemente utilizada na avaliação da qualidade estrutural do solo para o crescimento de plantas. Diferentes abordagens têm sido utilizadas na análise de dados de RP, e na maioria dos casos, sem uma avaliação prévia da qualidade estatística dos parâmetros. Neste trabalho foi testada a hipótese de que a média é o parâmetro com melhores propriedades estatísticas como critério para avaliação de alterações na resistência à penetração do solo em resposta ao uso e manejo do solo, em relação a outros parâmetros estatísticos derivados de conjuntos de dados de RP. Amostras indeformadas de solo (5 × 5 cm) foram coletadas em locais com diferentes graus de compactação: Cerrado nativo (CN); pastejo rotacionado, com nível de resíduo pós-pastejo mantido entre 2,0 e 2,5 Mg (Matéria Seca Total) MST ha-1 (RB); e pastejo
rotacionado, com nível de resíduo pós-pastejo mantido entre 3,0 e 3,5 Mg MST ha-1 (RA). A qualidade
estatística dos parâmetros obtidos dos perfis de RP: média (x), mediana (M), máximo (max), percentagem
linear de penetrabilidade à 2 MPa (PLP2MPa), e os parâmetros da análise Probit: intercepto (n) e inclinação
(m) foi avaliada por meio de ANOVA e pelo teste da Diferença Mínima Significativa (DMS). Os
resultados da razão F, P >F e do teste DMS indicaram que a média, mediana e máximo são os
parâmetros com melhores propriedades estatísticas como critério para avaliar as alterações na resistência à penetração do solo em resposta ao uso e manejo, confirmando a hipótese testada. Palavras-chave: DMS, análise Probit, teste de comparação de médias, avaliação da qualidade física
INTRODUCTION
An ideal methodology to characterize the
include: root size, a lubrication system, an ability to de-velop both axial and radial pressures, rate of root tip ad-vancement, and mainly the ability to seek out pores of appropriate size and resistance to deformation (Groenevelt et al., 1984; Whiteley & Dexter, 1984; Bengough & MacKenzie, 1994). Statistical parameters such as the mean (i.e. arithmetic average) or the maxi-mum SR value of a soil layer can only give a rough idea of the actual limitation of the soil matrix to root growth. To minimize the influence of the soil structural heterogeneity on the soil structural quality evaluation, Groenevelt et al. (1984) defined the Percentage Lin-ear Penetrability (PLP) as the percentage of linLin-ear tra-jectory through soil, for which the actual tip resistance is lower than a set critical value. The PLP concept was further developed by incorporating linear regression analysis on Probit (Finney, 1952; Tietjen, 1986)
trans-formed PLP data (Perfect et al., 1990). The regres-sion procedures resulted in two empirical parameters, the slope (m) and the intercept (n) of the lines. It has
been suggested that the slope, m, reflects the
disper-sion in the aggregate penetration resistance, while the intercept, n, reflects the soil macroporosity (Perfect
et al., 1990). The mean is the statistical parameter most commonly used to evaluate resistance to penetra-tion in soils. In this paper we tested the hypothesis that the mean is the parameter with better statistical prop-erties as criteria to evaluate alterations in soil penetra-tion resistance in response to soil use and management as compared to the SR statistical parameters: median, maximum, m, n, and PLP at the critical value of 2 MPa
(PLP2MPa). The objective of this research was to evalu-ate comparatively the statistical quality of the param-eters from the penetration resistance profile: mean, me-dian, maximum, m, n, and PLP at the critical value of
2 MPa (PLP2MPa).
MATERIAL AND METHODS
The study was conducted with soil cores col-lected in the Mato Grosso do Sul state, Brazil (20º26’ 48’’ S, 54º43’19’’ W). According to Köppen’s classifi-cation, the climate is defined as a transition between Cfa (subtropical humid) and Aw (Tropical wet-dry), with a mean annual precipitation of 1500 mm and mean tem-perature of 22ºC. The soil is classified as Typic Acrudox with 399 g kg-1 clay, 66 g kg-1 silt, and 535 g kg-1 sand. Three sampling sites were selected for the study:
(i) Native Cerrado (NC): an undisturbed savanah site under native scierophylous forest called “Cerradão”; (ii) Short-duration Grazing with Lower Post-Grazing Residue (LR): the site (0.18 ha) cultivated with
Tanza-nia grass (Panicum maximum cv. Tanzania) was grazed
for seven days followed by resting periods of 35 days. This site is part of an intensive short-duration grazing system experiment established in 1999. The experiment was designed to maintain soil base saturation from 45 to 50%; available phosphorous levels in Mehlich-1 (Nelson et al., 1953) from 4 to 8 mg dm-3; and potas-sium from 60 to 80 mg dm-3, at the 0 to 0.2 m layer. The nitrogen fertilization rate was 100 kg N ha-1 yr-1. The post-graze residue at this site was maintained at 2.0 to 2.5 Mg (Total Dry Matter) TDM ha-1. Average an-nual stocking rates were 4.12 (Animal Units) AU ha-1 and 2.26 AU ha-1 for wet and dry seasons, respectively.
(iii) Short-duration Grazing with Higher Post-Grazing Residue (HR): Same features as the LR site, except that the post-graze residue at this site was maintained at 3.0 to 3.5 Mg TDM ha-1. Average annual stocking rates were 4.8 AU ha-1 and 2.26 AU ha-1 for wet and dry seasons, respectively.
Twenty-seven undisturbed (5 × 5 cm) soil cores were collected at each site. The cores were sub-divided in three groups of nine samples. Each group was dried to three water content ranges, namely pre-field ca-pacity range (bfc), field capacity range (fcr) and
post-field capacity range (pfc). The bfc consisted of samples
equilibrated at the tension of 4 KPa, fcr at 10 KPa and pfc at 0.5 MPa. After equilibration, the cores were stored
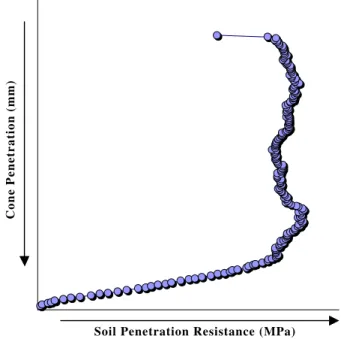
in a refrigerator for one month and used in the evalua-tion of the soil penetraevalua-tion resistance (SR) profiles. The SR profile is the set of penetration resistance val-ues collected along the vertical trajectory of the pen-etrometer in an undisturbed soil sample (Figure 1).
Soil Penetration Resistance (MPa)
Cone Penetration (mm)
These profiles were collected using an electronic pen-etrometer device directly connected to a computer par-allel port. The cone penetrometer used has a semi-angle of 30º and 3.86 mm of basal diameter. The penetra-tion rate was 1.0 cm min-1, with values recorded ev-ery 0.7 s. Immediately after the SR tests, soil cores were oven dried at 105ºC for 24 hours and volumet-ric water content (θV) and bulk density (Db) were cal-culated.
For each SR profile the statistical parameters: mean (x), median (M), maximum (max), and the
pa-rameters from Probit analysis slope (m), intercept (n)
and percentage linear penetrability at the critical value of 2 MPa (PLP2MPa) (Groenevelt et al., 1984; Perfect et al., 1990) were calculated. For each water content range, the set of SR statistical parameters for the sam-pling sites (NC, HR, LR) was evaluated using the F
ratio from ANOVA (Gravetter & Wallnau, 1995) and mean comparisons by Least Significant Difference test (LSD) (Hsu, 1996). All statistical analyses were per-formed using the SAS/STAT software package (SAS Institute, 1999).
RESULTS AND DISCUSSION
Mean values for volumetric water content (θv), dry bulk density (Db), and for the statistical pa-rameters from the soil penetration resistance (SR) pro-files: mean (x), median (M), maximum (max), slope
(m), intercept (n) and percentage linear penetrability
at the critical value of 2 MPa (PLP2MPa) are presented in Table 1. Parameters are grouped by sampling site and water content range, therefore the statistical
pa-rameters from the SR profiles are evaluated not only according to their sensitivity to soil use and manage-ment, but the influence of soil water content over these relationships was also investigated.
The sites used in this study were selected so that three different and clearly distinct degrees of compaction could be used in SR parameter evalua-tions. Mean Db values were lower in the NC site, Db = 0.97 g cm-3, and increased with the stocking rate in the grazed sites, Db = 1.30 g cm-3 in HR and Db = 1.42 g cm-3 in LR. For clay Oxisols such the one evaluated here, these Db values are usually associ-ated with loose soil (NC) (Normally undisturbed na-tive vegetation), slightly compacted (HR), and highly compacted sites (LR), respectively. Once stated that the difference in compaction degree between the sites was previously known, the statistical quality of each SR profile parameter was initially evaluated by the magnitude of the F ratio from the ANOVA and by its
statistical significance level (P > F) (Gravetter &
Wallnau, 1995).
According to the classical statistical theory, the higher the F ratio and the lower the P > F value the
better is the statistical quality of the indicator (Gravetter & Wallnau, 1995). However, it is worth noting that not only the statistical quality of the parameter was inves-tigated but also its physical significance in the process was taken into account in this discussion (Webster, 2001). The F ratio, P > F, and r2 from the ANOVA
used for comparison of SR profile parameters between sampling sites are presented in Table 2, Table 3, and Table 4, for the water content ranges: bfc, fcr and pfc
respectively.
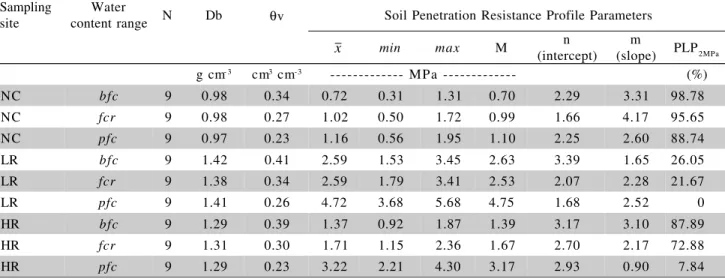
Table 1 - Statistical parameters for the soil cores from NC, LR and HR sites at three water content ranges.
Sampling site
Water
content range N Db θv Soil Penetration Resistance Profile Parameters
min max M (intercept)n (slope)m PLP2MPa g cm- 3 cm3 cm-3 --- MPa --- (%)
NC bfc 9 0.98 0.34 0.72 0.31 1.31 0.70 2.29 3.31 98.78
NC fcr 9 0.98 0.27 1.02 0.50 1.72 0.99 1.66 4.17 95.65
NC pfc 9 0.97 0.23 1.16 0.56 1.95 1.10 2.25 2.60 88.74
LR bfc 9 1.42 0.41 2.59 1.53 3.45 2.63 3.39 1.65 26.05
LR fcr 9 1.38 0.34 2.59 1.79 3.41 2.53 2.07 2.28 21.67
LR pfc 9 1.41 0.26 4.72 3.68 5.68 4.75 1.68 2.52 0
HR bfc 9 1.29 0.39 1.37 0.92 1.87 1.39 3.17 3.10 87.89
HR fcr 9 1.31 0.30 1.71 1.15 2.36 1.67 2.70 2.17 72.88
HR pfc 9 1.29 0.23 3.22 2.21 4.30 3.17 2.93 0.90 7.84
x
Db = bulk density, θv = volumetric water content, NC = Native Cerrado, LR = Short-duration Grazing with Lower Post-Grazing Residue, HR = Short-duration Grazing with Higher Post-Grazing Residue, bfc = pre-field capacity range, fcr = field capacity range, pfc = post-field capacity range, x = mean, min = minimum, max = maximum, M= median, n = intercept, m = slope, PLP2MPa = percentage
At the three evaluated water content ranges the higher F ratio and lower P > F value were found for
the statistical parameters x, max, M and PLP2MPa
(Tables 2 to 4). The x and max are the SR parameters
most commonly used for evaluation of soil physical qual-ity, or compaction degree (Corrêa & Reichardt, 1995; Sojka et al., 2001; Villamil et al., 2001). The results pre-sented here only confirm that these parameters are ad-equate to evaluate the SR in soil quality studies. How-ever, the PLP2MPa may be a more meaningful parameter since it indicates the percentage of the linear trajectory (PLP) through a soil sample (or layer) that would be penetrable with resistance values lower than 2 MPa (Groenevelt et al., 1984). Mean, maximum and median values give only a rough idea of the degree of mechanical resistance of a soil. For mean and maximum, besides the fact that they represent a whole soil layer with a single value, they can be highly affected by extreme servations. Despite not being affected by extreme ob-servations, the median has not been frequently used as an indicator parameter of soil resistance, which is prob-ably related to the fact that it cannot give a true repre-sentation of the range of resistances in a soil sample/ profile nor give an indication of high SR values in lay-ers/spots which can limit root growth under field con-ditions. The PLP, on the other hand, estimates the frac-tion of the linear trajectory through a soil that is readily penetrable by a growing root, given a certain critical pen-etration resistance value. Therefore, the PLP could give a better picture of the degree of penetrability of a soil layer than any other indexes (Groenevelt et al., 1984).
The critical SR value of 2 MPa for the PLP was chosen since there is experimental evidence that root growth is severelly restricted at this condition (Taylor et al., 1966; Materechera et al., 1991). Thus at the PLP2MPa a given percentage of the soil profile would be penetrable at values lower then 2 MPa. For any water content range, the PLP2MPa was greater at the NC site (ranging from 88.74 to 98.78%) and much lower at the LR site (ranging from 0 to 26.5%). How-ever it is not known which percentage of the soil pro-file would need to be penetrable under a certain me-chanical resistance for adequate root growth to occur. What is known is that plant roots are able to “search” for rooting paths in pores, fissures and zones of lower mechanical resistance through soil (Groenevelt et al., 1984; Whiteley & Dexter, 1984; Dexter, 1986a; 1986b). It has been suggested that the parameters m (slope)
and n (intercept) from the Probit regression analysis
could represent this soil structural heterogeneity (Per-fect et al., 1990). The m parameter would reflect the
spread in distribution of aggregate strengths while n
would reflect the macroporosity (Perfect et al., 1990). However, their statistical quality as criteria for evalua-Table 2 - ANOVA summary for soil penetration resistance
parameters comparison between Native Cerrado (NC), Short-duration Grazing Lower Post-Grazing Residue (LR) and Short-duration Grazing Higher Post-Grazing Residue (HR) soil samples at pre-field capacity water content range.
***significant (P < .0001). n = intercept, m = slope, x = mean, max = maximum, M= median, , PLP2MPa = percentage linear penetrability at the critical value of 2 MPa.
F p > F R2
n (intercept) 0.93 0.4103 0.09
m (slope) 0.73 0.4932 0.06
x 35.16 *** 0.74
max 26.54 *** 0.69
M 35.23 *** 0.74
PLP2MPa 26.4 *** 0.69
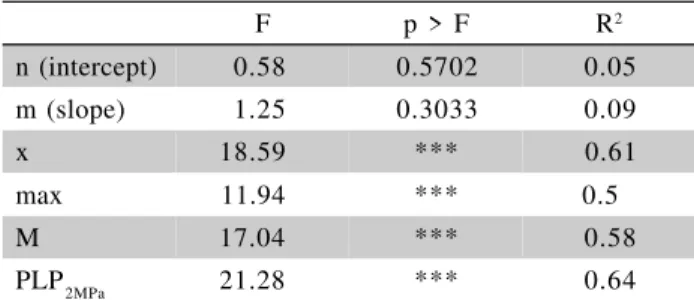
F p > F R2
n (intercept) 0.58 0.5702 0.05
m (slope) 1.25 0.3033 0.09
x 18.59 *** 0.61
max 11.94 *** 0.5
M 17.04 *** 0.58
PLP2MPa 21.28 *** 0.64
Table 3 - ANOVA summary for SR parameters comparison between Native Cerrado (NC), Short-duration Grazing Lower Post-Grazing Residue (LR) and Short-duration Grazing Higher Post-Grazing Residue (HR) soil samples at field capacity water content range.
*** significant (P < .0001). n = intercept, m = slope, x = mean, max = maximum, M= median, , PLP2MPa = percentage linear penetrability at the critical value of 2 MPa.
Table 4 - ANOVA summary for SR parameters comparison between Native Cerrado (NC), Short-duration Grazing Lower Post-Grazing Residue (LR) and Short-duration Grazing Higher Post-Grazing Residue (HR) soil samples at post-field capacity water content range.
*significant (P < .05). *** significant (P < .0001). n = intercept, m = slope, x = mean, max = maximum, M= median, , PLP2MPa = percentage linear penetrability at the critical value of 2 MPa.
F p > F R2
n (intercept) 1.67 0.2123 0.13
m (slope) 4.72 * 0.28
x 55.98 *** 0.82
max 38.55 *** 0.76
M 57.32 *** 0.82
tion of SR differences among different soil manage-ment strategies was lower than the other evaluated pa-rameters (Tables 2 to 4).
To further investigate the ability of the param-eters as criteria to categorize SR among sampling sites with different compaction degrees, mean comparison tests were performed for the SR parameters with higher
F ratio and lower P < F value. Tables 5, 6, 7 and 8
present the LSD means comparison test for PLP2MPa,
x, max and M soil resistance parameters, respectively,,
between sampling sites. Theoretically, the more sensi-tive the parameter to SR alterations by soil management, the more easily the LSD test could identify statistically significant differences among sites. The three param-eters from the SR profile, PLP2MPa, x, max and M
iden-tified the same trend of soil physical quality decrease at any water content range (Tables 5 to 8). However, the interpretation of PLP2MPa results is different, since the sampling sites with best soil physical quality will have higher values (Table 5). Therefore, at any water con-tent range, the PLP2MPa value was lower at LR, but they did not differ statistically between the NC and HR sites for the bfc and fcr water content ranges. At pfc the
PLP2MPa did not differ statistically between LR and HR sites. This behavior can be explained by the fact that in compacted sites the SR increases sharply with the de-crease in water content while the magnitude of this in-crease is lower in loose soil (Imhoff et al., 2000).
The same trends were observed between sam-pling sites for the x, max and M. At any water content
range the x, max and M values were greater at the LR
site. As one might expect, the LR site was associated with the worst soil structural properties, a trend which was also identified by other physical parameters, like Db (Table 1), range of critical bulk density values and least limiting water range (Leão et al., 2004). At higher water contents (bfc and fcr) the LSD test for the max
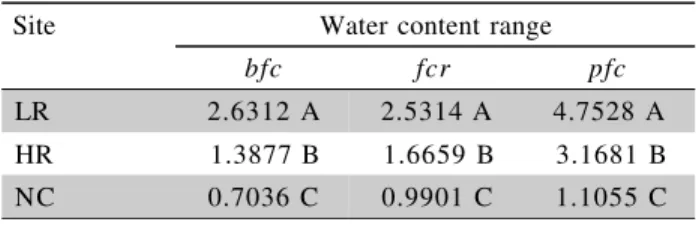
and PLP2MPa parameters identified the same statistical trend (Tables 5 and 7). The SR properties were better and not statistically different for the NC and HR sites. On the other hand, even at with higher water content, the LR site soil had low structural quality as evaluated by any SR profile parameter (Tables 5 to 8). At any water content range, M and x were the more sensitive
parameters to assess changes in soil resistance charac-teristics between sites (Tables 6 and 8).
With drier soil (pfc) the sensitivity of the LSD
test was equal for the x, max, and M parameters
(Tables 6, 7 and 8). At this water content range (pfc)
the LSD test for the x, max and M parameters
identi-fied the three sites as statistically different, the value of the parameter decreasing from LR to NC site. The SR characteristics in a soil are mainly influenced by bulk density and water content and by their
interac-Site Water content range
bfc fcr pfc
NC 98.78 A 95.65 A 88.74 A
HR 87.89 A 72.88 A 7.84 B
LR 26.05 B 21.67 B 0 B
Table 5 - Percentage linear penetrability at 2 MPa (PLP2MPa) values for each sampling site and water content range†.
†Means followed by the same letter in the columns do not differ (LSD at P < 0.05). NC = Native Cerrado, LR = Short-duration Grazing with Lower Post-Grazing Residue, HR = Short-duration Grazing with Higher Post-Grazing Residue, bfc = pre-field capacity range, fcr = field capacity range, pfc = post-field capacity range.
Site Water content range
bfc fcr pfc
LR 2.5947 A 2.5885 A 4.7206 A
HR 1.3728 B 1.7059 B 3.2251 B
NC 0.7165 C 1.0251 C 1.1561 C
Table 6 - Mean (x) soil resistance values (MPa) for each
sampling site and water content range†.
†Means followed by the same letter in the columns do not differ (LSD at P < 0.05). NC = Native Cerrado, LR = Short-duration Grazing with Lower Post-Grazing Residue, HR = Short-duration Grazing with Higher Post-Grazing Residue, bfc = pre-field capacity range, fcr = field capacity range, pfc = post-field capacity range.
Site Water content range
bfc fcr pfc
LR 3.4479 A 3.4154 A 5.6768 A
HR 1.8721 B 2.3653 B 4.2977 B
NC 1.3141 B 1.726 B 1.9492 C
Table 7 - Maximum (max) soil resistance values (MPa) for
each sampling site and water content range†.
†Means followed by the same letter in the columns do not differ (LSD at P < 0.05). NC = Native Cerrado, LR = Short-duration Grazing with Lower Post-Grazing Residue, HR = Short-duration Grazing with Higher Post-Grazing Residue, bfc = pre-field capacity range, fcr = field capacity range, pfc = post-field capacity range.
Site Water content range
bfc fcr pfc
LR 2.6312 A 2.5314 A 4.7528 A
HR 1.3877 B 1.6659 B 3.1681 B
NC 0.7036 C 0.9901 C 1.1055 C
Table 8 - Median (M) soil resistance values (MPa) for each sampling site and water content range†.
tions (Sojka et al., 2001). However, as one might ob-serve in surface plots of SR as a function of both bulk density and water content (Imhoff et al., 2000; Sojka et al., 2001) the influence of bulk density over SR characteristics increases as the soil water content de-creases. The decrease in SR with the increase in θv is due to the reduction in cohesion and in the angle of internal friction as soil water content increases (Camp & Gill, 1969). The increase in SR with Db is attrib-uted to the effect of compaction over soil matrix, and the increase in interparticle friction as soil particles be-come closer with soil compaction (Vepraskas, 1984; Sojka et al., 2001). At lower water contents, x, max
and Mwere more reliable in identifying these relation-ships than any other SR profile parameter.
To test if the PLP2MPa could be estimated from easily measured soil physical properties (i.e. water con-tent, bulk density, and resistance parameters) for the specific conditions of the soil under evaluation, a simple stepwise multiple regression exercise was car-ried out. The PLP2MPa was inputted in the stepwise re-gression model as a function of bulk density, volumet-ric water content and the soil resistance parameters: maximum, minimum, mean and median. The PLP2MPa for the soil under evaluation can be estimated with a high degree of accuracy from bulk density and mean soil resistance values (i.e. arithmetic average).
PLP2MPa = 145.97 – 28.23 Db – 26.03 SR (r2 = 0.80,
F = 104.3***) (1)
where: PLP2MPa = Percentage of linear penetrability at the soil resistance of 2MPa (%); Db = Soil bulk den-sity (g cm-3); SR= Mean soil resistance (MPa); Db > 0; 0 < PLP2MPa < 100; SR > 0.
CONCLUSIONS
The mean, maximum and median are the param-eters with better statistical properties as criteria to evalu-ate alterations in soil penetration resistance in response to soil use and management as compared to the statisti-cal SR parameters: m, n, and PLP at the critical value
of 2 MPa (PLP2MPa). The traditional indicator of SR, the mean, is adequate to evaluate the differences in SR among sites with different use and management. How-ever, it would be more effective at lower water contents. A new parameter PLP2MPa is also proposed, but its sen-sitivity to SR changes should be further investigated.
REFERENCES
BENGOUGH, A.G.; MACKENZIE, C.J. Simultaneous measurements of root force and elongation for seedling pea roots. Journal of
Experimental Botany, v.45, p.95-102, 1994.
CAMP, C.R.; GILL, W.R. The effect of drying on soil strength parameters. Soil Science Society of America Proceedings, v.33, p.641-644, 1969.
CORREA, J.C.; REICHARDT, K. Efeito do tempo de uso das pastagens sobre as propriedades de um Latossolo Amarelo da Amazônia Central. Pesquisa Agropecuária Brasileira, v.30, p.107-114, 1995.
DEXTER, A.R. Model experiments on the behaviour of roots at the interface between tilled seed-bed and compacted sub-soil. II. Entry of pea and wheat roots into sub-soil cracks. Plant and
Soil, v.95, p.135-147, 1986a.
DEXTER, A.R. Model experiments on the behavior of roots at the interface between tilled seed-bed and compacted sub-soil. III. Entry of pea and wheat roots into cylindrical biopores. Plant
and Soil, v.95, p.149-161, 1986b.
FINNEY, D.J. Probit analysis: a statistical treatment of the
sigmoid response curve. Cambridge: University Press, 1952.
318p.
GRAVETTER, F.J.; WALLNAU, L.B. Essential statistics for
the behavioral sciences. 2.ed. Minneapolis: West Publishing
Company, 1995. 431p.
GROENEVELT, P.H.; KAY, B.D.; GRANT, C.D. Physical assessment of a soil with respect to rooting potential. Geoderma, v.34, p.101-114, 1984.
HSU, J.C. Multiple comparisons: theory and methods. London: Chapman & Hall, 1996. 277p.
IMHOFF, S.; SILVA, A.P.; TORMENA, C.A. Aplicações da curva de resistência no controle da qualidade física de um solo sob pastagem. Pesquisa Agropecuária Brasileira, v.35, p.1493-1500, 2000.
LEÃO, T.P.; SILVA, A.P.; MACEDO, M.C.M.; IMHOFF, S.; EUCLIDES, V.P.B. Intervalo hídrico ótimo na avaliação de sistemas de pastejo contínuo e rotacionado. Revista Brasileira
de Ciencia do Solo, v.28, p.1-8, 2004.
MATERECHERA, S.A.; DEXTER, A.R.; ALSTON, A.M. Penetration of very strong soils by seeding of different plant species. Plant and Soil, v.135, p.31-41, 1991.
NELSON, W.L.; MEHLICH, A.; WINTERS, E. The development evaluation and use of soil tests for phosphorus availability. In: PIERRE, W.H., NORMAN, A.G. (Ed.). Soil fertilizer
phosphorus in crop nutrition. New York: Academic Press,
1953. p.153-188.
PERFECT, E.; GROENEVELT, P.H.; KAY, B.D.; GRANT, C.D. Spatial variability of soil penetrometer measurements at the mesoscopic scale. Soil and Tillage Research, v.16, p.257-271, 1990.
SAS INSTITUTE. SAS/STAT user’s guide: version 8. Cary, 1999. SOJKA, R.E.; BUSSCHER, W.J.; LEHRSCH, G.A. In situ strength, bulk density, and water content of a durinodic xeric haplocalcid soil. Soil and Tillage Research, v.166, p.520-529, 2001. TAYLOR, H.M.; ROBERSON, G.M.; PARKER, J.J. Soil
strength-root penetration relations to coarse textured materials. Soil
Science, v.102, p.18-22, 1966.
TIETJEN, G.L. A topical dictionary of statistics. New York: Chapman and Hall, 1986. 171p.
VEPRASKAS, M.J. Cone index of loamy sands as influenced by pore size distribution and effective stress. Soil Science Society
of America Journal, v.48, p.1220-1225, 1984.
VILLAMIL, M.B.; AMIOTTI, N.M.; PEINEMANN, N. Soil degradation related to overgrazing in the semi-arid southern caldenal of Argentina. Soil Science, v.166, p.441-452, 2001. WEBSTER, R. Statistics to support soil research and their presentation. European Journal of Soil Science, v.52, p.331-340, 2001.
WHITELEY, G.M.; DEXTER, A.R. The behaviour of roots encountering cracks in soil. II. Development of a predictive model. Plant and Soil, v.77, p.141-149, 1984.