Original Article
Artigo Original
Relationship between vocal symptoms,
severity of voice disorders, and laryngeal
diagnosis in patients with voice disorders
Relação entre os sintomas vocais, intensidade
do desvio vocal e diagnóstico laríngeo em
pacientes com distúrbios da voz
Leonardo Wanderley Lopes1
Hêmmylly Farias da Silva1
Deyverson da Silva Evangelista1
Jocélio Delfino da Silva1
Layssa Batista Simões1
Priscila Oliveira Costa e Silva1
Maria Fabiana Bonfim de Lima-Silva1
Anna Alice Figueiredo de Almeida1
Keywords
Voice Self-assessment Larynx Voice Disorders Symptoms Dysphonia
Descritores
Voz Autoavaliação Laringe Distúrbios da voz Sintomas Disfonia
Correspondence address:
Leonardo Wanderley Lopes
Departamento de Fonoaudiologia, Centro de Ciências da Saúde, Universidade Federal da Paraíba – UFPB
Cidade Universitária, Castelo Branco, Campus I, João Pessoa (PB), Brazil, CEP: 58051-900.
E-mail: [email protected]
Received: March 06, 2015
Study carried at the Department of Speech Language Pathology, Universidade Federal da Paraíba – UFPB - João Pessoa (PB), Brazil.
1 Universidade Federal da Paraíba – UFPB - João Pessoa (PB), Brazil.
Financial support: Assistance from the Conselho Nacional de Desenvolvimento Cientíico e Tecnológico (CNPq).
Conlict of interests: nothing to declare.
ABSTRACT
Purpose: To investigate whether there is an association between the frequency of occurrence of vocal symptoms,
the intensity of vocal deviation and laryngeal diagnosis in patients with different voice disorders. Methods: The
study included 330 patients with vocal complaints. The patients were divided into ive groups according to the laryngeal diagnosis: G1- without laryngeal lesions; G2 -benign vocal fold lesions; G3 - voice disorder of neurological origin; G4 -incomplete glottal closure without organic or neurologic cause; and G5 - voice disorder secondary to gastroesophageal relux. All participants responded to the Voice Symptom Scale (VoiSS) and recorded the sustained /ɛ/ vowel, which was analyzed for the intensity of vocal deviation using a visual analog scale. Results: There were differences in total VoiSS scores and in scores for the impairment and physical
domains among the different diagnostic groups. Patients with lesions in the membranous portion of the vocal folds presented more vocal symptoms than those in the other diagnostic groups. There was a positive correlation between the intensity of vocal deviation and the total, limitation and emotional VoiSS scores. Patients with moderate and intense vocal deviation showed a greater number of vocal symptoms than patients with healthy voices or with mild deviations. Conclusion: There is an association between laryngeal diagnosis, the intensity of
vocal deviation and vocal symptoms. Patients with benign vocal fold lesions and more intense vocal deviations have a higher frequency of vocal symptoms.
RESUMO
Objetivo: investigar se existe associação entre a frequência de ocorrência dos sintomas vocais, a intensidade do
desvio vocal e o diagnóstico laríngeo em pacientes com diferentes distúrbios da voz. Métodos: Participaram do estudo 330 pacientes com queixa vocal, distribuídos em cinco grupos de acordo com o diagnóstico laringológico: G1-sem lesão laríngea, G2-lesões benignas das pregas vocais, G3-distúrbio neurológico da voz, G4-fenda glótica sem causa orgânica ou neurológica e G5-distúrbio de voz secundário a reluxo gastroesofágico. Foram alocados em cinco grupos, de acordo com o diagnóstico laríngeo. Todos os participantes responderam à Escala de Sintomas Vocais (ESV) e gravaram a vogal /ɛ/ sustentada, que foi analisada quanto à intensidade do desvio vocal por meio de uma escala analógico-visual. Resultados: Houve diferença nos escores total, de limitação e físico da ESV entre diferentes grupos diagnósticos. Pacientes com lesão na porção membranosa das pregas vocais apresentaram maior número de sintomas vocais em relação aos outros grupos diagnósticos. Observou-se correlação positiva entre a intensidade do desvio vocal e os escores total, de limitação e emocional da ESV. Pacientes com desvio vocal moderado e intenso apresentaram maior número de sintomas vocais que pacientes com vozes saudáveis ou com desvio leve. Conclusão: Existe associação entre o diagnóstico laríngeo, a intensidade do desvio vocal
INTRODUCTION
Voice disorders are pathological conditions that directly affect voice production. Voice disorders manifest in various ways, including the presence of sensory and auditory symptoms, deviations in vocal quality and functional and/or structural laryngeal changes that may involve behavioral and/or organic factors associated with their genesis and maintenance(1). These
disorders can have a negative impact on the patient’s quality of life, compromising social, emotional, and work-related situations(2,3).
Patients with voice disorders may experience various symptoms, of which hoarseness, sore throat, vocal fatigue, and throat clearing are the most common. These symptoms may be associated with intense voice use, upper respiratory tract infections, stress, and smoking(4).
Because manifestation of a voice disorder is multidimensional, its assessment must include a variety of factors, including perceptual voice assessment, visual laryngeal inspection, acoustic analysis, aerodynamic assessment, and vocal self-assessment(5).
Vocal self-assessment is highly valued because it attempts to capture the perceptions of patients in relation to their voices; it is used in an integrated manner with other assessment methods(3).
Self-assessment instruments are useful for evaluating the impact of the problem on the patient’s life, for monitoring progress, and for evaluating the effectiveness of the treatment offered; self-assessment also plays an important role in treatment decisions(6,7). The Voice Symptoms Scale (VoiSS)(8) is one
such instrument. The primary aim of its use is to determine the frequency of occurrence of symptoms presented by the patient. It was originally developed in English(8) and has been
subsequently translated and validated for Brazilian Portuguese(9).
The VoiSS includes 30 items and 4 domains (impairment, emotional, physical and total) that reflect the physical, communication, and emotional symptoms present in patients with voice disorders. It offers a high level of internal consistency and excellent reproducibility and is very accurate when used to discriminate patients with from those without voice disorders(7).
Because voice disorders identiied by the speech therapist and/or physician are not always perceived by the patient as being of the same magnitude, studying the vocal symptoms of patients allows a wider and more adequate view of their needs(8). Moreover,
in most cases, an increase in the number of voice symptoms is what most strongly determines the search for specialized care and is more signiicant to the patient than the deviation in voice quality itself(8). In general, the symptoms presented by the patient
may relect a decrease in vocal performance and/or changes in laryngeal functioning and may be related to the laryngeal diagnosis and vocal deviation intensity(10-12).
Given that the purpose of the assessment process and of vocal diagnosis is to integrate and interpret different types of data as a basis for clinical decision-making and to monitor the patient’s condition, the objective of this study was to investigate whether there is an association between the frequency of occurrence of vocal symptoms, vocal deviation intensity, and laryngeal diagnosis in patients with various types of voice disorders.
METHODS
This was a descriptive, observational, and cross-sectional study; it was evaluated and approved by the Ethics Committee of the institution of origin under protocol number 52492/12. All participants were informed about the study and voluntarily signed an informed consent form.
Patients above 18 and below 65 years of age who presented vocal complaints and had received prior laryngeal diagnosis were included in the study. Individuals with cognitive or neurological disorders that prevented them from completing the questionnaire were excluded.
A total of 330 subjects (252 females and 78 males) participated in the study. The mean age of the subjects was 40.06 years (standard deviation [SD] = 13.98). This population was treated in the screening sector of the Integrated Voice Studies Laboratory (IVSL) of a higher education institution during the period from August 2012 to February 2014.
The VoiSS was used to investigate data regarding the frequency of occurrence of the vocal symptoms reported by the patient. This instrument contains 30 items, 15 in the impairment domain (functionality), 8 in the emotional domain (psychological effect), and 7 in the physical domain (organic symptoms). Each item is rated on a 5-point Likert scale numbered 0-4; “0” corresponds to “never” and 4 to “always.” For the calculation, each domain’s items were simply summed(9).
A voice recording was conducted for each subject. The subject was asked to produce a sustained /ε/ vowel sound at a comfortable frequency and intensity, selected by the individual. The data collection session, which included completion of the VoiSS and the voice recording, occurred at the time of initial patient assessment prior to voice therapy and lasted an average of 30 minutes.
Voice collection was conducted in a soundproof booth with ambient noise of less than 50 dB sound pressure level (SPL) as measured by a digital sound pressure meter. A Sennheiser E835 unidirectional cardioid microphone was used. The microphone was ixed on a pedestal and coupled to a Dell desktop computer using a Behringer audio interface, model U-Phoria UMC 204, using FonoView software from CTS Informática. The sampling rate was 44.100 Hz, thereby preserving most of the voice signal information. During recording, the microphone was placed at an average distance of 10 cm from the labial commissure.
After collection, the voice recordings were edited using Sound Forge version 10.0 software. The irst and last two seconds of the vowel emission were eliminated due to the greater irregularity of these parts. A minimum time of three seconds was preserved for each emission. Normalization using the “normalize” control of Sound Forge in peak level mode was performed to obtain a standard audio output of between -6 and 6 dB.
has more than 10 years of experience in auditory-perceptual voice assessment.
Prior to auditory-perceptual assessment, 16 anchor stimuli of the sustained /ɛ/ vowel were used for judge training. The anchor stimuli included four samples from vocally healthy individuals, four samples from individuals with mild vocal deviation, four samples from individuals with mild-to-moderate vocal deviation, and four samples from individuals with intense vocal deviation. For each degree of vocal deviation, two iles of male voices and two iles of female voices were provided. The judge was asked to listen to the anchor stimuli immediately prior to the analysis of the voices collected for this study. All samples selected for this training were previously analyzed by speech therapists with experience in voice analysis and were routinely used for auditory-perceptual training and as anchor stimuli in the laboratory in which this study was conducted.
During the auditory-perceptual assessment, each sustained vowel emission recording was presented to the judge three times through a sound box at a comfortable self-reported intensity. This evaluator then judged the intensity of the vocal deviation.
Of the 330 voice samples analyzed in this study, 10% were repeated at random to analyze the reliability of the judge’s assessment using Cohen’s kappa coeficient. Intra-rater reliability displayed a kappa coeficient of 0.79, indicating good agreement. Subsequently, the numerical scale (NS) was matched to the VAS, with a grade of 1 (0 to 35.5 mm) indicating normal vocal quality variability (NVQV), a grade of 2 (35.6 to 50.5 mm) indicating mild-to- moderate deviation, a grade of 3 (50.6 to 90.5 mm) indicating moderate deviation and a grade of 4 (90.6 to 100 mm) indicating intense deviation(13).
The patients were divided into diagnostic groups according to the main voice disorders treated at the laboratory in which the study was conducted, conirming the most prevalent indings in the general population(12). The main criterion for
patient allocation into diagnostic groups was the result of the laryngeal examination because the laryngeal image is used as a reference standard to conirm the diagnostic classiication of a voice disorder(14).
All patients had an ear-nose-throat report based on their laryngeal image. Patients with vocal complaints caused by changes in the central nervous system also had a complementary neurologist’s report in the collection session.
A descriptive statistical analysis was performed on all variables using the mean and standard deviation values. Inferential statistical analysis was used, with analysis of variance (ANOVA) used to compare the VoiSS scores between diagnostic groups and between patients with different vocal deviation intensities. When there was a signiicant difference between groups, a post hoc analysis was performed using the Tukey test. Spearman’s correlation test was used to analyze the correlation between vocal deviation intensity and VoiSS score, noting whether the variables changed together and to what degree. In this analysis, the correlation coeficient ranges from -1 to 1; negative values indicate that the variables behave in an inversely proportional manner and positive values indicate that they vary proportionally.
In this study, correlation coeficient values from 0.1 to 0.3 were considered to represent weak correlation; values between 0.4 and 0.6 were taken to indicate moderate correlation, and values greater than 0.7 were taken to indicate that the degree of correlation between the variables was strong.
All analyses were performed using the Statistical Package for the Social Sciences (SPSS) version 20.0. The adopted signiicance level was 5%.
RESULTS
This section describes the results of the studied patients’ laryngeal diagnosis and auditory-perceptual assessment, followed by a comparison of the VoiSS scores according to laryngeal diagnosis and vocal deviation intensity and correlation between the VoiSS and vocal deviation intensity.
With respect to the laryngeal diagnosis, 86 of the patients in this study (26.06%) had no laryngeal lesions, 149 (45.15%) had benign vocal fold lesions (nodules, polyps or cysts), 35 (10.61%) had neurological voice disorders (Parkinson’s disease, unilateral vocal fold paralysis or multiple sclerosis), 7 (8.18%) had incomplete glottal closure without organic or neurological cause, and 33 (10%) had a voice disorder secondary to gastroesophageal relux.
With respect to vocal deviation intensity, 56 patients (16.96%) had normal vocal quality variability, 137 (41.51%) had mild-to-moderate vocal deviation, 114 (34.54%) had moderate vocal deviation and 23 patients (6.96%) had intense vocal deviation.
On comparing the VoiSS means of the different diagnostic groups, differences were observed in the total (p < 0.001), impairment (p < 0.001) and physical (p = 0.002) scores (Table 1).
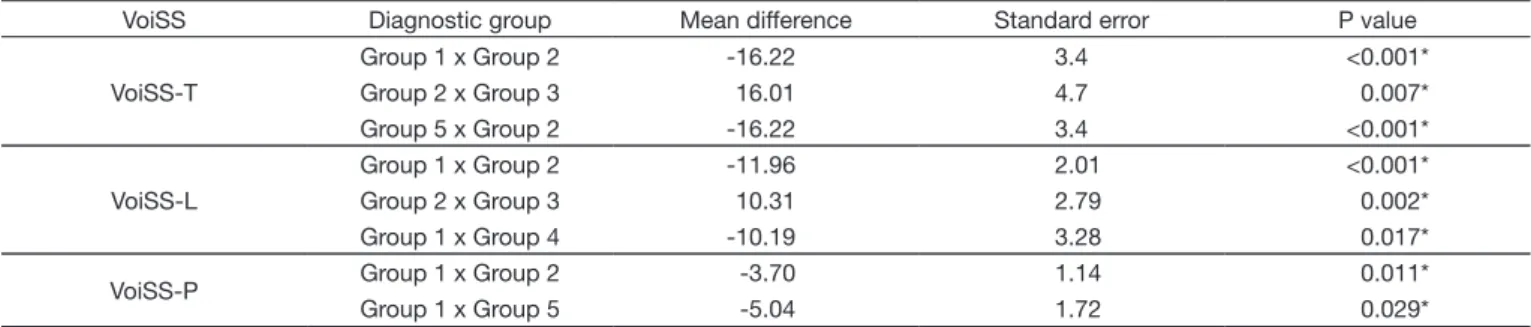
Given the observed differences in VoiSS scores according to laryngeal diagnosis, we proceeded with the post hoc analysis. In this analysis, it was observed based on the total VoiSS score that patients with benign vocal fold lesions had more vocal symptoms than patients without laryngeal lesions (p < 0.001), those with neurological voice disorders (p = 0.007) and those with voice disorders secondary to gastroesophageal relux (p < 0.001). In the impairment domain, patients with benign vocal fold lesions showed more vocal symptoms than those without laryngeal lesions (p < 0.001) and those with neurological voice disorders (p = 0.002). In the physical domain, patients with benign vocal fold lesions showed more vocal symptoms than patients without laryngeal lesions (p < 0.011). In the physical realm, patients with voice disorders secondary to gastroesophageal relux displayed more vocal symptoms than patients without laryngeal lesions (p = 0.029) (Table 2).
On comparing the mean VoiSS scores of patients with different vocal deviation intensities, differences were observed in the total (p < 0.001) and impairment (p < 0.001) scores (Table 3).
greater number of symptoms than patients with normal vocal quality variability (p = 0.025).
In the post-test situation, we also found that patients with moderate vocal deviation showed a greater number of vocal symptoms in the VoiSS limitation scores than patients with normal vocal quality variability (p < 0.001) and patients with mild-to-moderate vocal deviation (p < 0.001). Based on this score, patients with intense vocal deviation also showed a higher occurrence of vocal symptoms than patients with normal vocal quality variability (p = 0.004) and patients with mild-to-moderate vocal deviation (p = 0.026) (Table 4).
Finally, the VoiSS score was correlated with vocal deviation intensity; a weak positive correlation between total (p < 0.001) and emotional (p < 0.001) scores and vocal deviation and a moderate positive correlation between impairment score and vocal deviation intensity (p < 0.001) were observed (Table 5).
DISCUSSION
Vocal assessment involves auditory-perceptual, acoustic, laryngeal, aerodynamic, and self-assessment aspects; therefore, no single voice assessment measure can provide comprehensive information about the patient’s vocal production and disorder(5).
The integration of different types of data is essential for accurate diagnosis and for planning and monitoring the effectiveness of voice therapy. From this perspective, this study aimed to investigate whether there is an association between the frequency of occurrence of vocal symptoms, vocal deviation intensity, and laryngeal diagnosis in patients with various types of voice disorders.
With respect to the total VoiSS score, it was observed that patients with benign vocal fold lesions had more vocal symptoms than patients without laryngeal lesions, those with
Table 1. Comparison of voice symptoms scale means in the diagnostic groups
Variables
DIAGNOSTIC GROUP
Group 1 Group 2 Group 3 Group 4 Group 5
P value
Mean SD Mean SD Mean SD Mean SD Mean SD
VoiSS – T 36.24 23.84 52.46 24.79 36.46 24.89 50.96 28.11 45.06 27.22 <0.001* VoiSS – L 19.41 13.50 31.37 14.58 21.06 17.00 29.59 17.83 25.97 14.43 <0.001* VoiSS – E 7.97 12.31 9.05 8.68 6.91 7.86 10.22 10.29 9.09 9.48 0.648 VoiSS – P 9.84 6.05 13.54 9.06 9.51 7.02 12.11 7.59 14.88 11.78 0.002*
*Significant values (p < 0.05) – ANOVA test
Caption: Group 1 = patients without laryngeal lesions; Group 2 = patients with benign lesions in the vocal folds; Group 3 = patients with neurological voice disorders; Group 4 = patients with incomplete glottal closure without organic or neurological cause; Group 5 = patients with voice disorders secondary to gastroesophageal reflux; SD = standard deviation; VoiSS = Voice Symptoms Scale; T = total; L = limitation; E = emotional; P = physical
Table 2. Post hoc analysis of voice symptoms scale means in the diagnostic groups
VoiSS Diagnostic group Mean difference Standard error P value
VoiSS-T
Group 1 x Group 2 -16.22 3.4 <0.001*
Group 2 x Group 3 16.01 4.7 0.007*
Group 5 x Group 2 -16.22 3.4 <0.001*
VoiSS-L
Group 1 x Group 2 -11.96 2.01 <0.001*
Group 2 x Group 3 10.31 2.79 0.002*
Group 1 x Group 4 -10.19 3.28 0.017*
VoiSS-P Group 1 x Group 2 -3.70 1.14 0.011*
Group 1 x Group 5 -5.04 1.72 0.029*
*Significant values (p < 0.05) – Tukey’s test
Caption: Group 1 = patients without laryngeal lesions; Group 2 = patients with benign lesions in the vocal folds; Group 3 = patients with neurological voice disorders; Group 4 = patients with incomplete glottal closure without organic or neurological cause; Group 5 = patients with voice disorders secondary to gastroesophageal reflux; VoiSS = Voice Symptoms Scale; T = total; L = limitation; P = physical
Table 3. Comparison of voice symptoms scale means according to vocal deviation intensity
Variables
VOCAL DEVIATION INTENSITY
P value
NVQV Mild/moderate Moderate Intense
Mean SD Mean SD Mean SD Mean SD
VoiSS-T 34.26 19.18 41.39 25.31 54.16 26.54 62.25 27.31 <0.001* VoiSS-L 18.46 12.55 23.24 15.01 32.29 15.63 38.63 15.02 <0.001*
VoiSS-E 7.43 14.93 7.73 8.68 10.58 9.51 12.25 9.16 0.088
VoiSS-P 11.37 8.93 11.92 8.99 12.56 7.11 11.13 7.22 0.858
*Significant values (p < 0.05) – ANOVA test
neurological voice disorders and those with voice disorders secondary to gastroesophageal relux. The presence of benign vocal fold lesions creates disharmony in the biomechanics of vocal production and causes incomplete glottal closure and interference in the vibratory movement of the vocal fold mucosa. This condition often necessitates greater vocal effort and, in general, causes changes in vocal quality, producing roughness and/or breathiness during emission. Changes of this type lead to unpleasant sensations during phonation and complaints relating to voice quality and voice use; this is directly relected in the number of vocal symptoms presented by the patient(15,16), as
observed in this study with regard to the physical and impairment scores. A previous study(17) aiming to investigate vocal tract
discomfort symptoms in patients with various voice disorders also found that patients with benign vocal fold lesions had more symptoms of discomfort than patients without laryngeal lesions, those with neurological voice disorders and those with incomplete glottal closure without organic or neurological cause. A retrospective study(18) performed with patients with
primary and secondary muscle tension dysphonia found that individuals with muscle tension dysphonia secondary to the presence of vocal fold mucosal lesions had three times more discomfort symptoms than patients without laryngeal mucosa changes. Therefore, in general, the presence of benign vocal fold lesions, with consequent biomechanical changes in the vocal production process, seems to result in a higher frequency of vocal symptoms than is found in patients with voice disorders due to other laryngeal conditions.
With respect to the physical and impairment scores, patients with benign vocal fold lesions showed a greater number of symptoms than patients without laryngeal lesions; these patients also reported a greater number of vocal symptoms according to the impairment score than patients with neurological voice disorders. It may be hypothesized that vocal symptoms may be
mild in cases of neurological disease due to the presence and magnitude of other manifestations in such disorders, including those related to swallowing(19,20).
According to the physical score, patients with voice disorders secondary to gastroesophageal relux had more vocal symptoms than patients without laryngeal lesions. The increased number of symptoms in this group of patients may be explained by vocal tract discomfort due to irritation caused by the relux of stomach contents coming into contact with laryngeal and oropharyngeal tissue(21). Some symptoms, such as throat clearing,
pain and/or the feeling of a lump in the throat, are described in the literature(22-24) as being consequences of gastroesophageal
relux. These symptoms are directly related to ive of the seven questions that make up the physical VoiSS score: “Do you cough or clear your throat?” “Is your throat sore?” “Does it feel as if something is stuck in your throat?” “How often do you get throat infections?” “Do you have a lot of phlegm in your throat?”
Another study(25) that examined the relationship between
the type of dysphonia and the presence of vocal symptoms found differences in mean VoiSS impairment, emotional and total scores according to the type of dysphonia, with more symptoms in patients with organic dysphonia, which also includes dysphonia secondary to gastroesophageal relux. However, that study classiied dysphonia into functional, organofunctional and organic using the involvement of vocal behavior in the genesis of the dysphonia as a criterion. The present study, in contrast, grouped patients according to the results of visual laryngeal examination.
With respect to vocal deviation intensity, there was a weak positive correlation between this parameter and total and emotional VoiSS score and a moderate positive correlation with the limitation score. It is understood that the greater the vocal deviation intensity, the higher the total, emotional and limitation VoiSS scores. One study(26) analyzed the correlation between
Table 4. Post hoc analysis of voice symptoms scale means of groups with different vocal deviation intensities
Variables Vocal deviation intensity Mean difference Standard error P value
VoiSS-T
NVQV x MVD -19.90 4.91 <0.001*
NVQV x IVD -27.99 9.87 0.025*
M/MVD x MVD -12.77 3.26 0.001*
VoiSS-L
NVQV x MVD -13.84 2.92 <0.001*
NVQV x IVD -20.17 5.87 0.004*
M/MVD x MVD -9.05 1.94 <0.001*
M/MVD x IVD -15.38 5.45 0.026*
* Significant values (p < 0.05) – Tukey’s test
Caption: VoiSS = Voice symptoms scale; T = total; L = limitation; NVQV = normal vocal quality variability; M/MVD = Mild-to-moderate vocal deviation; MVD = Moderate vocal deviation; IVD = Intense vocal deviation
Table 5. Correlation between voice symptoms scale domains and vocal deviation intensity
Variables VoiSS-T VoiSS-L VoiSS-E VoiSS-P
Correlation P value Correlation P value Correlation P value Correlation P value VAS-OD 0.35 <0.001* 0.40 <0.001* 0.19 0.001* 0.06 <0.293
* Significant values (p < 0.05) – Spearman’s test
vocal deviation intensity evaluated by the Grade, Roughness, Breathiness, Asthenia, Strain (GRBAS) scale and total, limitation and emotional VoiSS scores. There was a positive correlation between the degree of vocal deviation and the total, limitation and emotional VoiSS scores.
Vocal symptoms may be experienced by the individual in many ways, ranging from sensory and/or auditory sensations to deviations in voice quality with the presence of components such as roughness, breathiness and/or tension. These symptoms may be consistent with changes in laryngeal functioning, which can lead to increased vocal effort, the presence of noise during emission and less effective use of the voice in the context of communication(4,27). The weak positive correlation between
total VoiSS score and vocal deviation intensity may therefore be explained by the fact that the VoiSS contains items that include sensory and auditory symptoms, and there is not always a direct relationship between the sensory symptoms presented by the patient and the voice quality deviation perceived by the speech therapist; there is also not always a match between the patient’s perception and the voice disorder as evaluated by the speech therapist.
Studies(28,29) investigating the relationship between
self-assessment of the impact of a voice disorder and voice quality deviation perceived by the speech therapist revealed that auditory-perceptual assessment is not a direct predictor of self-perceived vocal impact. In some cases, the vocal problems of patients with subtle deviations in voice quality have a large impact, whereas some patients with severe voice disorders are minimally impacted by their problem.
With respect to the impairment domain, i.e., the loss of functional performance(30), greater vocal quality deviation
may compromise the social and professional use of the voice. The impairment score relects the communication dificulties experienced by patients because of their voice problems(8), which
explains this study’s inding regarding the moderate positive correlation between the impairment score and the intensity of vocal deviation intensity and conirms that patients with greater vocal deviation intensity may experience greater restriction on the use of their voices(3).
Other studies(25,28) have shown that integration of acoustic,
auditory, laryngeal, and self-assessment information is more evident in patients with greater vocal deviation intensities. The indings of this study show that there is no biunivocal and direct relationship between laryngeal diagnosis, auditory-perceptual assessment, and vocal self-assessment; instead, the different forms of information are complementary in the diagnosis of the patient with a voice disorder.
In short, regarding the auditory-perceptual assessment, patients with more intense vocal quality deviations report greater frequency of vocal symptoms in the impairment score. Based on these indings, it is suggested that studies be conducted in which logistic regression is used to investigate the predictive value of vocal deviation intensity in determining the frequency of occurrence of self-reported vocal symptoms in the different VoiSS domains.
The results of this study allow us to state that the measurement made by the VoiSS is related to the presence of laryngeal changes and voice quality deviation. Therefore, in addition to being the most rigorous and psychometrically robust instrument for vocal self-assessment(6), the VoiSS appears to be an appropriate
instrument for monitoring the patient during therapy, particularly in situations involving benign vocal fold lesions.
CONCLUSION
There is an association between the frequency of occurrence of vocal symptoms, vocal deviation intensity, and laryngeal diagnosis, and differences in VoiSS scores relect differences in laryngeal diagnosis. Patients with benign vocal fold lesions have more vocal symptoms than patients without laryngeal lesions, those with neurological voice disorders, those with voice disorders secondary to gastroesophageal relux and those with neurological voice disorders. Patients with greater vocal deviation intensity have more vocal symptoms in the VoiSS impairment domain. There is a weak positive correlation between vocal deviation intensity and total and emotional VoiSS scores and a moderate positive correlation between limitation VoiSS score and vocal deviation.
REFERENCES
1. Ramig LO, Verdolini K. Treatment efficacy: voice disorders. J Speech
Lang Hear Res. 1998;41(1):101-6. http://dx.doi.org/10.1044/jslhr.4101. s101. PMid:9493749.
2. Baker J. The role of psychogenic and psychosocial factors in the development
of functional voice disorders. J Speech Lang Pathol. 2008;10(4):210-30. http://dx.doi.org/10.1080/17549500701879661. PMid:20840038.
3. Kasama ST, Brasolotto AG. Percepção vocal e qualidade de vida. Pro
Fono. 2007;9(1):19-28. PMid:17461344.
4. Ferreira LP, Santos JG, Lima MFB. Sintoma vocal e sua provável causa: levantamento de dados em uma população. Rev. CEFAC. 2009;11(1):110-8.
http://dx.doi.org/10.1590/S1516-18462009000100015.
5. Dejonckere PH, Bradley P, Clemente P, Cornut G, Buchman LC, Friedrich G, et al. A basic protocol for functional assessment of voice pathology,
especially for investigating the efficacy of (phonosurgical) treatments and evaluating new assessment techniques. Eur Arch Otorhinolaryngol. 2001;258(2):77-82. http://dx.doi.org/10.1007/s004050000299. PMid:11307610.
6. Branski RC, Cukier-Blaj S, Pusic A, Cano SJ, Klassen A, Mener D, et al. Measuring quality of life in dysphonic patients: a systematic review of content development in patient-reported outcomes measures. J Voice. 2010;24(2):193-8. http://dx.doi.org/10.1016/j.jvoice.2008.05.006.
PMid:19185454.
7. Behlau M, Couto EB Jr, Paulinelli BR, Santos LMA, Oliveira G, Moreti F, Madazio G. Eficiência e valores de corte de protocolos de autoavaliação do
impacto de problemas de voz. In: 21° Congresso Brasileiro de Fonoaudiologia; 2013 Set 22-25; Porto de Galinhas. Anais. Porto de Galinhas: Sociedade
8. Deary IJ, Wilson JA, Carding PN, MacKenzie K. MacKenzieK. VoiSS: a patient-derived Voice Symptom Scale. J Psychosom Res. 2003;54(5):483-9. http://dx.doi.org/10.1016/S0022-3999(02)00469-5. PMid:12726906.
9. Moreti FT, Zambon F, Oliveira G, Behlau M. Equivalência cultural da versão brasileira da Voice Symptom Scale – VoiSS. J Soc Bras Fonoaudiol. 2011;23(4):398-400. http://dx.doi.org/10.1590/S2179-64912011000400018. PMid:22231064.
10. Verdolini K, Ramig LO. Review: occupational risks for voice problems. Logoped Phoniatr Vocol. 2001;26(1):37-46. http://dx.doi.org/10.1080/14015430119969. PMid:11432413.
11. Coyle SM, Weinrich BD, Stemple JC. Shifts in relative prevalence of laryngeal pathology in a treatment-seeking population. J Voice. 2001;15(3):424-40. http://dx.doi.org/10.1016/S0892-1997(01)00043-1. PMid:11575638.
12. Cohen SM, Pitman MJ, Noordzij JP, Courey M. Management of Dysphonic Patients by Otolaryngologists. Otolaryngol Head Neck Surg. 2012;147(2):289-94. http://dx.doi.org/10.1177/0194599812440780. PMid:22368039. 13. Behlau M, Oliveira G, Madazio G, Yamasaki R. Speech language pathology
and voice specialist in Brazil: an overview. In: Yiu EM-L. International perspectives on voice disorders. Salisbury: Multilingual Matters; 2013. p. 9-30.
14. Roy N, Barkmeir-Kraemer J, Eadie T, Sivasankar MP, Metha D, Paul D, et al. Evidence-based clinical voice assessment: a systematic review. Am J Speech Lang Pathol. 2013;22(2):212-26. http://dx.doi.org/10.1044/1058-0360(2012/12-0014). PMid:23184134.
15. Gunter HE. Modeling mechanical stresses as a factor in the etiology of benign vocal fold lesions. J Biomech. 2004;37(7):1119-24. http://dx.doi. org/10.1016/j.jbiomech.2003.11.007. PMid:15165883.
16. Houte EV, Lierde KV, Claeys S. Pathophysiology and treatment of muscle tension dysphonia: a review of the current knowledge. J Voice. 2011;25(2):202-7. http://dx.doi.org/10.1016/j.jvoice.2009.10.009. PMid:20400263.
17. Lopes LW, Cabral GF, Almeida AAF. Vocal tract discomfort symptoms in patients with different voice disorders. J Voice. 2014:1-7. PMid:25499523.
18. Mathieson L. Vocal tract discomfort in hyperfunctional dysphonia. J Voice. 1993;2:40-8.
19. Pauw AD, Dejaeger E, D’hooghe B, Carton H. Dysphagia in multiple sclerosis. Clin Neurol Neurosurg. 2002;104(4):345-51. http://dx.doi. org/10.1016/S0303-8467(02)00053-7. PMid:12140103.
20. Volonte MA, Porta M, Comi G. Clinical assessment of dysphagia in early phases of Parkinson’s disease. Neurol Sci. 2002;23(3, Suppl 2):121-2. http://dx.doi.org/10.1007/s100720200099. PMid:12548373.
21. Koufman J, Amin M, Panetti M. Prevalence of reflux in 113 consecutive patients with laryngeal and voice disorders. Otolaryngol Head Neck
Surg. 2000;123(4):385-8. http://dx.doi.org/10.1067/mhn.2000.109935. PMid:11020172.
22. Remacle M, Lawson G. Diagnosis and management of laryngopharyngeal reflux disease. Curr Opin Otolaryngol Head Neck Surg. 2006;14(3):143-9. http://dx.doi.org/10.1097/01.moo.0000193189.17225.91. PMid:16728890.
23. Kotby MN, Hassan O, El-Makhzangy AM, Farahat M, Milad P. Gastroesophageal reflux/laryngopharyngeal reflux disease: a critical analysis of the literature. Eur Arch Otorhinolaryngol. 2010;267(2):171-9. http://dx.doi.org/10.1007/ s00405-009-1176-4. PMid:20033194.
24. Ozturk O, Oz F, Karakullukcu B, Oghan F, Guclu E, Ada M. Hoarseness and laryngopharyngeal reflux: a cause and effectrelationship or coincidence? Eur Arch Otorhinolaryngol. 2006;263(10):935-9. http://dx.doi.org/10.1007/ s00405-006-0097-8. PMid:16816932.
25. Moreti F, Zambon F, Behlau M. Sintomas vocais e autoavaliação do desvio
vocal em diferentes tipos de disfonia. CoDAS. 2014;26(4):331-3. http:// dx.doi.org/10.1590/2317-1782/201420130036. PMid:25211694. [English].
26. Jones SM, Carding PN, Drinnan MJ. Exploring the relationship between severity of dysphonia and voice-related quality of life. Clin Otolaryngol. 2006;31(5):411-7. http://dx.doi.org/10.1111/j.1749-4486.2006.01291.x. PMid:17014451.
27. Deary IJ, Wilson AJ, Carding PN, MacKenzie K, Watson R. From dysphonia to dysphoria: Mokken scaling shows a strong, reliable hierarchy of voice symptoms in the Voice Symptom Scale questionnaire. J Psychosom Res. 2010;68(1):67-71. http://dx.doi.org/10.1016/j.jpsychores.2009.06.008. PMid:20004302.
28. Behrman A, Sulica L, He T. Factors predicting patient perception of dysphonia caused by benign vocal fold lesions. Laryngoscope. 2004;114(10):1693-700.
http://dx.doi.org/10.1097/00005537-200410000-00004. PMid:15454756.
29. Hummel C, Scharf M, Schuetzenberger A, Graessel E, Rosanowski F. Objective voice parameters and self-perceived handicap in dysphonia. Folia Phoniatr Logop. 2010;62(6):303-7. http://dx.doi.org/10.1159/000287715. PMid:20668386.
30. Scott S, Robinson K, Wilson JA, Mackenzie K. Patient-reported problems associated with dysphonia. Clin Otolaryngol Allied Sci. 1997;22(1):37-40. http://dx.doi.org/10.1046/j.1365-2273.1997.00855.x. PMid:9088677.
Author contributions