TCD
5, 2279–2318, 2011Cornice dynamics and meteorological
control
S. Vogel et al.
Title Page
Abstract Introduction
Conclusions References
Tables Figures
◭ ◮
◭ ◮
Back Close
Full Screen / Esc
Printer-friendly Version Interactive Discussion
Discussion
P
a
per
|
Dis
cussion
P
a
per
|
Discussion
P
a
per
|
Discussio
n
P
a
per
The Cryosphere Discuss., 5, 2279–2318, 2011 www.the-cryosphere-discuss.net/5/2279/2011/ doi:10.5194/tcd-5-2279-2011
© Author(s) 2011. CC Attribution 3.0 License.
The Cryosphere Discussions
This discussion paper is/has been under review for the journal The Cryosphere (TC). Please refer to the corresponding final paper in TC if available.
Cornice dynamics and meteorological
control at Gruvefjellet, Central Svalbard
S. Vogel1,2, M. Eckerstorfer1,2, and H. H. Christiansen1,2
1
Arctic Geology Department, The University Centre in Svalbard, Longyearbyen, Norway
2
Department of Geosciences, University of Oslo, Oslo, Norway
Received: 29 June 2011 – Accepted: 8 August 2011 – Published: 25 August 2011 Correspondence to: S. Vogel ([email protected])
TCD
5, 2279–2318, 2011Cornice dynamics and meteorological
control
S. Vogel et al.
Title Page
Abstract Introduction
Conclusions References
Tables Figures
◭ ◮
◭ ◮
Back Close
Full Screen / Esc
Printer-friendly Version Interactive Discussion
Discussion
P
a
per
|
Dis
cussion
P
a
per
|
Discussion
P
a
per
|
Discussio
n
P
a
per
|
Abstract
Cornice fall avalanches endanger life and infrastructure in Nybyen, a part of Svalbard’s
main settlement Longyearbyen, located at 78◦N in the High Arctic. Thus, cornice
dy-namics – accretion, cracking and eventual failure – and their controlling meteorological factors were studied along the ridgeline of the Gruvefjellet plateau mountain above
Ny-5
byen in the period 2008–2010. Using two automatic time-lapse cameras and hourly meteorological data in combination with intensive field observations on the Gruvefjellet plateau, cornice process dynamics were investigated for larger detail than previously possible. Cornice accretion starts directly following the first snowfall in late September and October, and proceeds throughout the entire snow season under a wide range of
10
air temperature conditions that the maritime winter climate of Svalbard provides. Cor-nice accretion is particularly controlled by distinct storm events, with a prevailing wind
direction perpendicular to the ridge line and average wind speeds from 12 m s−1.
Par-ticularly high wind speeds in excess of 30 m s−1 towards the plateau ridgeline lead to
cornice scouring and reduce the cornice mass both vertically and horizontally. Induced
15
by pronounced air temperature fluctuations, tension cracks develop between the cor-nice mass and the plateau. Our measurements indicate a linear crack opening due to snow creep and tilt of the cornice around a pivot point. Four to five weeks elapsed be-tween the first observations of a cornice crack until cornice failure. Throughout the two snow seasons studied, 180 cornice failures were recorded, of which 70 failures were
20
categorized as distinctive cornice fall avalanches. A clear temporal pattern with the majority of cornice failures in June was found. Thus only daily air temperature could determine avalanche from non-avalanche days. Seven large cornice fall avalanches reached the avalanche fans on which the Nybyen settlement is located. The size of the avalanches was primarily determined by the size of the cornice that detached. The
25
TCD
5, 2279–2318, 2011Cornice dynamics and meteorological
control
S. Vogel et al.
Title Page
Abstract Introduction
Conclusions References
Tables Figures
◭ ◮
◭ ◮
Back Close
Full Screen / Esc
Printer-friendly Version Interactive Discussion
Discussion
P
a
per
|
Dis
cussion
P
a
per
|
Discussion
P
a
per
|
Discussio
n
P
a
per
1 Introduction
1.1 Motivation and scope of the study
Cornices are broadly defined as wedge-like projections of snow formed by wind depo-sition on the lee side of a ridgeline or slope inflection (Latham and Montagne, 1970; Montagne et al., 1968). Cornices and their dynamics have attracted the curiosity and
5
concern of both scientists and mountaineers in the past, due to their particular shapes
and their ability to trigger avalanches when breaking off(Latham and Montagne, 1970).
However, there has been surprisingly little modern research on cornices and their dy-namics. By developing and running a full year observation programme, we have been able to study the processes leading to cornice failures in great detail. In the study area
10
in Svalbard cornices form every winter along the lee edges of extensive plateau moun-tains. We have chosen to study the cornices along the plateau mountain Gruvefjellet bordering the valley Longyeardalen, where Longyearbyen, Svalbard’s main settlement, is located, and most people live in this archipelago.
Cracks develop between the plateau and the main cornice mass, leading to a
detach-15
ment and eventually failure of the cornices as cornice fall avalanches. This process causes a natural hazard to the infrastructure and people living right underneath the slope. Today, there is no protection measure in place in the Nybyen study area. Cornice fall avalanches have destroyed cultural heritage on the slopes in the Longyeardalen val-ley in recent years. We have thus monitored and analysed cornice accretion, cracking
20
and failure along the edge of the plateau mountain, and their controlling meteorological and topographical factors in the 2008–2010 period. This study forms the first com-prehensive investigation of cornice formation and failure carried out in a High Arctic landscape. Our goal is to provide increased geomorphological understanding of cor-nice dynamics, and thereby also improving the predictability of corcor-nice fall avalanches.
TCD
5, 2279–2318, 2011Cornice dynamics and meteorological
control
S. Vogel et al.
Title Page
Abstract Introduction
Conclusions References
Tables Figures
◭ ◮
◭ ◮
Back Close
Full Screen / Esc
Printer-friendly Version Interactive Discussion
Discussion
P
a
per
|
Dis
cussion
P
a
per
|
Discussion
P
a
per
|
Discussio
n
P
a
per
|
1.2 Earlier cornice studies
Due to the general scarcity of studies on cornice formation and failure, no
comprehen-sive overview exists. There are, however, a few very detailed basic studies on different
parts of the cornice formation process. Major fundamental work on cornices was car-ried out by Paulcke and Welzenbach in the 1920’s in the European Alps (Paulcke and
5
Welzenbach, 1928; Welzenbach, 1930), where they trenched cornices to accurately
define the stratigraphy, as well as to distinguish between different kinds of cornices
due to their formation (suction vs. pressure cornices), duration (permanent vs. tempo-rary), topographical position (ridge vs. plateau), as well as the topographical control on cornice development. Furthermore they described the process of involution, and
10
thereby the formation of roll cavities (Fig. 1) inside the cornices – a term later intro-duced by Montagne et al. (1968). Seligman (1936) translated the most technical terms invented by Paulcke and Welzenbach into English, and found varying cornice develop-ment depending on the inclination of the lee slope. Montagne et al. (1968) focussed on deformation processes inside the cornice mass, attributing creep and glide
pro-15
cesses to the opening of tension fractures between the cornice mass and the ridgeline bedrock. Their studies followed work mainly on cornice accretion processes. Besides initial binding of the snow crystals by mechanical interlocking, the refreezing of a liq-uid water layer due to frictional contact and pressure melting at temperature close to
0◦C as well as the importance of electrical forces in the adhesion process were
in-20
vestigated by Latham and Montagne (1970). These authors concluded that all three suggested mechanisms might contribute to the development of snow cornices. Naruse et al. (1985) compared mean grain diameter, bulk density and hardness of the sur-face layer (0.05–0.15 m) along the cornice root and roof as well as the scarp (Fig. 1). These were found to be largest at the cornice root and roof as a result of sorting of
25
TCD
5, 2279–2318, 2011Cornice dynamics and meteorological
control
S. Vogel et al.
Title Page
Abstract Introduction
Conclusions References
Tables Figures
◭ ◮
◭ ◮
Back Close
Full Screen / Esc
Printer-friendly Version Interactive Discussion
Discussion
P
a
per
|
Dis
cussion
P
a
per
|
Discussion
P
a
per
|
Discussio
n
P
a
per
and conducted density, strength, temperature, and physical properties profiles. Irre-spective of the short observation period, the study demonstrated the quick response of the cornice to changes in meteorological conditions. Kobayashi et al. (1988) analyzed the formation processes of snow cornices in an experimental trench and calculated a
collection coefficients in the range of 2 % to 50 % of windblown snow particles at the
5
newly forming cornice as well as along a mountain ridge. Burrows and McClung (2006) distinguished meteorologically-related triggers of cornice failure: loading of the cornice by additional snow (precipitation or wind), distinctive temperature changes due to air temperature changes, rain-on-snow events or direct insolation.
2 Study area
10
2.1 Geology and geomorphology
Longyearbyen (78◦N, 15◦E), Svalbard’s main settlement is situated in the valley
Longyeardalen, in the central part of the archipelagos main island Spitsbergen in the High Arctic (Fig. 2). Longyeardalen extends NE-SW, delimited by two large plateau mountains, Plat ˚aberget and Gruvefjellet to the W and E respectively (Fig. 2). The
15
extensive plateaus consists of close to horizontal bedded Tertiary sedimentary rock (Major et al., 2001), into which Quaternary glaciations have eroded Longyeardalen. Svalbard lies in the continuous permafrost zone. The thickness ranges from approxi-mately 100 m in valley bottoms and up to 400–500 m in mountain areas. Permafrost at sea level is of late Holocene age (approximately 3000 yr) and possibly 700 kyr in high
20
altitude areas (Humlum et al., 2003). The cornice study site contains a 220 m rela-tively sharp plateau ridgeline (about 460 m a.s.l) dividing the extensive three kilometre wide blockfields of the horizontal Gruvefjellet plateau from the steep underlying slope of Gruvefjellet (Fig. 2). The slope section below the ridgeline consists of an about 50–
70 m high vertical free rock face, which below continues into a 55–60◦ steep slope at
25
TCD
5, 2279–2318, 2011Cornice dynamics and meteorological
control
S. Vogel et al.
Title Page
Abstract Introduction
Conclusions References
Tables Figures
◭ ◮
◭ ◮
Back Close
Full Screen / Esc
Printer-friendly Version Interactive Discussion
Discussion
P
a
per
|
Dis
cussion
P
a
per
|
Discussion
P
a
per
|
Discussio
n
P
a
per
|
French (2007). Rock outcrops in the middle part of the slope subdivide the cornice funnels into five distinctive avalanche paths, which reach down to the foot of the slope. The lower part of the valley side/slope consists of talus cones derived from rock fall and avalanche fans built from avalanche sedimentation, which are both reworked by debris flows (Larsson, 1982) (Fig. 2). Seventeen houses accommodating more than
5
200 people are located on the basal concavity on the avalanche derived fans (Fig. 2).
2.2 Climate and meteorology
The climate of Svalbard is characterized as an ET polar tundra climate according to the Koeppen-Geiger climate classification (Kottek et al., 2006). Svalbard is situated in a pathway of heat and moisture transport to the Arctic, thus the climate is
sensi-10
tive to changes and warmer than generally expected for the high latitude (Førland et al., 1997; Rogers et al., 2005). Svalbard’s climate is mainly influenced by the interac-tion of the Icelandic Low with a high pressure over Greenland (Hanssen-Bauer et al., 1990). Thus typically in winter cold anti-cyclonic air masses extend to Svalbard from the north, alternating with low-pressure systems bringing warm and moist air masses
15
due to meridional moisture transport along the North Atlantic cyclone track (Dickson et al., 2000).
The 1912–2010 annual air temperature average in Longyearbyen at sea level is
−6◦C, being almost 2◦C colder than the mean annual air temperature (MAAT) of
−4.1◦C in 2010 (Met.no, 2011) recorded at the official meteorological station Lufthavn
20
at 28 m a.s.l. (Fig. 2). 2008 with−4◦C and 2009 with−3.7◦C MAAT were as well also
both warmer. At the Gruvefjellet meteorological station at 464 m a.s.l. on the central part of the Gruvefjellet plateau, 300 m from the study site (Fig. 2), the MAAT in 2010
was−6.7◦C, with almost the same values in 2008−6.7◦C and in 2009 −6.1◦C. The
mean snow season air temperature (MSSAT, 1 October–31 July) at Gruvefjellet was
25
−8.7◦C in 2008/2009 and−6.8◦C in 2009/2010, while it was−6.2◦C in 2008/2009 and
TCD
5, 2279–2318, 2011Cornice dynamics and meteorological
control
S. Vogel et al.
Title Page
Abstract Introduction
Conclusions References
Tables Figures
◭ ◮
◭ ◮
Back Close
Full Screen / Esc
Printer-friendly Version Interactive Discussion
Discussion
P
a
per
|
Dis
cussion
P
a
per
|
Discussion
P
a
per
|
Discussio
n
P
a
per
Mean annual precipitation (MAP) at sea level (Lufthavn) in 2010 was 187 mm water equivalent (w.e.), the average of 1912–2010 was 196 mm w.e. (Met.no, 2011). MAP rates in 2008 were 200 mm and 153 mm in 2009 at the same site. Precipitation data from higher grounds do not exist. However, modelling results from Humlum (2002) suggest a vertical precipitation gradient with a 100 % upward correction factor. Since
5
most of the precipitation falls as snow, accurate measurements in a landscape devoid of high vegetation are challenging.
Average snow season wind speed at Gruvefjellet was 4 m s−1 in 2008/2009 and
3.9 m s−1 in 2009/2010, with maximum wind speeds in both seasons exceeding
25 m s−1 for shorter periods. Due to its constancy and the landscape being devoid
10
almost of any vegetation, the wind freely redistributes snow in the landscape. While exposed parts of the landscape remain snow free for most of the winter, lee sides ac-cumulate up to several meters of snow (Jaedicke and Gauer, 2005). The snowpack in the study area is generally thin and hard, characterised by wind slabs and ice lay-ers (Ecklay-erstorfer and Christiansen, 2011a). The prevailing winter wind direction in the
15
2008–2010 periods was from the SE. Local wind directions vary due to topographical
channelling effects (Humlum, 2002). However, on the study site the overall regional
wind is dominating due to the wide Gruvefjellet plateau area, which enables extensive snow drifting and thus allowing cornice accretion.
3 Methods
20
The cornice development was studied during the two consecutive snow seasons 2008/2009 and 2009/2010. “Snow season” here refers to the duration of cornices along the Gruvefjellet plateau edge, lasting from the beginning of October until the end of July typically. During both snow seasons, 45 field trips up to the cornice site on the Gruvefjellet plateau were carried out (Fig. 3), as well as very frequent field
investi-25
TCD
5, 2279–2318, 2011Cornice dynamics and meteorological
control
S. Vogel et al.
Title Page
Abstract Introduction
Conclusions References
Tables Figures
◭ ◮
◭ ◮
Back Close
Full Screen / Esc
Printer-friendly Version Interactive Discussion
Discussion
P
a
per
|
Dis
cussion
P
a
per
|
Discussion
P
a
per
|
Discussio
n
P
a
per
|
Gruvefjellet slope was becoming continuous. Furthermore the beginning of the twilight period at the end of the polar night allows good enough detailed visual observations and measurements.
3.1 Automatic time-lapse photography observations
Two automatic digital time-lapse cameras were used to monitor directly, on an at least
5
daily basis, cornice development and failure. Both cameras were standard digital cam-eras, equipped with a Harbortronics DigiSnap 2000 time-lapse controller and a solar panel mounted on top of a weather-proof box, in which the camera and the entire set up was stored. A plastic window in front of the camera allowed the photographing from in-side the box. Solar panels recharged a 12 V battery, which provided energy during the
10
entire polar night and twilight period without charging. The photographs were stored as jpg-files on regular memory-SD cards, which were checked and changed at least every 2–4 weeks. Christiansen (2001) pointed out that automatic cameras provide ad-ditionally general weather information useful for understanding the process dynamics investigated specifically.
15
One camera “Gruve-cam” was placed perpendicular to the edge at the end of the cornice site (Fig. 2), photographing accretion, scouring and cracking as well as snow depth and general snow distribution, twice a day. As a consequence of the camera position and resolution, most detailed observations were restricted to a short range of about 50–100 m, thus only a portion of the cornice site. To quantify changes in snow
20
depth, a snow stake with a 5 cm scale was located along the ridge about 15 m in front of the camera at the transition of the plateau to the cornice root. Snow stakes were first installed 11 February 2009, and readings could be done until 8 June 2009, with
an accuracy of ±5 cm. After the reinstallation of the snow measurement stake, less
than 10 m away from the “Gruve-cam”, snow depth readings could be done with an
25
increased accuracy of±2 cm in the snow season 2009/2010. Furthermore nine stakes
TCD
5, 2279–2318, 2011Cornice dynamics and meteorological
control
S. Vogel et al.
Title Page
Abstract Introduction
Conclusions References
Tables Figures
◭ ◮
◭ ◮
Back Close
Full Screen / Esc
Printer-friendly Version Interactive Discussion
Discussion
P
a
per
|
Dis
cussion
P
a
per
|
Discussion
P
a
per
|
Discussio
n
P
a
per
visually determine the nature of deformation by a tilting of the stakes due to snow creep. Photographs were unfortunately not collected between 28 April–16 May, 2 June–9 June and 6 September–1 November in 2009 due to technical operational camera problems (Fig. 3). In the 2010 period 18 March–6 May, a malfunction of the battery not being recharged by the solar panel prevented collection of photographs (Fig. 3).
5
The other camera “Sverdrup-cam” was placed on the opposite side of Longyeardalen on an artificial stockpile, taking up to six daily photographs during the main avalanche season of the entire Gruvefjellet slope above Nybyen from 1100 m distance (Fig. 2). The high resolution of the DSLR camera enabled monitoring of all cornice failures of the study site in great detail, for improved directly linking to the meteorological
con-10
ditions. The failures were assigned to one of the five major gullies (Fig. 2), and the recorded picture time of the automatic camera was taken as event timing if there were no eyewitnesses to give directly the time of the avalanche. In general, light conditions during the polar night, snowstorms or temporary snow accumulation in front of the
camera lens affected this method negatively.
15
The magnitude of each cornice failure was determined by two values – the destruc-tiveness (“D”) and the size relative to the given slope (“R”) (Greene et al., 2004). The
“D” value describes the destructive potential of an avalanche from the mass of
de-posited snow, applied to an object (person, car, trees) located in the avalanche track or
at the beginning of the runout zone. The “R” value estimates the size of an avalanche
20
relative to the particular avalanche path length. “R1” and “R2” avalanches display small failures that ran out just below the free face or reaching down between the rock noses, respectively. “R3” avalanches ran down below the rock noses to the upper part of the avalanche fans. “R4” avalanches represent large cornice fall avalanches that reached the low inclined terrain on the lower part of the avalanche fans, indicated by the red
25
TCD
5, 2279–2318, 2011Cornice dynamics and meteorological
control
S. Vogel et al.
Title Page
Abstract Introduction
Conclusions References
Tables Figures
◭ ◮
◭ ◮
Back Close
Full Screen / Esc
Printer-friendly Version Interactive Discussion
Discussion
P
a
per
|
Dis
cussion
P
a
per
|
Discussion
P
a
per
|
Discussio
n
P
a
per
|
3.2 Cornice crack width measurements
Cornice crack measurements were conducted during the field visits once cracks started to open between the plateau and the cornice mass. Three series of cornice crack mea-surements with a total number of 29 readings were carried out in both snow seasons (Fig. 3). As a consequence of the appearance of cornice cracks, the three series of
5
measurements were not conducted at the same cornice section. The setup consisted of two stakes, one installed on the plateau as the reference point, and one in the cor-nice mass, approximately 0.5 m away from the crack on the corcor-nice side. By repeated distance measurements stretching a rope permanently attached to the cornice stake, the relative opening of the cornice cracks was determined. This enabled easy manual
10
recordings not causing any surface disturbance to the cornice root and roof except for the first installation. In the third series of measurements, the two stakes were also equipped with a scale to determine local relative variations in snow depth, and thus to investigate the influence of periods of cornice accretion and scouring on the cornice crack opening.
15
4 Results
Using the presented combination of methods we have been able to collect data that describe the complete cornice development process from accretion and scouring, to cracking, tilting of the cornice mass and eventual failure.
4.1 Cornice accretion and scouring
20
TCD
5, 2279–2318, 2011Cornice dynamics and meteorological
control
S. Vogel et al.
Title Page
Abstract Introduction
Conclusions References
Tables Figures
◭ ◮
◭ ◮
Back Close
Full Screen / Esc
Printer-friendly Version Interactive Discussion
Discussion
P
a
per
|
Dis
cussion
P
a
per
|
Discussion
P
a
per
|
Discussio
n
P
a
per
or even discontinuous snow cover until December. Periods of cornice accretion were identified by quantitative comparison of the time-lapse photographs in combination with the hourly meteorological data. Cornice accretion proceeded during both entire snow
seasons, when wind speeds averaged 12 m s−1, with a minimum of at least 10 m s−1,
marking the lower limit of cornice accretion (Fig. 4). On average the storm duration
5
was about 46 h in the snow season 2008/2009 and 54 h in 2009/2010 with minimum periods of in excess of 10 h in both seasons.
The prevailing wind direction during cornice accretion was very narrow at 120◦,
±5◦ (Fig. 4), almost perpendicular to the NNE-SSW orientated ridgeline (Fig. 2), whereas it
varied much more 125–250◦for non-accretion periods. Cornice accretion events were
10
not influenced by air temperature. Figure 4 shows that even at air temperatures slightly above freezing, cornice accretion took place. This happened as a direct response to new snowfall on top of the cornice, even though the snow cover on the main plateau was already discontinuous close to the end of the snow season. In both snow seasons the last cornice remnants melted away along the Gruvefjellet plateau edge towards the
15
end of July. Thus, the cornices on Gruvefjellet are annual and temporary phenom-ena with a clear seasonal cycle (Paulcke and Welzenbach, 1928; Welzenbach, 1930; Seligman, 1936).
Despite the lack of direct precipitation data the increased measured wind speed, and bad visibility due to snow drifting in front of the automatic camera during accretion
20
events, clearly show that snowstorms largely accounted for accretion. Each accretion event added one or more snow layers onto the cornice mass. These wedge-like lay-ers were initially bedded horizontally with a steeply inclined accretion face. Gradually the leading edge (Fig. 1) and consequently the entire cornice crept downwards, par-ticularly under the load of successive accretion layers or air temperatures close to or
25
TCD
5, 2279–2318, 2011Cornice dynamics and meteorological
control
S. Vogel et al.
Title Page
Abstract Introduction
Conclusions References
Tables Figures
◭ ◮
◭ ◮
Back Close
Full Screen / Esc
Printer-friendly Version Interactive Discussion
Discussion
P
a
per
|
Dis
cussion
P
a
per
|
Discussion
P
a
per
|
Discussio
n
P
a
per
|
have been observed along them.
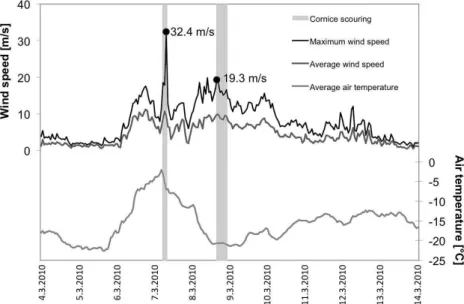
Besides involution of the cornice and general snow settlement of the cornice mass, cornice scouring accounted for observable horizontal and vertical shrinking. Only two scouring events were identified, both occurred in the second snow season in the be-ginning of March (Fig. 5). During a snowstorm on 7 March 2010, cornice scouring was
5
observed over a period of three hours with maximum wind gusts up to 32.4 m s−1,
how-ever, with winds from the S to SW. With this wind direction the strong winds blew almost straight towards the plateau edge, thus enabling scouring and not accretion. A total ver-tical reduction of 4 cm was recorded at the cornice root. With our study set-up it was not possible to quantify the variations in the horizontal extent of the cornices. Though,
10
by comparison of the automatic photographs, significant shortening was determined as a consequence of the scouring events. The second scouring period occurred just one day later, lasting over 7 h, reducing the cornice mass again by 4 cm vertically. The
hourly maximum wind gusts were between 15–19 m s−1, and thus significantly lower
than the previous event. Similarly, the wind direction was towards the plateau edge
15
varying from WNW and NW. Both events took place during very different, but negative
air temperature conditions (Fig. 5), which does thus not seem to affect the scouring
process.
4.2 Cornice cracking and tilting
Several cornice tension cracks between the plateau and the main cornice mass were
20
observed in both snow seasons at the study site and the adjacent areas. Our time lapse photography showed that a slight depression in connection with a bulge in the cornice root, followed by initial tilting of the cornice mass occurred in most cases before tension cracks appeared (Fig. 6a, b). These cornice cracks formed mostly at the transition from the shallow snowpack on the plateau to the inner part of the thicker cornice snow
25
TCD
5, 2279–2318, 2011Cornice dynamics and meteorological
control
S. Vogel et al.
Title Page
Abstract Introduction
Conclusions References
Tables Figures
◭ ◮
◭ ◮
Back Close
Full Screen / Esc
Printer-friendly Version Interactive Discussion
Discussion
P
a
per
|
Dis
cussion
P
a
per
|
Discussion
P
a
per
|
Discussio
n
P
a
per
the cracks, lateral tension cracks developed at an obtuse angle to the initial cracking, forming a pronounced C-shape. This was contemporaneous with an upwards lifting of the inner and upper cornice mass (Fig. 6d). The cornice tilted around a fixed pivot point (Fig. 6e), which caused an even opening of the crack until the cornice mass displayed a very steep, close to vertical position (Fig. 6e). Thereby, parts of the cornice were lifted
5
above its initial position along the plateau edge. Small failures progressively rounded the former leading edge and roll face, the majority of which occurred particularly along the roll cavities (Figs. 1 and 6d, e). These small failures also eroded the cornice scarp and pillow successively (Fig. 6e). The central cornice mass detached from the ridgeline in some cases, exposing cracks up to 3–4 m wide.
10
The most comprehensive cornice crack width distance measurements lasted from 24 March 2010 until 23 June 2010 (Fig. 7). At this site we combined the crack width distance measurements with the relative variation in snow depth, obtained from the two measurement stakes on the plateau and on the cornice (Fig. 7). The cornice crack was already open when the instrumentation was installed; we thus monitored the
15
relative opening of the cornice crack. The first two measurements indicated, however, a reduction of the crack opening by 20 cm over 22 days. Since we did not observe any actual closing of the crack, we explain this as a slight backward tilting of the cornice mass causing a reduction in the measured distance between the cornice stake and
the plateau stake. The onset of melting affected the position of both measurement
20
stakes inserted into the snow during the last measurements, leading to stagnant width measurements. In the remaining 51-day period between 16 April and 6 June 2010, a total cornice opening distance of 22 cm was measured, resulting in a widening average
of 0.43 cm day−1. Regardless of air temperature fluctuations, the crack widening was
almost linear (Fig. 7). Relative variation in snow depths on each site of the crack
25
influenced the measurement to some extent. For example, between 23 and 28 April
2010 the highest cornice crack opening rate of this series of 0.8 cm day−1was recorded
TCD
5, 2279–2318, 2011Cornice dynamics and meteorological
control
S. Vogel et al.
Title Page
Abstract Introduction
Conclusions References
Tables Figures
◭ ◮
◭ ◮
Back Close
Full Screen / Esc
Printer-friendly Version Interactive Discussion
Discussion
P
a
per
|
Dis
cussion
P
a
per
|
Discussion
P
a
per
|
Discussio
n
P
a
per
|
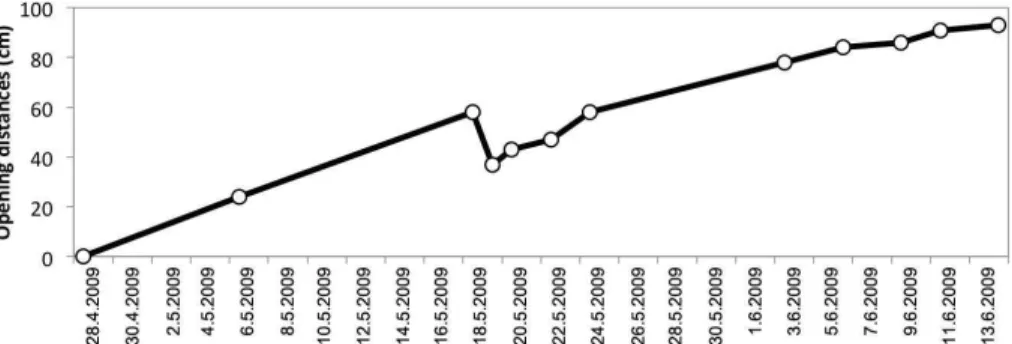
cornice crack still opened linearly (Fig. 7). The linear opening rate, independent of snow depth and air temperature conditions clearly indicate, that after crack opening, the cornice mass was tilting due to constant snow creep and deformation of the cornice. The first series of measurements in the snow season 2008/2009 also showed a pro-nounced linear cornice crack opening. During the 38 day observation period between
5
28 April and 6 June 2009, a cornice crack opened to a width of 105 cm. This resulted
in an opening of on average 2.76 cm day−1 (Fig. 8). On 19 May 2009 a reduction of
21 cm to the previous day was measured. This was caused by a surface perturba-tion, where the upper most layer of the tilted cornice part crept slightly towards the
plateau, which affected the measurement stake. The ensuing measurements indicated
10
the same opening rate as prior to the perturbation.
The highest cornice crack opening rate of 8.6 cm day−1was measured in a short
se-ries between 5 and 10 February 2010. This sese-ries ended with an entire cornice failure. This was in contrast to the long lasting series of measurements, when melting condi-tions towards the end of the snow season prevented further accurate measurements.
15
In the snow season 2009/2010 the development of four cornice cracks until failure was observed in the “Gruve Cam” field of view. Thus we were able to follow the entire cornice development from cracking and widening, to downward folding of the entire cornice mass (Fig. 6d) and eventually cornice failure (Fig. 9). In two of these fail-ures we also observed initial cornice tilting (Fig. 6b), prior to the initial opening of the
20
cornice cracks. Both initial tilting and crack opening occurred as a consequence of low-pressure systems passing Svalbard, causing snowstorms with increasing air tem-peratures (Fig. 9) allowing significant deformation. After two weeks of initial tilting, the cornice cracks appeared open and a constant widening was observed for three and six weeks respectively, under varying meteorological conditions (Fig. 9). Outside the
cam-25
TCD
5, 2279–2318, 2011Cornice dynamics and meteorological
control
S. Vogel et al.
Title Page
Abstract Introduction
Conclusions References
Tables Figures
◭ ◮
◭ ◮
Back Close
Full Screen / Esc
Printer-friendly Version Interactive Discussion
Discussion
P
a
per
|
Dis
cussion
P
a
per
|
Discussion
P
a
per
|
Discussio
n
P
a
per
cornice cracks did not necessary lead to cornice failure and vice versa.
4.3 Cornice failure
In total 180 cornice failures were observed in the two snow seasons that were in-vestigated (Fig. 10). There is a clear temporal pattern observable, with the majority releasing between May to the end of June (Fig. 10). By then, full-developed cornices
5
were able to crack and tilt through a period of time before failure. Besides entire cor-nice fall avalanches, the majority of the late season failures were mostly only collapses of cornice parts, like scarps or pillows, (Fig. 6), or the release of lateral remnants of cracked cornices. Additionally the leading edge and accretion face of cracked and tilted cornices failed in relatively small pieces, leading to a rounding of the cornice mass
10
(Fig. 6e). The temporal distribution of cornice failures differed somewhat between the
two investigated snow seasons. No cornice failures occurred before May in the first snow season 2008/2009, while in particularly large failures were observed in the early part of the second snow season in December and February (Fig. 10).
On 13.7 % of all days in both snow seasons, cornice failures were observed. The
15
temporal pattern of increasing cornice failures towards the end of the snow
sea-son is reflected in the clear air temperature differences between avalanche and
non-avalanche days (Fig. 11). The mean air temperature on non-avalanche days was−1.4◦C,
which is significantly higher than on non-avalanche days with−8.9◦C (Fig. 11).
How-ever, error bars suggest that also on colder days, with air temperatures lower than
20
the non-avalanche days mean, cornice fall avalanches occurred (Fig. 11). Both maxi-mum wind speed as well as precipitation measurements from sea level cannot depict avalanche from non-avalanche days. This generally means, that at least in case of en-tire cornice failures, the meteorological conditions, except air temperature, concurrent with cornice failure are of less significance. Additionally direct insolation might
con-25
TCD
5, 2279–2318, 2011Cornice dynamics and meteorological
control
S. Vogel et al.
Title Page
Abstract Introduction
Conclusions References
Tables Figures
◭ ◮
◭ ◮
Back Close
Full Screen / Esc
Printer-friendly Version Interactive Discussion
Discussion
P
a
per
|
Dis
cussion
P
a
per
|
Discussion
P
a
per
|
Discussio
n
P
a
per
|
Thirty-two percent of all 180 cornice failures were “D2R2” avalanches, capable of burying a person (Fig. 12). “D3R2” avalanches that ran out below the rock noses onto the upper avalanche fans, accounted for 22 % (Fig. 12). Seven cornice fall avalanches were categorized as “D3R4” avalanches, running close to infrastructure and capable of destroying it (Fig. 12). These avalanches had the longest run-out in each gully,
indi-5
cated by the red outline on the avalanche fans in Fig. 2. The avalanche size was mostly correlated to the size of the failing cornice. The seven largest cornice fall avalanches
were entire cornice falls that broke offright at the headwall. Thus the amount of entrain
able snow in the avalanche path as well as the trigger of a secondary slab avalanche by the falling cornice, were of minor influence for the actual avalanche size. For these
10
reasons, we also observed the largest cornice fall avalanches categorized as “D3R4”
and “D3R3” avalanches in different parts of the snow seasons (Fig. 13), independent
of the concurrent snow cover of the Gruvefjellet slope beneath. Generally the onset of the snow season was quite slow in both seasons with a shallow or even discontinuous snow cover by December (Eckerstorfer and Christiansen, 2011a). Similar conditions
15
characterize the late part of the snow season in July, when melting occurs. Despite this, both in December and June high magnitude events took place. There were also
some differences between the snow seasons. In 2008/2009 the first high magnitude
(D3R4) failure was recorded on 3 June 2009, whereas in 2009/2010, the first “D3R4” cornice fall avalanche released already on 22 December 2009.
20
Furthermore the size of cornice fall avalanches was also controlled by the size of the particular avalanche path as well as the size of the source area or starting zone
along the ridgeline. The five avalanche paths (Fig. 2) differ considerably in their
ge-omorphology along the plateau ridge. Rock noses determine the horizontal extent of the cornices along the plateau edge and consequently the size of the failures. The
25
TCD
5, 2279–2318, 2011Cornice dynamics and meteorological
control
S. Vogel et al.
Title Page
Abstract Introduction
Conclusions References
Tables Figures
◭ ◮
◭ ◮
Back Close
Full Screen / Esc
Printer-friendly Version Interactive Discussion
Discussion
P
a
per
|
Dis
cussion
P
a
per
|
Discussion
P
a
per
|
Discussio
n
P
a
per
avalanches released in the avalanche gulley “Wrong step” were large “D3R4” failures (Fig. 14). The broad starting zone of this gully is only intersected by one rock nose (Fig. 2), thus enabling the built up of a large continuous cornice. All but the confined avalanche path “Einbahnstrasse” had an almost similar amount of cornice failures with around 20 % of the total. The avalanche derived talus cones of “S” and “Wrong Step”
5
are the largest in size, most likely due to the highest cornice fall avalanche activity.
5 Discussion
5.1 Cornice accretion and scouring
26 cornice accretion days were identified, with a mean prevailing wind direction from
SE and a mean wind speed of 12 m s−1 (Fig. 4). In turn, no di
fference was found in
10
air temperature during accretion and non-accretion days. The somewhat higher mean
accretion wind speed compared to 5–10 m s−1stated by McClung and Schaerer (2006)
can be explained by a commonly hard snow surface for the High Arctic setting (Ecker-storfer and Christiansen, 2011a). On a hard snow surface, the mean saltation lengths
of drifting snow are generally larger (Kosugi et al., 2004), reducing the effective
con-15
tacts of snow particles with the cornice mass and thus reducing cornices accretion.
The entire snow season hourly maximum wind speed of 6 m s−1is in the range, when
snow particles are broken to smaller fragments (McClung and Schaerer, 2006). Sec-ondary, mechanical wind pressure leads to a densification of the near-surface part of the snowpack (Sokratov and Sato, 2001). Thus significant cornice accretion occurs
20
during storm events with significantly higher wind speeds than the snow season’s av-erage.
Data on cornice scouring threshold wind speeds are sparse. Montagne et al. (1968)
found wind speeds in excess of 27 m s−1 for cornice scouring, a value that was
tem-porarily only reached twice during the entire observation period in Svalbard and where
25
TCD
5, 2279–2318, 2011Cornice dynamics and meteorological
control
S. Vogel et al.
Title Page
Abstract Introduction
Conclusions References
Tables Figures
◭ ◮
◭ ◮
Back Close
Full Screen / Esc
Printer-friendly Version Interactive Discussion
Discussion
P
a
per
|
Dis
cussion
P
a
per
|
Discussion
P
a
per
|
Discussio
n
P
a
per
|
surface conditions, air temperature, humidity and other factors may cause variations in the cornice scouring threshold. Cornice scouring also highly depends on the concur-rent snow surface hardness. A hard surface snow layer, due to persistent cold air
tem-peratures or a surface ice layer, would probably alter the scouring effect. We observed
only two cornice scouring events, both in the snow season 2009/2010 (Fig. 5). While
5
the first event reached a record hourly maximum wind speed of 32.4 m s−1, the second
event indicated hourly maximum wind speeds varying between 19 and 15 m s−1. In
contrast to cornice accretion, the wind direction during both events was almost per-pendicular towards the ridgeline, and therefore against the rather frail cornice face and scarp below. Hourly maximum wind speeds similar to the latter scouring event were
10
recorded several times in both snow seasons. In contrast, these followed the prevailing wind direction form SE over the plateau and lead to cornice accretion.
Due to the time resolution of two pictures a day of the “Gruve cam”, short scouring events could have been missed. Still, we did not observe further significant shifts in the hourly meteorological data that we could associate with cornice scouring events.
15
Despite their comparably low duration of only a few hours, both identified scouring events reduced the cornice mass vertically by 4 cm. In general due to the scarcity of scouring events visually observed by the Gruvefjellet automatic camera, and the absence of scouring events during the entire snow season 2008/2009, their general impact on cornice development cannot be discussed in more detail.
20
5.2 Cornice cracking and tilting
We observed numerous cornice cracks between the plateau and the main cornice mass in both snow seasons. Six of these were in the visual field of the “Gruve-cam” automatic camera, which additionally enabled detailed analysis. A very close relation-ship between the opening of these cornice tension cracks in connection with a prior
25
snow-TCD
5, 2279–2318, 2011Cornice dynamics and meteorological
control
S. Vogel et al.
Title Page
Abstract Introduction
Conclusions References
Tables Figures
◭ ◮
◭ ◮
Back Close
Full Screen / Esc
Printer-friendly Version Interactive Discussion
Discussion
P
a
per
|
Dis
cussion
P
a
per
|
Discussion
P
a
per
|
Discussio
n
P
a
per
storms. Very pronounced was the appearance of a cornice crack observed on 23 January 2010 after a distinct warming period of 3 days (13–15 January 2010) with
maximum air temperatures of 3.5◦C and 34 mm of rain. As a consequence, slush
and wet slab avalanches released in an extreme avalanche cycle (Eckerstorfer and Christiansen, 2011b). Thus, the meteorological conditions that lead to extensive other
5
type avalanching, also significantly influenced the development of cornices. Conway (1998) found an immediate increase in the surface layer creep rate as a consequence of rain-on-snow events, which thus led to a decrease in slab stability. Observations of slab fracture mechanics may also account for cornice stability due to their partic-ular cantilevered slab structure (Burrows and McClung, 2006). Besides these early
10
season processes, cornice tension cracks appeared also later in the snow seasons under the influence of solar radiation and generally higher temperatures. Schweizer
and Jamieson (2010) investigated the effect of surface warming on snow pack
stabil-ity. They suggest that increased deformation within the near-surface layer of a slab accounted for the instability in the case of dry-snow slab avalanches. Surface layer
15
stiffness can be effectively reduced by surface penetrating solar radiation, which in
turn directly affects snow stability (Schweizer and Jamieson, 2010) also affecting cor-nices. Generally, Montagne et al. (1968) attributed the development of cornice cracks to on-going creep and glide processes. These deformation/creep processes also lead to the linear opening of the cornice cracks independent of variation in air temperature
20
observed in the two longer series of cornice crack measurements and the downward folding of the entire cornice mass around a pivot point. We observed a geomorpho-logical determined sedimentary step approximately 3 m below the plateau surface in the upper free face that most likely acts as the pivot point. Here at the cornice foot,
temperatures presumably remain constantly low due to efficient isolation by the thick
25
TCD
5, 2279–2318, 2011Cornice dynamics and meteorological
control
S. Vogel et al.
Title Page
Abstract Introduction
Conclusions References
Tables Figures
◭ ◮
◭ ◮
Back Close
Full Screen / Esc
Printer-friendly Version Interactive Discussion
Discussion
P
a
per
|
Dis
cussion
P
a
per
|
Discussion
P
a
per
|
Discussio
n
P
a
per
|
the free face, as melt water that forms in the open exposed parts of the crack will per-colate down towards the pivot point where temperatures will be constantly lower. This freezing might be the reason why numerous cornice failures do not involve the cornice roots, which often remains at the plateau edge and only melt down at the very end of the snow season in late July.
5
5.3 Cornice failure
We observed a total of 180 cornice failures during the two snow seasons, with a clear temporal pattern of increased cornice fall activity towards the end of both snow sea-sons (Fig. 10). 70 of these were categorized as “D2R3” avalanches and larger. To the authors’ knowledge, this seems the first and most comprehensive cornice failure
10
monitoring performed. Likewise the literature is in general sparse on rates of cornice failure. Burrows and McClung (2006) described meteorological-related triggers, similar to those of slab avalanches. McCarty et al. (1986) monitored cornice strength using, among other methods, ram profiles, stating that cornices and their internal tempera-ture variability respond quickly to their meteorological environment. In particular, the
15
most exposed overhanging cornice roof indicated variations in cornice strength. How-ever, analysing the success of explosives for dislodging cornices, McCarty et al. (1986) concluded that the strength of cornices may often be unpredictable.
In both snow seasons, we did not observe one single complete cornice failure as a di-rect response to snow loading and increasing air temperatures caused by a snowstorm.
20
Snowstorms and associated air temperature fluctuations caused the initial cracking, which was observed in all except one case of complete cornice failure. Therefore the meteorological conditions leading up to the cornice failures are of less importance than the length of time since crack initiation and proximate tilting. For the cornice cracks that were studied, the length of time between crack initiation and failure varied between four
25
TCD
5, 2279–2318, 2011Cornice dynamics and meteorological
control
S. Vogel et al.
Title Page
Abstract Introduction
Conclusions References
Tables Figures
◭ ◮
◭ ◮
Back Close
Full Screen / Esc
Printer-friendly Version Interactive Discussion
Discussion
P
a
per
|
Dis
cussion
P
a
per
|
Discussion
P
a
per
|
Discussio
n
P
a
per
at the Gruvefjellet cornice site largely supported the cornice laterally (Fig. 2),
prevent-ing it from breakprevent-ing offcompletely. In comparison, at the adjacent site further south,
these rock outcrops are less pronounced and the headwall below the ridge is vertical, giving significantly less support to the cornice mass. Here, cracked cornices reached their break over point evidently faster, resulting also in more entire cornice failures.
5
Thus in general, the size of the cornice, the micro topography along the plateau edge and the size of the avalanche path determined the cornice fall avalanche magnitude. Seven cornice fall avalanches observed reached the “D3R4” size, capable of destroy-ing infrastructure (Fig. 12). None of them actually reached the infrastructure. Earlier
observations of cornice fall avalanches (Vogel, 2010), beginning in 2005/2006, affirm
10
an annual return period of cornice fall avalanches categorized as “D3R4” avalanches at the study site, with housing infrastructure at the foot of the slope. The avalanche derived fans indicate higher magnitude avalanches in the past (Fig. 2). Thus a large magnitude failure could be highly destructive, but the return period is unknown. The only evidence is from a cornice fall on the Gruvefjellet slope north of the study area
15
in March 2009. This cornice fall avalanche ran across the street and destroyed an old mining tower transport construction situated in its avalanche path on the valley side. The construction was built in 1938 and has not been destroyed in this roughly 70-yr period, which allows for some vague estimation of the return period of these extremely large cornice falls.
20
6 Conclusion
This study most likely represents the first and most comprehensive full season cornice process observations of its kind from the High Arctic landscape. During the course of the two snow seasons 2008/2009 and 2009/2010 we investigated the cornice develop-ment from accretion to cracking and eventual failure, and delimited their meteorological
25
TCD
5, 2279–2318, 2011Cornice dynamics and meteorological
control
S. Vogel et al.
Title Page
Abstract Introduction
Conclusions References
Tables Figures
◭ ◮
◭ ◮
Back Close
Full Screen / Esc
Printer-friendly Version Interactive Discussion
Discussion
P
a
per
|
Dis
cussion
P
a
per
|
Discussion
P
a
per
|
Discussio
n
P
a
per
|
observations and hourly meteorological data enabled us to document the entire cor-nice development, identifying the period of corcor-nice accretion and scouring as well as observing cornice failures with high time resolution thus improving the geomorphologi-cal cornice process understanding. A conceptual annual model including the seasonal cornice dynamics has been established. It shows that the cornices are seasonal and
5
existed during the two observed snow seasons from the beginning of October to the end of July, when the last cornice remnants melted away along the plateau edge.
The extensive plateau mountain Gruvefjellet with the very distinct western edge lo-cated almost perpendicular to the prevailing winter wind direction, are the key factors controlling significant cornice development that was studied. The 26 days of cornice
10
accretion occurred throughout the entire snow season under a wide range of air
tem-peratures, with a mean hourly maximum wind speed of 12 m s−1 and the average
du-ration of the storms lasting 46 h in the snow season 2008/2009 and 54 h in the snow season 2009/2010. Only in the second snow season two periods of cornice scouring could be identified, which both reduced the cornice mass vertically by 4 cm but also
15
somewhat horizontally. The cornice scouring events indicate that strong winds towards the leading edge of the cornices are needed.
Pronounced air temperature fluctuation induced by low-pressure system reaching Svalbard, causing snowstorms, led to the opening of the cornice tension cracks de-taching the cornice main mass from the plateau edge due to additional loading of the
20
cornices. In some cases initial tilting of the cornice mass due to deformation prior to the appearance of cornice cracks was observed. Despite large air temperature variations the cornice crack opening revealed a linear opening distance, which we attribute to con-stant snow creep at the cornice foot, were the temperature conditions remain steady due to thick snow covering isolation and thus enabling onfreezing onto the backwall in
25
the permafrost environment. Thus the entire cornice mass was bending downwards around a pivot point. In some cases the central cornice mass detached from the ridge-line exposing cracks up to 3–4 m wide. The three conducted series of crack widening
TCD
5, 2279–2318, 2011Cornice dynamics and meteorological
control
S. Vogel et al.
Title Page
Abstract Introduction
Conclusions References
Tables Figures
◭ ◮
◭ ◮
Back Close
Full Screen / Esc
Printer-friendly Version Interactive Discussion
Discussion
P
a
per
|
Dis
cussion
P
a
per
|
Discussion
P
a
per
|
Discussio
n
P
a
per
and 8.6 cm day−1. The micro-topography of the ridgeline presumably controls the
cor-nice crack opening rate as well as the particular break over point of the corcor-nice. The duration from initial cracking to eventual failure of the cornices was on average four to five weeks, but not all cornices failed completely. In the cases of entire cornice fall avalanches, the meteorological conditions leading directly up to the cornice failures
5
were of less significance than the duration since crack initiation. Distinct air tempera-ture variations and significant snow loading/growth of the cornices mainly associated with storm events, however, are found to account for initial cracking of the cornices, which thus may lead to eventual failure after a period of time.
In the snow seasons that were studied, 180 cornice failures were observed, of which
10
70 were categorized as “D2R3” and larger cornice fall avalanches. 80 % of the cor-nice failures occurred towards the end of the snow season in June. However, corcor-nice fall avalanches in the early part of the snow seasons were in particular entire cor-nice failures displaying the brittle behaviour of corcor-nices. The seven largest corcor-nice fall avalanches were classified as “D3R4” avalanches, which reached relatively close
15
to inhabited housing infrastructure without permanent protective measures. Compar-ing these results with avalanche field observations since 2005/2006 revealed an an-nual return period of “D3R4” size cornice fall avalanches in the studied slope section. Therefore cornice fall avalanches represent a recurrent natural hazard for the residents and infrastructure in the Nybyen area, and continuous observations might be useful to
20
develop even more sophisticated models for large-scale cornice avalanche failures.
Supplement related to this article is available online at:
http://www.the-cryosphere-discuss.net/5/2279/2011/tcd-5-2279-2011-supplement. pdf.
Acknowledgements. This project was financed partly by the University Centre in Svalbard,
25
TCD
5, 2279–2318, 2011Cornice dynamics and meteorological
control
S. Vogel et al.
Title Page
Abstract Introduction
Conclusions References
Tables Figures
◭ ◮
◭ ◮
Back Close
Full Screen / Esc
Printer-friendly Version Interactive Discussion
Discussion
P
a
per
|
Dis
cussion
P
a
per
|
Discussion
P
a
per
|
Discussio
n
P
a
per
|
Oslo. Researchers in the project are thanked for valuable scientific discussions, especially Ole Humlum. We also want to acknowledge Ulli Neumann for brilliantly helping with fieldwork and field instrument maintenance. The aerial image and DEM in Fig. 1 are kindly provided by Ernst Hauber from the German Aerospace Center, Institute of Planetary Research.
References
5
Burrows, R. and McClung, D. M.: Snow Cornice Development and Failure Monitoring, Interna-tional Snow Science Workshop, Telluride, Colorado, USA, 2006.
Christiansen, H. H.: Snow-cover depth, distribution and duration data from northeast Greenland obtained by continuous automatic digital camera, Ann. Glaciol., 32, 102–108, 2001.
Conway, H.: The impact of surface perturbations on snow-slope stability. Ann. Glaciol., 26,
10
307–312, 1998.
Dickson, R. R., Osborn, T. J., Hurrell, J. W., Meincke, J., Blindheim, J., Adlandsvik, B., Vinje, T., Alekseev, G., and Maslowski, W.: The Arctic ocean response to the North Atlantic Oscillation, J. Clim., 13, 2671–2696, 2000.
Eckerstorfer, M. and Christiansen, H.: The “High Arctic Maritime Snow Climate” in Central
15
Svalbard, Arct. Antarct. Alp. Res., 43(1), 11–21, 2011a.
Eckerstorfer, M. and Christiansen, H. H.: Meteorology, topography and snowpack conditions causing extreme mid-winter slush and wet slab avalanches in High Arctic maritime Svalbard, Permafrost Periglac. Proc., submitted, 2011b.
Førland, E. J., Hanssen-Bauer, I., and Nordli, P.Ø: Climate statistics and longterm series of
20
temperature and precipitation at Svalbard and Jan Mayen, Norwegian Meteorological Insti-tute, Klima 21(97), 1–72, 1997.
French, M. H.: The Periglacial Environment, Third Edition, Wiley & Sons, Chichester, West Sussex, UK, 458 pp., 2007.
Greene, E. M., Birkeland, K. W., Elder, K., Johnson, G., Landry, C., McCammon, I., Moore, M.,
25
Sharaf, D., Sterbenz, C., Tremper, B., and Willimas, K.: Snow, Weather, and Avalanches: Observational Guidelines for Avalanche Programs in the United States. American Avalanche Association, Pagosa Springs, Colorado, USA, 150, 136 pp., 2004.
Hanssen-Bauer, I., Kristensen Sol ˚as, M., and Steffensen, E. L.: The climate of Spitsbergen, Norwegian Meteorological Institute, Klima, 39(90), 1–40, 1990.
TCD
5, 2279–2318, 2011Cornice dynamics and meteorological
control
S. Vogel et al.
Title Page
Abstract Introduction
Conclusions References
Tables Figures
◭ ◮
◭ ◮
Back Close
Full Screen / Esc
Printer-friendly Version Interactive Discussion
Discussion
P
a
per
|
Dis
cussion
P
a
per
|
Discussion
P
a
per
|
Discussio
n
P
a
per
Humlum, O.: Modelling late 20th-century precipitation in Nordenskiold Land, Svalbard, by geo-morphic means. Norsk Geografisk Tidsskrift, Norweg. J. Geogr., 56(2), 96–103, 2002. Humlum, O., Instanes, A., and Sollid, J. L.: Permafrost in Svalbard: a review of research history,
climatic background and engineering challenges. Polar Res., 22(2), 191–215, 2003.
Jaedicke, C. and Gauer, P.: The influence of drifting snow on the location of glaciers on western
5
Spitsbergen, Svalbard, Ann. Glaciol., 42, 237–242, 2005.
Kobayashi, D., Ishikawa, N. and Nishio, F. Formation process and direction distribution of snow cornices, Cold Reg. Sci. Technol., 15, 131–136, 1988.
Kosugi, K., Sato, T. and Sato, A.: Dependence of drifting snow saltation length on snow surface hardness. Cold Reg. Sci. Technol., 39, 133–139, 2004.
10
Kottek, M., Grieser, J., Beck, C., Rudolf, B., and Rubel, F.: World Map of the Koeppen-Geiger climate classification updated. Meteorol. Zeitschr., 15(3), 259–263, 2006.
Larsson, S.: Geomorphological effects on the slopes of Longyear valley, Spitsbergen, after a heavy rainstorm in July 1972, Geografiska Annaler, 64A(2), 105–125, 1982.
Latham, J. and Montagne, J.: The possible importance of electrical forces in the development
15
of snow cornices, J. Glaciol., 9, 1970.
Major, H., Haremo, P., Dallmann, W., and Andresen, A. Geological map of Svalbard, 1:100 000, C9G Adventdalen, Norsk Polarinst, Temakart 31/32, 2001.
McCarty, D., Brown, R. L., and Montagne, J.: Cornices: Their Growth, Properties, and Control, International Snow Science Workshop, Lake Tahoe, 1986.
20
McClung, D. M. and Schaerer, P.: The Avalanche Handbook, 3rd edition, The Mountaineers, Seattle, USA, 342 pp., 2006.
Met.no eklima: Free access to weather- and climate data from Norwegian Meteorological In-stitute form historical data to real time observation, available online at: www.eklima.no, last access: May 2011, 2011.
25
Montagne, J., McPartland, J. T., Super, A. B., and Townes, H. W.: The Nature and control of snow cornices on the Bridger Range, southwestern Montana, Alta Avalanche Study Center, Miscellaneous Report No. 14, 1968.
Naruse, R., Nishimaru, H., and Maeno, N.: Structural Characteristics of Snow Drifts and Cor-nices, Ann. Glaciol., 6, 287–288, 1985.
30
Paulcke, W. and Welzenbach, W.: Schnee, W ¨achten, Lawinen. Zeitschrift f ¨ur Gletscherkunde, Eiszeitforschung und Geschichte, 16(112), 49–69, 1928.
TCD
5, 2279–2318, 2011Cornice dynamics and meteorological
control
S. Vogel et al.
Title Page
Abstract Introduction
Conclusions References
Tables Figures
◭ ◮
◭ ◮
Back Close
Full Screen / Esc
Printer-friendly Version Interactive Discussion
Discussion
P
a
per
|
Dis
cussion
P
a
per
|
Discussion
P
a
per
|
Discussio
n
P
a
per
|
ice flux and on Spitsbergen air temperatures. Geophysical Res. Lett., 32(4), L06709, doi:10.1029/2004GL022262, 2005.
Schweizer, J. and Jamieson, B.: On surface warming and snow instability, Proceedings of the International Snow and Science Workshop, Squaq Valley, USA, 619–622, 2010.
Seligman, G.: Snow structures and ski fields Macmillian, London, UK, 1936.
5
Sokratov, S. A. and Sato, A.: The effect of wind on the snow cover. Ann. Glaciol., 32, 116–120, 2001.
Vogel, S.: Cornice accretion, cracking and failure along with their meteorological controls at Gruvefjellet, Central Svalbard, UiO/UNIS, Oslo/Longyearbyen, 102 pp., 2010.
Welzenbach, W.: Untersuchungen ¨uber die Stratigraphie der Schneeablagerungen und die
10
TCD
5, 2279–2318, 2011Cornice dynamics and meteorological
control
S. Vogel et al.
Title Page
Abstract Introduction
Conclusions References
Tables Figures
◭ ◮
◭ ◮
Back Close
Full Screen / Esc
Printer-friendly Version Interactive Discussion
Discussion
P
a
per
|
Dis
cussion
P
a
per
|
Discussion
P
a
per
|
Discussio
n
P
a
per
|
TCD
5, 2279–2318, 2011Cornice dynamics and meteorological
control
S. Vogel et al.
Title Page
Abstract Introduction
Conclusions References
Tables Figures
◭ ◮
◭ ◮
Back Close
Full Screen / Esc
Printer-friendly Version Interactive Discussion
Discussion
P
a
per
|
Dis
cussion
P
a
per
|
Discussion
P
a
per
|
Discussio
n
P
a
per
|
TCD
5, 2279–2318, 2011Cornice dynamics and meteorological
control
S. Vogel et al.
Title Page
Abstract Introduction
Conclusions References
Tables Figures
◭ ◮
◭ ◮
Back Close
Full Screen / Esc
Printer-friendly Version Interactive Discussion
Discussion
P
a
per
|
Dis
cussion
P
a
per
|
Discussion
P
a
per
|
Discussio
n
P
a
per
|
TCD
5, 2279–2318, 2011Cornice dynamics and meteorological
control
S. Vogel et al.
Title Page
Abstract Introduction
Conclusions References
Tables Figures
◭ ◮
◭ ◮
Back Close
Full Screen / Esc
Printer-friendly Version Interactive Discussion
Discussion
P
a
per
|
Dis
cussion
P
a
per
|
Discussion
P
a
per
|
Discussio
n
P
a
per