Cornice dynamics and meteorological control at Gruvefjellet,
Central Svalbard
S. Vogel1,2, M. Eckerstorfer1,2, and H. H. Christiansen1,2
1Arctic Geology Department, The University Centre in Svalbard, UNIS, Norway 2Department of Geosciences, University of Oslo, Norway
Correspondence to:S. Vogel ([email protected])
Received: 29 June 2011 – Published in The Cryosphere Discuss.: 25 August 2011 Revised: 13 January 2012 – Accepted: 18 January 2012 – Published: 8 February 2012
Abstract. Cornice fall avalanches endanger life and
infras-tructure in Nybyen, a part of Svalbard’s main settlement Longyearbyen, located at 78◦N in the High Arctic. Thus,
cornice dynamics – accretion, cracking and eventual fail-ure – and their controlling meteorological factors were stud-ied along the ridgeline of the Gruvefjellet plateau mountain above Nybyen in the period 2008–2010. Using two auto-matic time-lapse cameras and hourly meteorological data in combination with intensive field observations on the Gruve-fjellet plateau, cornice process dynamics were investigated in larger detail than previously possible. Cornice accretion starts directly following the first snowfall in late Septem-ber and OctoSeptem-ber, and proceeds throughout the entire snow season under a wide range of air temperature conditions that the maritime winter climate of Svalbard provides. Cor-nice accretion is particularly controlled by distinct storm events, with a prevailing wind direction perpendicular to the ridge line and average wind speeds from 12 m s−1.
Partic-ularly high wind speeds in excess of 30 m s−1 towards the
plateau ridgeline lead to cornice scouring and reduce the cornice mass both vertically and horizontally. Induced by pronounced air temperature fluctuations which might reach above freezing and lead to midwinter rainfall events, tension cracks develop between the cornice mass and the plateau. Our measurements indicate a linear crack opening due to snow creep and tilt of the cornice around a pivot point. Four to five weeks elapsed between the first observations of a cornice crack until cornice failure. Throughout the two snow seasons studied, 180 cornice failures were recorded, of which 70 failures were categorized as distinctive cor-nice fall avalanches. A clear temporal pattern with the
ma-jority of cornice failures in June was found. Thus only daily air temperature could determine avalanche from non-avalanche days. Seven large cornice fall non-avalanches reached the avalanche fans on which the Nybyen settlement is lo-cated. The size of the avalanches was primarily determined by the size of the cornice that detached. The improved pro-cess understanding of the cornice dynamics provides a first step towards a better predictability of this natural hazard, but also highlights that any type of warning based on meteoro-logical factors is not an adequate measure to ensure safety of the housing at risk.
1 Introduction
1.1 Motivation and scope of the study
mountain Gruvefjellet bordering the valley Longyeardalen, where Longyearbyen, Svalbard’s main settlement, is located, and most people live in this archipelago.
Cracks develop between the plateau and the main cor-nice mass, leading to a detachment and eventually failure of the cornices as cornice fall avalanches. This process causes a natural hazard to the infrastructure and people liv-ing right underneath the slope. Today, there is no protec-tion measure in place in the Nybyen study area. Cornice fall avalanches have destroyed cultural heritage on the slopes in the Longyeardalen valley in recent years. We have thus mon-itored and analysed cornice accretion, cracking and failure along the edge of the plateau mountain, and their controlling meteorological and topographical factors in the 2008–2010 period. This study forms the first comprehensive investiga-tion of cornice formainvestiga-tion and failure carried out in a High Arctic landscape. Our goal is to provide increased geomor-phological understanding of cornice dynamics, and thereby also improving the predictability of cornice fall avalanches.
1.2 Earlier cornice studies
Due to the general scarcity of studies on cornice formation and failure, no comprehensive overview exists. There are, however, a few very detailed basic studies on different parts of the cornice formation process. Major fundamental work on cornices was carried out by Paulcke and Welzenbach in the 1920’s in the European Alps (Paulcke and Welzenbach, 1928; Welzenbach, 1930), where they trenched cornices to accurately define the stratigraphy, as well as to distinguish between different kinds of cornices due to their formation (suction vs. pressure cornices), duration (permanent vs. tem-porary), topographical position (ridge vs. plateau), as well as the topographical control on cornice development. Further-more they described the process of involution, and thereby the formation of roll cavities (Fig. 1) inside the cornices – a term later introduced by Montagne et al. (1968). Selig-man (1936) translated the most technical terms invented by Paulcke and Welzenbach into English, and found varying cornice development depending on the inclination of the lee slope. Montagne et al. (1968) focussed on deformation pro-cesses inside the cornice mass, attributing creep and glide processes to the opening of tension fractures between the cor-nice mass and the ridgeline bedrock. Their studies followed work mainly on cornice accretion processes. Besides initial binding of the snow crystals by mechanical interlocking, the refreezing of a liquid water layer due to frictional contact and pressure melting at temperature close to 0◦C as well as the
importance of electrical forces in the adhesion process were investigated by Latham and Montagne (1970). These au-thors concluded that all three suggested mechanisms might contribute to the development of snow cornices. Naruse et al. (1985) compared mean grain diameter, bulk density and hardness of the surface layer (0.05–0.15 m) along the cor-nice root and roof as well as the scarp (Fig. 1). These were
18
Fig. 1. Cornice profile showing the used cornice terminology, exemplified on a cornice from the study site at Gruvefjellet, Longyeardalen valley, Svalbard. Photo from 31 March 2010.
found to be largest at the cornice root and roof as a result of sorting of snow particles in the deposition-erosion process. Smaller particles are more likely to be transported over the face by wind or collide with falling particles and redeposit at the scarp. McCarty et al. (1986) monitored a particular cornice during a one-month period and conducted density, strength, temperature, and physical properties profiles. Irre-spective of the short observation period, the study demon-strated the quick response of the cornice to changes in me-teorological conditions. Kobayashi et al. (1988) analyzed the formation processes of snow cornices in an experimental trench and calculated collection coefficients in the range of 2 % to 50 % of windblown snow particles at the newly form-ing cornice as well as along a mountain ridge. Burrows and McClung (2006) identified key meteorologically-related trig-gers of cornice failure: loading of the cornice by additional snow (precipitation or wind), distinctive temperature changes due to air temperature changes and rain-on-snow events or direct insolation.
2 Study area
2.1 Geology and geomorphology
Longyearbyen (78◦N, 15◦E), Svalbard’s main settlement is
19
Fig. 2: Location of the study area in Svalbard and the detailed study site of the Gruvefjellet mountain slope
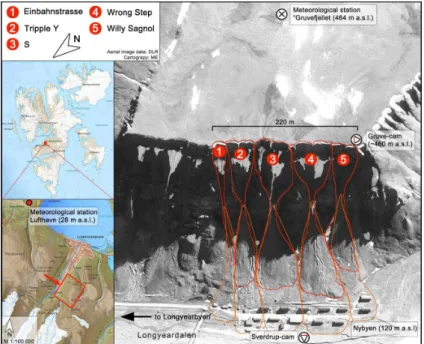
Fig. 2. Location of the study area in Svalbard and the detailed study site of the Gruvefjellet mountain slope above Nybyen in the valley Longyeardalen. The cornice site along the edge of the plateau mountain Gruvefjellet is 220 m long and subdivided into 5 larger funnels that narrow into gullies, intersected by hard rock noses. The red lines indicate the outline of the largest cornice fall avalanches observed in each of the 5 gullies during the 2008–2010 observation period, the orange line delimits the avalanche fans. The location of the meteorological stations Gruvefjellet and Lufthavn are indicated as well as the two automatic time-lapse cameras Gruve-cam on the plateau ridgeline and Sverdrup-cam on an artificial stockpile. The Sverdrup-cam real location is on the other side of the valley floor, about 1100 m away from the Gruvefjellet ridgeline.
areas (Humlum et al., 2003). The cornice study site contains a 220 m relatively sharp plateau ridgeline (about 460 m a.s.l) dividing the extensive three kilometre wide blockfields of the Gruvefjellet plateau from the steep underlying slope of Gruvefjellet (Fig. 2). The slope section below the ridgeline consists of an about 50–70 m high vertical free rock face, which below continues into a 55–60◦steep slope at the
up-per part with a basal concavity. Rock outcrops in the middle part of the slope subdivide the cornice funnels into five dis-tinctive avalanche paths, which reach down to the foot of the slope. The lower part of the valley side/slope consists of talus fans derived from rock fall but mainly from avalanche sedi-mentation, and are reworked by debris flows (Larsson, 1982) (Fig. 2). Seventeen houses accommodating more than 200 people are located on the basal concavity on the avalanche fans (Fig. 2).
2.2 Climate and meteorology
The climate of Svalbard is characterized as an ET polar tun-dra climate according to the Köppen-Geiger climate classi-fication (Kottek et al., 2006). Svalbard is situated in a path-way of heat and moisture transport to the Arctic, thus the climate is sensitive to changes and is warmer than generally expected for the high latitude (Førland et al., 1997; Rogers
et al., 2005). Svalbard’s climate is mainly influenced by the interaction of the Icelandic Low with a high pressure over Greenland (Hanssen-Bauer et al., 1990). Thus typically in winter cold anti-cyclonic air masses extend to Svalbard from the north, alternating with low-pressure systems bring-ing warm and moist air masses due to meridional moisture transport along the North Atlantic cyclone track (Dickson et al., 2000).
The 1912–2010 annual air temperature average in Longyearbyen close to sea level is −6◦C, being almost
2◦C colder than the mean annual air temperature (MAAT)
of −4.1◦C in 2010 (Met.no, 2011) recorded at the
offi-cial meteorological station Lufthavn at 28 m a.s.l. (Fig. 2). 2008 with−4◦C and 2009 with−3.7◦C MAAT were also
both warmer. At the Gruvefjellet meteorological station at 464 m a.s.l. on the central part of the Gruvefjellet plateau, 300 m from the study site (Fig. 2), the MAAT in 2010 was −6.7◦C, with almost the same values in 2008−6.7◦C and in 2009 −6.1◦C. The mean snow season air temperature (MSSAT, 1 October–31 July) at Gruvefjellet was−8.7◦C in 2008/2009 and−6.8◦C in 2009/2010, while it was−6.2◦C in 2008/2009 and−4.2◦C in 2009/2010 at the Lufthavn me-teorological station.
1912–2010 was 196 mm w.e. (Met.no, 2011). MAP in 2008 was 200 mm and 153 mm in 2009 at the same site. Precipi-tation data from higher grounds do not exist. However, mod-elling results from Humlum (2002) suggest a vertical pre-cipitation gradient with a 100 % upward correction factor. Since most of the precipitation falls as snow, accurate mea-surements in a landscape devoid of high vegetation are chal-lenging.
Average snow season wind speed at Gruvefjellet was 4 m s−1in 2008/2009 and 3.9 m s−1in 2009/2010, with
max-imum wind speeds in both seasons exceeding 25 m s−1 for
shorter periods. Due to its constancy and the landscape being devoid of almost any vegetation, the wind freely redistributes snow in the landscape. While exposed parts of the landscape remain snow free for most of the winter, lee sides accumu-late up to several meters of snow (Jaedicke and Gauer, 2005). The snowpack in the study area is generally thin and hard, characterised by wind slabs and ice layers (Eckerstorfer and Christiansen, 2011a). The prevailing winter wind direction in the 2008–2010 periods was from the SE on Gruvefjellet. Local wind directions vary due to topographical channelling effects (Humlum, 2002). However, on the study site the over-all regional wind is dominating due to the wide Gruvefjellet plateau area, which enables extensive snow drifting and thus allowing cornice accretion.
3 Methods
The cornice development was studied during the two con-secutive snow seasons 2008/2009 and 2009/2010. “Snow season” here refers to the duration of cornices along the Gru-vefjellet plateau edge, lasting from the beginning of October until the end of July typically. During both snow seasons, 45 field trips up to the cornice site on the Gruvefjellet plateau were carried out (Fig. 3), as well as very frequent field in-vestigations of the Gruvefjellet slope/valley side underneath the ridge. The majority of the fieldwork was conducted from mid January and onwards, when the snow cover of the Gru-vefjellet slope was becoming continuous. Furthermore the beginning of the twilight period at the end of the polar night allows good enough detailed visual observations and mea-surements.
The magnitude of each cornice failure was determined by two values – the destructiveness (D) and the size relative to the given slope (R) (Greene et al., 2004). TheD value describes the destructive potential of an avalanche from the mass of deposited snow, applied to an object (person, car, trees) located in the avalanche track or at the beginning of the runout zone. TheRvalue estimates the size of an avalanche relative to the particular avalanche path length. R1 and R2 avalanches display small failures that ran out just below the free face and reaching down between the rock noses, respec-tively. R3 avalanches ran down below the rock noses to the upper part of the avalanche fans. R4 avalanches represent
large cornice fall avalanches that reached the low inclined terrain on the lower part of the avalanche fans, indicated by the red lines in Fig. 2. As in particular the avalanches catego-rized as D2.5 and larger showed significant amounts of snow deposits in addition to the broken cornice blocks in the runout zone, we used the term “cornice fall avalanches”. This also applied to the cornice failures in the very beginning and to-wards the end of the each snow season, when the snow cover on the slope beneath the cornices was shallow or even discon-tinuous and hence the amount of entrainable snow limited.
3.1 Automatic time-lapse photography observations
Two automatic digital time-lapse cameras were used to mon-itor directly, on an at least daily basis, cornice develop-ment and failure. Both cameras were standard digital cam-eras, equipped with a time-lapse controller (Harbortronics DigiSnap 2000 and similar custom-built) and a solar panel mounted on top of a weather-proof box, in which the camera and the entire set up was stored. A plastic window in front of the camera allowed the photographing from inside the box. Solar panels recharged a 12 V battery, which provided en-ergy during the entire polar night and twilight period with-out charging. The photographs were stored as jpg-files on regular memory-SD cards, which were checked and changed at least every 2–4 weeks. Christiansen (2001) pointed out that automatic cameras provide additionally general weather information useful for understanding the process dynamics investigated specifically.
19
Fig. 3. Timing of field observations of the cornice study site for all the different observation methods used in the field during the snow seasons 2008/2009 and 2009/2010. Indicated is also the polar night period with start and end dates and both twilight periods.
being recharged by the solar panel, prevented collection of photographs (Fig. 3).
The other camera “Sverdrup-cam” was placed on the op-posite side of Longyeardalen on an artificial stockpile, taking up to six daily photographs during the main avalanche season of the entire Gruvefjellet slope above Nybyen from 1100 m distance (Fig. 2). The high resolution of the DSLR camera enabled monitoring of all cornice failures of the study site in great detail, for improved directly linking to the meteorolog-ical conditions. The failures were assigned to one of the five major gullies (Fig. 2), and the recorded picture time of the automatic camera was taken as event timing, if there were no eyewitnesses to give directly the time of the avalanche. In general, light conditions during the polar night, snowstorms or very temporary snow accumulation in front of the camera lens affected this method negatively.
3.2 Cornice crack width measurements
Cornice crack measurements were conducted during the field visits once cracks started to open between the plateau and the cornice mass. Three series of cornice crack measure-ments with a total number of 29 readings were carried out in both snow seasons (Fig. 3). As a consequence of the ap-pearance of cornice cracks, the three series of measurements were not conducted at the same cornice section. The setup consisted of two stakes, one installed on the plateau as the reference point, and one in the cornice mass, approximately 0.5 m away from the crack on the cornice side. Since the ref-erence stake was installed on close to horizontal terrain and the snow cover on the plateau is particular dense, we consid-ered the stake’s position as constant. Furthermore the cov-erage by automatic time-lapse photography proved that the positions of snow stakes along the plateau edge were stable throughout the snow season. By repeated distance measure-ments stretching a rope permanently attached to the tip of the cornice stake, the relative opening of the cornice cracks was determined. This enabled easy manual recordings not causing any surface disturbance to the cornice root and roof except for the first installation. In the third series of mea-surements, the two stakes were also equipped with a scale to
determine local relative variations in snow depth, and thus to investigate the influence of periods of cornice accretion and scouring on the cornice crack opening.
4 Results
Using the presented combination of methods we have been able to collect data that describe the complete cornice de-velopment process from accretion and scouring, to cracking, tilting of the cornice mass and eventual failure.
4.1 Cornice accretion and scouring
Periods of cornice accretion and scouring were identified by quantitative comparison of the time-lapse photographs in combination with the hourly meteorological data and direct field observations. The automatic camera data and direct field observations indicate that cornices grow to a signifi-cant size within a short time after the first snowfall. But at this stage we are unable to quantify this observation due to the lack of visibility during the polar night and the miss-ing automatic photographs. Overall the first half of the snow season is characterized only by a shallow or even discontinu-ous snow cover until December. Cornice accretion proceeded during both entire snow seasons, when wind speeds averaged 12 m s−1, with a minimum of at least 10 m s−1, marking the
lower limit of cornice accretion (Fig. 4). On average storm durations were about 46 h in the snow season 2008/2009 and 54 h in 2009/2010, with minimum periods in excess of 10 h in both seasons.
The prevailing wind direction during cornice accretion was very narrow at 120◦,±5◦(Fig. 4), almost
perpendicu-lar to the NNE-SSW orientated ridgeline (Fig. 2), whereas it varied much more 125–250◦for non-accretion periods.
the Gruvefjellet plateau edge towards the end of July. Thus, the cornices on Gruvefjellet are an annual and temporary phenomena with a clear seasonal cycle (Paulcke and Welzen-bach, 1928; WelzenWelzen-bach, 1930; Seligman, 1936).
Despite the lack of direct precipitation data the increased measured wind speed, and bad visibility due to snow drift-ing in front of the automatic camera durdrift-ing accretion events, clearly show that snowstorms largely accounted for accre-tion. Each accretion event added one or more snow layers onto the cornice mass. These wedge-like layers were ini-tially bedded horizontally with a steeply inclined accretion face. Gradually the leading edge (Fig. 1) and consequently the entire cornice crept downwards, particularly under the load of successive accretion layers or air temperatures close to or above freezing, enabling fast snow creep/deformation (McClung and Schaerer, 2006). The formation of roll cavi-ties (Montagne et al., 1968; Paulcke and Welzenbach, 1928) “Hohlkehle” was observed as this downward folding pro-ceeded (Fig. 1). The roll cavities in general remained weak spots within the cornice mass and many partial failures have been observed along them.
Besides involution of the cornice and general snow settle-ment of the cornice mass, cornice scouring accounted for ob-servable horizontal and vertical shrinking. Only two scour-ing events were identified, both occurred in the second snow season in the beginning of March (Fig. 5). During a snow-storm on 7 March 2010, cornice scouring was observed over a period of three hours with maximum wind gusts up to 32.4 m s−1, however, with winds from the S to SW. With
this wind direction the strong winds blew almost straight to-wards the plateau edge, thus enabling scouring and not ac-cretion. A total vertical reduction of 4 cm was recorded at the cornice root. With our study set-up it was not possible to quantify the variations in the horizontal extent of the cor-nices. Though, by comparison of the automatic photographs, significant shortening was determined as a consequence of the scouring events. The second scouring period occurred just one day later, lasting more than 7 h, reducing the cor-nice mass again by 4 cm vertically. The hourly maximum wind gusts were between 15–19 m s−1, and thus significantly
lower than the previous event. Similarly, the wind direction was towards the plateau edge varying from WNW and NW. Both events took place during very different, but negative air temperature conditions (Fig. 5), which then does not seem to affect the scouring process.
4.2 Cornice cracking and tilting
Several cornice tension cracks between the plateau and the main cornice mass were observed in both snow seasons at the study site and the adjacent areas. Our time-lapse pho-tography showed that a slight depression in connection with a bulge in the cornice root, followed by initial tilting of the cornice mass occurred in most cases before tension cracks appeared (Fig. 6a, b). These cornice cracks formed mostly
at the transition from the shallow snowpack on the plateau to the inner part of the thicker cornice snow mass, where stresses due to tension were highest (Fig. 6c). We observed cornice cracks appearing very rapidly with a loud “bang” sound, as we unintentionally stepped onto the cornice root one time, adding load onto the cornice. With further open-ing of the cracks, lateral tension cracks developed at an ob-tuse angle to the initial cracking, forming a pronounced C-shape. This was contemporaneous with an upwards lifting of the inner and upper cornice mass (Fig. 6d). The cornice tilted around a fixed pivot point (Fig. 6e), which caused an even opening of the crack until the cornice mass displayed a very steep, close to vertical position (Fig. 6e). Thereby, parts of the cornice were lifted above its initial position along the plateau edge. Small failures progressively rounded the for-mer leading edge and roll face, the majority of which oc-curred particularly along the roll cavities (Figs. 1 and 6d, e). These small failures also eroded the cornice scarp and pillow successively (Fig. 6e). The central cornice mass detached from the ridgeline in some cases, exposing cracks up to 3– 4 m wide.
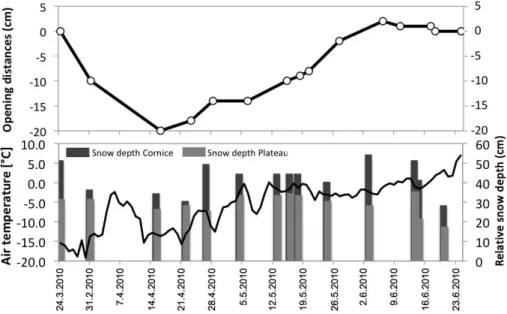
The most comprehensive cornice crack width distance measurements lasted from 24 March 2010 until 23 June 2010 (Fig. 7). At this site we combined the crack width dis-tance measurements with the relative variation in snow depth, obtained from the two measurement stakes on the plateau and on the cornice (Fig. 7). The cornice crack was already open when the instrumentation was installed; we thus only monitored the relative opening of the cornice crack. There-fore 0 refers to the initial distance between the two stakes when the instrumentation was installed and the y-values in Fig. 7 do not express absolute crack distances. The first two measurements indicated a reduction of the crack by 20 cm over 22 days. Since we did not observe any actual clos-ing of the crack, we explain this as a slight backward tilt-ing of the cracked cornice mass. The measurtilt-ing rope was permanently attached to the cornice stakes’ tip to avoid be-ing buried, so the slight backward tiltbe-ing caused a reduc-tion in the measured distance between the cornice stake and the plateau stake without actually reducing the cornice crack width (Fig. 6b). The onset of melting affected the position of both measurement stakes inserted into the snow during the last measurements, leading to stagnant width measurements. In the period between 16 April and 6 June 2010, a total cor-nice opening distance of 22 cm was measured, resulting in an average crack widening of 0.43 cm day−1. Regardless of
air temperature fluctuations, the crack widening was almost linear (Fig. 7). Relative variation in snow depths on each site of the crack influenced the crack opening to some ex-tent. For example, between 23 and 28 April 2010 the highest cornice crack opening rate of this series of 0.8 cm day−1was
20
Fig. 4.Daily meteorological values recorded at the Gruvefjellet meteorological station for observed cornice accretion days (N=26) and no
accretion days (579) from both snow seasons.
20
Fig. 5. Maximum and average wind speeds and air temperature recorded at Gruvefjellet meteorological station during the two observed cornice-scouring events.
rate, independently of snow depth and air temperature con-ditions clearly indicate, that after crack opening, the cornice mass was tilting around a fixed pivot point due to constant snow creep and deformation of the cornice.
The first series of measurements in the snow season 2008/2009 also showed a pronounced linear cornice crack opening (Fig. 8). During the period between 28 April and 6 June 2009, a cornice crack opened 105 cm after the crack was observed and the setup installed. Therefore the y-value 0 refers again to this initial distance between the two
stakes. The average cornice crack opening of this period was 2.76 cm day−1 (Fig. 8). On 19 May 2009 a reduction
of 21 cm to the previous day was measured. This was caused by a surface perturbation, where we observed the upper most layer of the cracked cornice part to be crept slightly towards the plateau, which affected the measurement stake. The fol-lowing measurements indicated the same opening rate as prior to the perturbation.
The highest cornice crack opening rate of 8.6 cm day−1
21
Fig. 6.Model of the seasonal stages of the annual cornice dynamics cycle from initial crack development, crack opening, upward lifting of the cornice mass to eventual failure or meltdown.
21
Fig. 7.Cornice crack width measurements, air temperature and relative snow depth from the snow season 2009/2010. The y-value 0 refers to the initial distance between the two stakes when the instrumentation was installed, so the y-values do not express absolute crack distances. Please observe that the crack width measurements indicate a reduction in the two first recordings, therefore the negative values.
2010. The series ended with an entire cornice failure. This was in contrast to the long lasting series of measurements, when melting conditions towards the end of the snow season prevented further accurate measurements. So crack opening rates of this size seem to lead to cornice failure.
In the snow season 2009/2010 the development of four cornice cracks until failure was observed in the “Gruve-cam” field of view. Thus using the time-lapse photographs, we were able to follow the entire cornice development from cracking and widening, to downward folding of the entire
22
Fig. 8: Cornice crack width measurements from the snow season 2008/2009. The y-value 0 refers to the
’
Fig. 8. Cornice crack width measurements from the snow season 2008/2009. The y-value 0 refers to the initial distance between the two
stakes when the instrumentation was installed, so the y-values do not express absolute crack distances.
22
Fig. 9: Timing of cornice mass tilting, cornice crack opening and failure of 4 entire cornices in the camera’s
Fig. 9. Timing of cornice mass tilting, cornice crack opening and failure of 4 entire cornices in the camera’s field of view in the snow season 2009/2010. Average daily air temperature (grey line) and average daily wind speed (black line) are recorded at the Gruvefjellet meteorological station. The precipitation data (columns) is from the Lufthavn meteorological station.
(Fig. 9). Also the time-lapse photographs of the the first snow season 2008/2009 and fieldwork observations outside the camera’s field of view revealed very similar time periods for the cornice development. The data indicate that the period between crack development and eventual failure by reaching the particular cornice break over point can be variable. The observed periods averaged between four to five weeks. But the formation of cornice cracks did not necessarily lead to cornice failure and vice versa.
4.3 Cornice failure
In total 180 cornice failures were observed in the two snow seasons that were investigated (Fig. 10). There is a clear tem-poral pattern with the majority releasing between May to the end of June (Fig. 10). By then, full-developed cornices were able to crack and tilt through a period of time before
fail-ure. Besides entire cornice fall avalanches, the majority of the late season failures were mostly only collapses of cornice parts, like scarps or pillows, (Fig. 6c–e), or the release of lat-eral remnants of cracked cornices. Additionally the leading edge and accretion face of cracked and tilted cornices failed in relatively small pieces, leading to a rounding of the cornice mass (Fig. 6e). The temporal distribution of cornice failures differed somewhat between the two investigated snow sea-sons. No cornice failures occurred before May in the first snow season 2008/2009, while in particularly large failures were observed in the early part of the second snow season in December and February (Fig. 10). In the course of the two snow seasons, we did not observe any sizeable avalanches in our study area, which were not attributed to cornice failure.
Fig. 10.Chronology of cornice failures for the Gruvefjellet study area in the two investigated snow seasons 2008/2009 and 2009/2010.
23
Fig. 11.Variation of daily meteorological values from the Lufthavn meteorological station during avalanche days (avl days) (N=73)
and non-avalanche days (non-avl days) (N=532) from both snow
seasons.
in the clear air temperature differences between avalanche and non-avalanche days (Fig. 11). The mean air temperature on avalanche days was−1.4◦C, which is significantly higher
than on non-avalanche days with−8.9◦C (Fig. 11). How-ever, error bars suggest that also on colder days, with air temperatures lower than the non-avalanche days mean, cor-nice fall avalanches occurred (Fig. 11). Both maximum wind speed as well as precipitation measurements from sea level cannot depict avalanche from non-avalanche days. This gen-erally means, that at least in case of entire cornice failures, the meteorological conditions, except air temperature, con-current with cornice failure are of less significance. Addi-tionally direct insolation might contribute to this also, as we observed a trend of increased partial failures towards the late afternoon, when the sun hits the cornices.
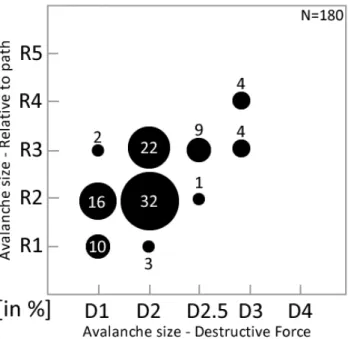
Thirty-two percent of all 180 cornice failures were “D2R2” avalanches, capable of burying a person (Fig. 12).
“D3R2” avalanches that ran out below the rock noses onto the upper avalanche fans, accounted for 22 % (Fig. 12). Seven cornice fall avalanches were categorized as “D3R4” avalanches, running close to infrastructure and capable of destroying it (Fig. 12). These avalanches had the longest run-out in each gully, indicated by the red outline on the avalanche fans in Fig. 2. Avalanche sizes were mostly corre-lated to the size of the failing cornice. The seven largest cor-nice fall avalanches were entire corcor-nice falls that broke off right at the headwall. Thus the amount of entrainable snow in the avalanche path as well as the trigger of a secondary slab avalanche by the falling cornice, were of minor influ-ence for the actual avalanche size. For these reasons, we also observed the largest cornice fall avalanches categorized as “D3R4” and “D3R3” avalanches in different parts of the snow seasons (Fig. 13), independent of the concurrent snow cover of the Gruvefjellet slope beneath. Generally the onset of the snow seasons was quite slow in both seasons, with only a shallow or even discontinuous snow cover by December (Eckerstorfer and Christiansen, 2011a). Similar snow con-ditions characterize the late part of the snow season in July, under the influence of melting. Despite this, both in Decem-ber and June high magnitude events took place. There were some differences between the snow seasons. In 2008/2009 the first high magnitude (D3R4) failure was recorded on 3 June 2009, whereas in 2009/2010, the first “D3R4” cornice fall avalanche released already on 22 December 2009.
24
as “D2R3” Fig. 12.Size distribution in % of all recorded cornice failures and
their destructive potential (D) as well as size relative to path (R),
according to the classification system by the American Avalanche Association (Greene et al., 2004), for both observed snow seasons.
in the most narrow avalanche gully path, “Einbahnstrasse”, no large cornice fall avalanche released (Fig. 14) explain-ing the much smaller avalanche deposits extendexplain-ing below this (Fig. 2). On the other hand, 40 % of all cornice fall avalanches released in the avalanche gulley “Wrong step” were categorized as large “D3R4” failures (Fig. 14). The broad starting zone of this gully is only intersected by one rock nose (Fig. 2), thus enabling the built up of large con-tinuous cornices. All but the confined avalanche path “Ein-bahnstrasse” had an almost similar amount of cornice failures with around 20 % of the total. The avalanche fans below “S” and “Wrong Step” are the largest in size (Fig. 2), most likely due to the highest cornice fall avalanche activity.
5 Discussion
5.1 Cornice accretion and scouring
26 cornice accretion days were identified, with a mean pre-vailing wind direction from SE and a mean wind speed of 12 m s−1 (Fig. 4). In turn, no difference was found in air
temperature during accretion and non-accretion days. The somewhat higher mean accretion wind speed observed for the Gruvefjellet site compared to the 5–10 m s−1 stated by
McClung and Schaerer (2006), can be explained by a com-monly hard snow surface for the High Arctic setting (Ecker-storfer and Christiansen, 2011a). On a hard snow surface, the mean saltation lengths of drifting snow are generally larger (Kosugi et al., 2004), reducing the effective contacts of snow
Data on cornice scouring threshold wind speeds are sparse. Montagne et al. (1968) found wind speeds in excess of 27 m s−1 for cornice scouring, a value that was
temporar-ily only reached twice during the entire observation period in Svalbard, and where scouring was observed during one of them. McClung and Schaerer (2006) stated that surface conditions, air temperature, humidity and other factors may cause variations in the cornice scouring threshold. Cornice scouring also highly depends on the concurrent snow sur-face hardness. A hard sursur-face snow layer, due to persistent cold air temperatures or a surface ice layer, would proba-bly alter the scouring effect. We observed only two cornice scouring events, both in the snow season 2009/2010 (Fig. 5). While the first event reached a record hourly maximum wind speed of 32.4 m the second event happened when the hourly maximum wind speeds varied between 19 and 15 m s−1. In
contrast to cornice accretion, the wind direction during both events was almost perpendicular towards the ridgeline, and therefore against the rather frail cornice face and scarp below. Hourly maximum wind speeds similar to the latter scouring event were recorded several times in both snow seasons. But in contrast, these followed the prevailing wind direction from SE over the plateau and lead to cornice accretion.
Due to the time resolution of two pictures a day of the “Gruve-cam”, short scouring events could have been missed. Still, we did not observe further significant shifts in the hourly meteorological data that we could associate with cor-nice scouring events. Despite their comparably low duration of only a few hours, both identified scouring events reduced the cornice mass significantly – vertically by 4 cm and also in the horizontal direction, but with our study set-up it was not possible to quantify these variations. In general due to the scarcity of scouring events visually observed by the Gruvef-jellet automatic camera, and the absence of scouring events during the entire snow season 2008/2009, their general im-pact on cornice development cannot be discussed in more detail.
5.2 Cornice cracking and tilting
24
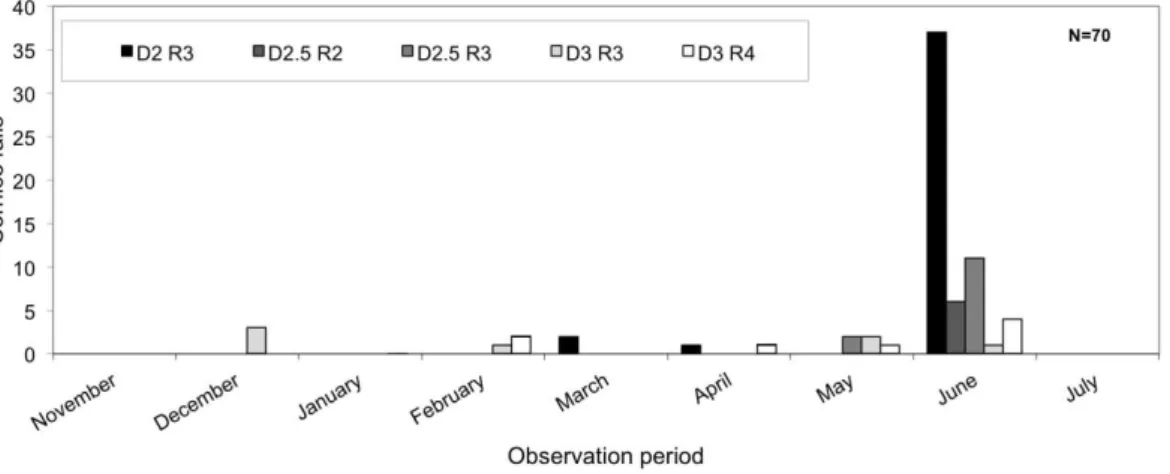
Fig. 13: The monthly distribution of the 70 cornice fall avalanches categorized as “D2R3” or larger for both
Fig. 13. The monthly distribution of the 70 cornice fall avalanches categorized as “D2R3” or larger for both observed snow seasons.
Classification according to Greene et al. (2004).
25
Fig. 14: Relative amount of cornice fall avalanche types per gully for both snow seasons along the 220 m
Fig. 14. Relative amount of cornice fall avalanche types per gully for both snow seasons along the 220 m long Gruvefjellet study area.
mass and very pronounced air temperature fluctuations ap-peared. Significant air temperature increases were caused by low-pressure systems reaching Svalbard, resulting in rel-atively warm and moist air masses and high wind speeds during snowstorms. Very pronounced was the appearance of a cornice crack observed on 23 January 2010 after a distinct warming period of 3 days (13–15 January 2010) with max-imum air temperatures of 3.5◦C at Gruvefjellet and 34 mm
of rain at sea level. As a consequence, slush and wet slab avalanches released in an extreme avalanche cycle in the Longyearbyen area, even at higher elevations than the Gruve-fjellet study site (Eckerstorfer and Christiansen, 2012). Thus, the meteorological conditions that lead to extensive other type avalanching, also significantly influenced the cornices development. Conway (1998) found an immediate increase in the surface layer creep rate as a consequence of rain-on-snow events, which thus led to a decrease in slab stability.
Observations of slab fracture mechanics may also account for cornice stability due to their particular cantilevered slab structure (Burrows and McClung, 2006).
Besides the early season processes, cornice tension cracks appeared also later in the snow seasons under the influence of solar radiation and generally higher temperatures. Schweizer and Jamieson (2010) investigated the effect of surface warm-ing on snowpack stability. They suggest that increased defor-mation within the near-surface layer of a slab accounted for the instability in the case of dry-snow slab avalanches. Sur-face layer stiffness can be effectively reduced by surSur-face pen-etrating solar radiation, which in turn directly affects snow stability (Schweizer and Jamieson, 2010) also affecting cor-nices. We found a trend of increased cornice failures dur-ing the late afternoon, when the sun hits the cornices. Still, these cornice failures were mostly partial failures of compa-rable lower magnitude. The meteorological station situated on the Gruvefjellet plateau does not record solar radiation, but it might be useful to analyze the relationship of solar ra-diation and cornice activity in greater detail.
Generally, Montagne et al. (1968) attributed the devel-opment of cornice cracks to on-going creep and glide pro-cesses. These deformation/creep processes also lead to the linear opening of the cornice cracks independent of variation in air temperature observed in the two longer series of cor-nice crack measurements, and the downward folding of the entire cornice mass around a pivot point.
be the reason why numerous cornice failures do not involve the cornice roots, which often remains at the plateau edge and only melt down at the very end of the snow season in late July.
5.3 Cornice failure
We observed a total of 180 cornice failures during the two snow seasons, with a clear temporal pattern of increased cornice fall activity towards the end of both snow sea-sons (Fig. 10). 70 of these were categorized as “D2R3” avalanches and larger. To the authors’ knowledge, this rep-resents the first, comprehensive cornice failure monitoring performed. Likewise the literature is in general sparse on rates of cornice failure. Burrows and McClung (2006) de-scribed meteorological-related triggers, similar to those of slab avalanches. McCarty et al. (1986) monitored cornice strength using, among other methods, ram profiles, stating that cornices and their internal temperature variability re-spond quickly to their meteorological environment. In par-ticular, the most exposed overhanging cornice roof indi-cated variations in cornice strength. However, analysing the success of explosives for dislodging cornices, McCarty et al. (1986) concluded that the strength of cornices may often be unpredictable.
In both snow seasons, we did not observe one single com-plete cornice failure as a direct response to snow loading and increasing air temperatures caused by a snowstorm. Snow-storms and associated air temperature fluctuations caused the initial cracking, which was observed in all except one case of complete cornice failure. Therefore the meteorological conditions leading up to the complete cornice failures are of less direct importance than the length of time since crack initiation and proximate tilting. For the cornice cracks that were studied, the length of time between crack initiation and failure varied between four to five weeks. The duration un-til eventual failure seemed to be primarily controlled by the micro-topography along the ridgeline, where the cornice foot was resting, and thus the particular break over point of the cornice. In many cases, the delimiting rock noses at the Gru-vefjellet cornice site largely supported the cornice laterally (Fig. 2), preventing it from breaking off completely. In com-parison, at an adjacent site further south, these rock outcrops are less pronounced and the headwall below the ridge is ver-tical, giving significantly less support to the cornice mass. Here, cracked cornices reached their break over point
evi-towards the end of the snow season, when the snow cover on the slope was shallow or even discontinuous. The tim-ing of cornice fall avalanches at the study site is comparable to the overall timing of releases in the Longyearbyen area, with maximum activity between April and June (Eckerstor-fer and Christiansen, 2011b). Seven cornice fall avalanches observed reached the “D3R4” size, capable of destroying frastructure (Fig. 12). None of them actually reached the in-frastructure. Earlier observations of cornice fall avalanches (Vogel, 2010), beginning in 2005/2006, confirm an annual re-turn period of cornice fall avalanches categorized as “D3R4” avalanches at the study site, with housing infrastructure at the foot of the slope.
6 Conclusions
This study most likely represents the first and most compre-hensive full season cornice process observations of its kind from the High Arctic landscape. During the course of the two snow seasons 2008/2009 and 2009/2010 we investigated the cornice development from accretion to cracking and eventual failure, and delimited their meteorological controls, along the ridgeline of the plateau shaped mountain Gruvefjellet in cen-tral Svalbard. Using automatic time-lapse photography in combination with manual fieldwork observations and hourly meteorological data enabled us to document the entire cor-nice development, identifying the period of corcor-nice accretion and scouring as well as observing cornice failures with high time resolution, thus improving the geomorphological cor-nice process understanding. A conceptual annual model in-cluding the seasonal cornice dynamics has been established (Fig. 6). It shows that the cornices are seasonal and existed during the two observed snow seasons from the beginning of October to the end of July, when the last cornice remnants melted away along the plateau edge.
The extensive plateau mountain Gruvefjellet with the very distinct western edge located almost perpendicular to the pre-vailing winter wind direction, are the key factors control-ling significant cornice development that was studied. The 26 days of cornice accretion occurred throughout the entire snow season under a wide range of air temperatures, with a mean hourly maximum wind speed of 12 m s−1and the
av-erage duration of the storms lasting 46 h in the snow season 2008/2009 and 54 h in the snow season 2009/2010. Only in the second snow season, two periods of cornice scouring could be identified, which both reduced the cornice mass ver-tically by 4 cm, but also somewhat horizontally. The cornice scouring events indicate that strong winds towards the lead-ing edge can erode the cornices and thus have a significant effect of the cornice development.
Pronounced air temperature fluctuation induced by low-pressure system reaching Svalbard, causing snowstorms, led to the opening of the cornice tension cracks detaching the cornice main mass from the plateau edge due to additional loading of the cornices. In some cases initial tilting of the cornice mass due to deformation prior to the appearance of cornice cracks was observed. Despite large air temperature variations the cornice crack opening revealed a linear open-ing distance, which we attribute to constant snow creep at the cornice foot, where the temperature conditions remain steady due to thick snow covering insulation and thus en-abling the freezing onto the backwall in the permafrost envi-ronment. Thus the entire cornice mass was bending down-wards around a pivot point. In some cases the central cor-nice mass detached from the ridgeline exposing cracks up to 3–4 m wide. The three conducted series of crack widen-ing measurements indicate varywiden-ing average openwiden-ing rates of 0.43, 2.76 and 8.6 cm day−1. Only the highest rate from the
short series of measurements led to a complete cornice
fail-ure. The micro-topography of the ridgeline presumably con-trols the cornice crack opening rate as well as the particular break over point of the cornice. The installation of tiltmeters at an early stage of cornice development might give deeper insights into the processes leading up to the appearance of cornice cracks, but certainly pose a high risk of losing the equipment due to complete failure. The duration from ini-tial cracking to eventual failure of the cornices was on aver-age four to five weeks, but not all cornices failed completely. In the cases of entire cornice fall avalanches, the meteoro-logical conditions leading directly up to the cornice failures were of less significance than the duration since crack initia-tion. Distinct air temperature variations and significant snow loading/growth of the cornices mainly associated with storm events, however, are found to account for initial cracking of the cornices, which thus may lead to eventual failure after a period of time.
In the snow seasons that were studied, 180 cornice failures were observed, of which 70 were categorized as “D2R3” and larger cornice fall avalanches. 80 % of the cornice failures occurred towards the end of the snow season in June. How-ever, cornice fall avalanches in the early part of the snow seasons were in particular entire cornice failures displaying the brittle behaviour of cornices. The seven largest cornice fall avalanches were classified as “D3R4” avalanches, which reached relatively close to inhabited housing infrastructure without permanent protective measures. Comparing these results with avalanche field observations since 2005/2006 re-vealed an annual return period of “D3R4” size cornice fall avalanches in the studied slope section. Therefore cornice fall avalanches represent a recurrent natural hazard for the residents and infrastructure in the Nybyen area. Continu-ous observations might be useful to develop more sophisti-cated models for large-scale cornice avalanche failures, and to refine the forecasting accuracy. However, our results also highlight that cornice fall avalanches are in particular hard to forecast and that any type of warning is not an adequate mea-sure to take to enmea-sure safety of the housing at risk. Permanent protective measures either on the plateau, along the plateau edge or located on the basal concavity of the slope would without doubt increase the safety for life and infrastructure.
Acknowledgements. This project was financed partly by the Uni-versity Centre in Svalbard, UNIS and the CRYOSLOPE Svalbard Norklima research project 2006–2009, coordinated from the Uni-versity Centre in Svalbard. Researchers in the project are thanked for valuable scientific discussions, especially Ole Humlum. We also want to acknowledge Ulrich Neumann for brilliantly helping with fieldwork and field instrument maintenance. The aerial image and DEM in Fig. 1 are kindly provided by Ernst Hauber from the German Aerospace Center, Institute of Planetary Research. Comments from reviewers K. Kronholm and B. Glude assisted us in clarifying our results.
digital camera, Ann. Glaciol., 32, 102–108, 2001.
Conway, H.: The impact of surface perturbations on snow-slope stability, Ann. Glaciol., 26, 307–312, 1998.
Dickson, R. R., Osborn, T. J., Hurrell, J. W., Meincke, J., Blind-heim, J., Adlandsvik, B., Vinje, T., Alekseev, G., and Maslowski, W.: The Arctic ocean response to the North Atlantic Oscillation, J. Climate, 13, 2671–2696, 2000.
Eckerstorfer, M. and Christiansen, H.: The “High Arctic Maritime Snow Climate” in Central Svalbard, Arctic. Alpine Res., 43, 11– 21, 2011a.
Eckerstorfer, M. and Christiansen, H.: Topography and meteorolog-ical control on snow avalanching in the Longyearbyen area, cen-tral Svalbard 2006–2009, Geomorphology, 134, 186–196, 2011b. Eckerstorfer, M. and Christiansen, H. H.: Meteorology, topogra-phy and snowpack conditions causing extreme mid-winter slush and wet slab avalanches in High Arctic maritime Svalbard, Per-mafrost Periglac., in press.
Førland, E. J., Hanssen-Bauer, I., and Nordli, P.Ø.: Climate statis-tics and longterm series of temperature and precipitation at Sval-bard and Jan Mayen, Norwegian Meteorological Institute, Klima, 21, 1–72, 1997.
Greene, E. M., Birkeland, K. W., Elder, K., Johnson, G., Landry, C., McCammon, I., Moore, M., Sharaf, D., Sterbenz, C., Trem-per, B. and Willimas, K.: Snow, Weather, and Avalanches: Ob-servational Guidelines for Avalanche Programs in the United States, American Avalanche Association, Pagosa Springs, Col-orado, 150, 2004.
Hákonardóttir, K. M., Margreth, S., Tómasson, G. G., Indriłda-son, H. D., and ÞórˇoarIndriłda-son, S.: Snow drift measures as protection against snow avalanches in Iceland, International Symposium on Mitigative Measures against Snow Avalanches, Egilsstałdir, Ice-land, 2008.
Hanssen-Bauer, I., Kristensen Solås, M., and Steffensen, E. L.: The climate of Spitsbergen, Norwegian Meteorological Institute, 1990.
Humlum, O.: Modelling late 20th-century precipitation in Nor-denskiold Land, Svalbard, by geomorphic means, Norsk Geogr. Tidsskr., 56, 96–103, 2002.
Humlum, O., Instanes, A., and Sollid, J. L.: Permafrost in Svalbard: a review of research history, climatic background and engineer-ing challanges, Polar Res., 22, 191–215, 2003.
Jaedicke, C. and Gauer, P.: The influence of drifting snow on the location of glaciers on western Spitsbergen, Svalbard, Ann. Glaciol., 42, 237–242, 2005.
Kobayashi, D., Ishikawa, N., and Nishio, F.: Formation process and direction distribution of snow cornices, Cold Reg. Sci. Technol., 15, 131–136, 1988.
forces in the development of snow cornices, J. Glaciol., 9, 375– 384, 1970.
Major, H., Haremo, P., Dallmann, W., and Andresen, A.: Geologi-cal map of Svalbard. 1:100 000, C9G Adventdalen, Norsk Polar-inst, Temakart, 31–32, 2001.
McCarty, D., Brown, R. L., and Montagne, J.: Cornices: Their Growth, Properties, and Control, International Snow Science Workshop, Lake Tahoe, 1986.
McClung, D. M. and Schaerer, P.: The Avalanche Handbook, 3rd Edition, The Mountaineers, Seattle, 342 pp., 2006.
Met.no, eklima: Free access to weather- and climate data from Nor-wegian Meteorological Institute form historical data to real time observations, www.eklima.no, last access: Mai 2011, 2011. Montagne, J., McPartland, J. T., Super, A. B., and Townes, H. W.:
The Nature and control of snow cornices on the Bridger Range, Southwestern Montana, Alta Avalanche Study Center, Miscella-neous Report No. 14, 1968.
Naruse, R., Nishimaru, H., and Maeno, N.: Structural Character-istics of Snow Drifts and Cornices, Ann. Glaciol., 6, 287–288, 1985.
Paulcke, W. and Welzenbach, W.: Schnee, Wächten, Lawinen, Zeitschrift für Gletscherkunde, Eiszeitforschung und Geschichte, 16, 49–69, 1928.
Rogers, J. C., Yang, L., and Li, L.: The role of Fram Strait win-ter cyclones on sea ice flux and on Spitsbergen air temperatures, Geophys. Res. Lett., 32, L06709, doi:10.1029/2004GL022262, 2005.
Schweizer, J. and Jamieson, B.: On surface warming and snow in-stability, International Snow Science Workshop, Squaw Valley, 2010.
Seligman, G. L: Snow structures and ski fields, Macmillian, Lon-don, 555 pp., 1936.
Sokratov, S. A. and Sato, A.: The effect of wind on the snow cover, Ann. Glaciol., 32, 116–120, 2001.
Vogel, S.: Cornice accretion, cracking and failure along with their meteorological controls at Gruvefjellet, Central Svalbard, UiO/UNIS, Oslo/Longyearbyen, 102 pp., 2010.