Solid Earth, 5, 327–337, 2014 www.solid-earth.net/5/327/2014/ doi:10.5194/se-5-327-2014
© Author(s) 2014. CC Attribution 3.0 License.
Seismic structure of the lithosphere and upper mantle beneath the
ocean islands near mid-oceanic ridges
C. Haldar1, P. Kumar1, and M. Ravi Kumar1
1National Geophysical Research Institute (CSIR), Uppal Road, Hyderabad-500007, India
Correspondence to:P. Kumar ([email protected])
Received: 4 September 2013 – Published in Solid Earth Discuss.: 7 October 2013 Revised: 21 March 2014 – Accepted: 21 March 2014 – Published: 19 May 2014
Abstract. Deciphering the seismic character of the young lithosphere near mid-oceanic ridges (MORs) is a challeng-ing endeavor. In this study, we determine the seismic struc-ture of the oceanic plate near the MORs using the P-to-S
conversions isolated from quality data recorded at five broad-band seismological stations situated on ocean islands in their vicinity. Estimates of the crustal and lithospheric thickness values from waveform inversion of the P-receiver function
stacks at individual stations reveal that the Moho depth varies between∼10±1 km and∼20±1 km with the depths of the lithosphere–asthenosphere boundary (LAB) varying between
∼40±4 and ∼65±7 km. We found evidence for an ad-ditional low-velocity layer below the expected LAB depths at stations on Ascension, São Jorge and Easter islands. The layer probably relates to the presence of a hot spot corre-sponding to a magma chamber. Further, thinning of the up-per mantle transition zone suggests a hotter mantle transition zone due to the possible presence of plumes in the mantle beneath the stations.
1 Introduction
Mid-oceanic ridges (MORs) are the largest sources of magma on the earth. Being the locus of new lithosphere gen-eration and accretion to the existing ones, their study as-sumes importance in understanding the dynamics of plate tectonics. These linear features on the ocean floor control the rheology of oceanic lithosphere, ridge topography, the style of oceanic crustal accretion and also affect the earth’s deeper discontinuities. Created at the mid-oceanic ridges, new oceanic lithosphere undergoes cooling and thickening as it subsequently spreads away and again plunges
down-ward into the mantle along the trenches by the process of subduction. In a broader perspective, the thermal contrac-tion of lithosphere created at the ridge also defines the shape of the mid-oceanic ridge (Parsons and Sclater, 1977). The lithosphere is the rigid outer shell, made up of the crust and the uppermost part of the mantle that floats over a lower-viscosity asthenosphere that is seismically characterized by a low-velocity zone. The first seismic observation of the as-thenospheric low-velocity layer was reported by Gutenberg, at a depth range of∼50–200 km (Gutenberg, 1959). There-fore, any velocity reduction in the uppermost mantle, similar to the one at the lithosphere–asthenosphere boundary (LAB), has been sometimes referred to as the Gutenberg (G) discon-tinuity (Revenaugh and Jordan, 1991), which may define the top of the low-velocity layer.
plates have been made through a number of seismological studies at different locations beneath the Pacific Ocean (Ga-herty, 1999; Tan and Helmberger, 2007; Kawakatsu, 2009; Kumar and Kawakatsu, 2011; Kumar et al,. 2012; Rychert and Shearer, 2011; Schmerr, 2012, etc.). Logistic problems and the extreme costs compared to land surveys impose se-vere constraints on obtaining similar information about the nature of other MORs. Another factor which hampers body-wave observations from the oceanic data is the water rever-berations that mostly contaminate the vertical components of the seismograms of the ocean bottom seismometers (Ku-mar et al., 2012). In this study, we attempt to investigate the seismic structure using the available data from five seismo-logical stations situated on the islands located close to the mid-oceanic ridges. Although the crustal structure may not truly represent the nature of the oceanic plate due to possi-ble influence of the islands, the deeper structure is devoid of such effects.
2 Data and methods
We used all the available teleseismic data recorded at sta-tions located on five oceanic islands near MORs. The lo-cations of the stations are shown in Fig. 1, together with the major plate boundaries and mid-oceanic ridges. In the present study, we use converted wave techniques, namely
P-receiver functions (PRFs) (Burdick and Langston, 1977;
Langston, 1977; Vinnik, 1977). Receiver functions are time series, computed from three component seismograms, which show the relative response of the earth structure near the re-ceiver. The events with magnitude≥5.5 Mb in the epicentral distance range of 30–90◦are selected from all available back
azimuths. We visually picked the waveforms having clearP
-waves in the vertical component for further analysis. First, the Z, N and E components are rotated into Z (vertical), R (radial), and T (transverse) system using back azimuths de-rived from the waveforms. We further rotate the ZRT com-ponents into the LQT system using the theoretical angle of incidence determined by the global velocity model IASP91 and also with the angle of maximum polarization direction of P-wave. We chose only those events whose differences
in theoretical and waveform back-azimuth and incidence an-gle are less than 30◦and 5◦, respectively. Further, we derive theP-receiver functions in time domain by deconvolving the
radial components by their respective vertical ones. The de-convolution makes the equalization of source and propaga-tion path effects. All of the above steps involved in compu-tation ofP-receiver functions are performed using the codes
written in Seismic Handler (http://www.seismic-handler.org, K. Stammler, 1992), a seismological analysis tool. The P
-receiver functions thus obtained are then moveout corrected to a reference slowness of 6.4 s/◦ (Yuan, 1997) in order to remove the dependence of the travel times of the converted phases on the source receiver distance. In addition, we stack
severalP-receiver functions after moveout correction, to
en-hance the signal to noise ratio.
3 Modeling of receiver functions
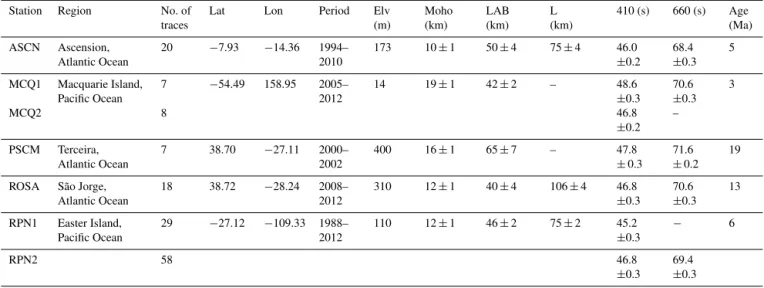
At each of the stations, the stacked receiver function traces along with the 2 sigma error limits, computed utilizing the bootstrap resampling technique, are shown in Fig. 2. In this bootstrap analysis, a single receiver function stack is gen-erated by summation of those traces indicated by a random number generator where the number of traces for summation remains the same as the total number ofP-receiver functions
at a given station. This procedure is repeated 500 times, by stacking a totally different sequence of traces corresponding to randomly generated trace numbers. The mean and stan-dard deviations of the amplitudes from 500 realizations at each point on the time axis are then calculated. In Fig. 2, we marked the prominent phases, namely Moho, LAB and another low-velocity layer (L). All these phases have their amplitudes above the 2 sigma error limit. Although the posi-tive conversions from the Moho and a negaposi-tive one from the LAB are prominent in this figure, the multiples from either of these are not obvious. This could be because of to their annihilation due to interference from other phases.
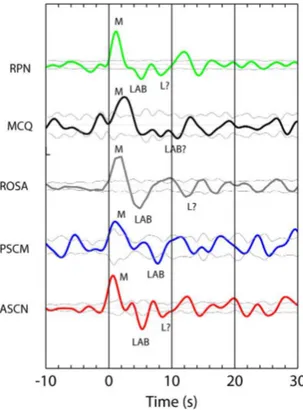
In order to constrain the seismic structure of the litho-sphere, the stacks of the moveout-corrected traces at each station are inverted using a linearized time domain iterative waveform inversion scheme (Ammon et al., 1990), where for each model, the synthetic seismograms for the slowness cor-responding to the stacked trace are computed using the re-flectivity method (Fuchs and Müller, 1971; Kind, 1978). We allowed the generation of all primary and multiple phases. The synthetic traces are rotated and deconvolved in the same manner as the observed traces, for a meaningful comparison. The receiver function results are summarized in Table 1 and the stacked traces observed are shown in Fig. 2. Since the islands are volcanic in nature, the velocities and crustal thickness values from other studies are used as constraints in the inversion. While modeling theP-receiver functions
at various stations, the velocity of the basaltic layer was adopted from the available published values (Rodgers and Harben,1999; Christensen, 1973). Also, the velocities in the crustal part are kept close to the estimates obtained regionally and globally from active seismic experiments (Shinohara, 2008; White, 1992), except for the station ROSA, where the data required a top layer to have very low shear velocity, probably due to the presence of sediments near the surface.
The piercing points of theP-to-Sconversions at a depth
of 100 km, plotted in the inset maps for each station in Fig. 1, reveal a maximum offset of 0.5◦. Since we model the stacked traces, any lateral heterogeneity within 0.5◦is averaged. Fig-ure 3 shows the corresponding L-components of our stack traces, which essentially contain only the P-waves as first
C. Haldar et al.: Seismic structure of the lithosphere 329
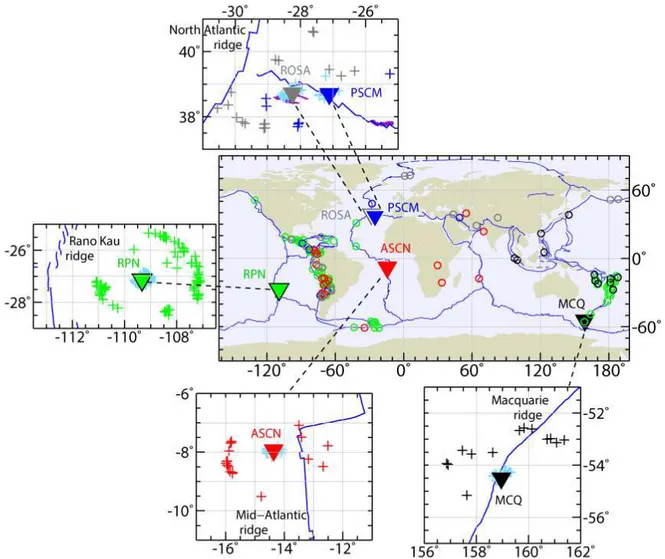
Figure 1.Location of the seismic stations (inverted triangles) used in the present study. Mid-oceanic ridge (MOR) boundaries are also shown
(blue lines) with their names in the inset maps. The color code of the stations corresponds to the colors of the lines in Figs. 2 and 4. Open circles indicate the geographical distribution of the events corresponding to the stations of the same color. Insets corresponding to each station show their relative position with respect to the mid-oceanic ridges. The crosses in the insets are theP-to-Sconversion points corresponding to the depths at 100 km (cyan, nearest to the station) and at 520 km (same color as the corresponding station, farther away).
station from inversion, together with the waveform matching of the observed and synthetic traces. Apart from the Moho and LAB, the models reveal additional low-velocity layers (L) in the sub-lithospheric mantle below the three stations RPN, ROSA and ASCN.
4 Results and discussions
4.1 Mid-Atlantic Ridge (PSCM, ROSA and ASCN) Our modeling results indicate that the crust–mantle bound-ary is located at depths of∼12±1, 16±1 and 10±1 km for ROSA, PSCM and ASCN respectively. Both the stations PSCM (in Terceira) and ROSA (in São Jorge), in the middle of the North Atlantic Ocean (see Fig. 1), are volcanic in ori-gin and about 10 km away from the MOR, making them some of the closest landmasses to an active, oceanic spreading
cen-ter. ASCN is located in the South Atlantic Ocean on Ascen-sion, a volcanic island located 100 km west of the MOR.
Table 1.The Moho, LAB and LVL depths beneath the stations used in this study, together with theP-to-Sconversion times from the upper mantle discontinuities.
Station Region No. of
traces
Lat Lon Period Elv
(m)
Moho (km)
LAB (km)
L (km)
410 (s) 660 (s) Age (Ma) ASCN Ascension,
Atlantic Ocean
20 −7.93 −14.36 1994– 2010
173 10±1 50±4 75±4 46.0
±0.2
68.4
±0.3 5
MCQ1 Macquarie Island, Pacific Ocean
7 −54.49 158.95 2005–
2012
14 19±1 42±2 – 48.6
±0.3
70.6
±0.3 3
MCQ2 8 46.8
±0.2 –
PSCM Terceira, Atlantic Ocean
7 38.70 −27.11 2000–
2002
400 16±1 65±7 – 47.8
±0.3 71.6
±0.2 19
ROSA São Jorge, Atlantic Ocean
18 38.72 −28.24 2008–
2012
310 12±1 40±4 106±4 46.8
±0.3
70.6
±0.3 13
RPN1 Easter Island, Pacific Ocean
29 −27.12 −109.33 1988– 2012
110 12±1 46±2 75±2 45.2
±0.3
− 6
RPN2 58 46.8
±0.3
69.4
±0.3 ±indicates the±2 SE in these values.
is much further from the main north Mid-Atlantic Ridge compared to ROSA. These two stations are situated on a complex triple junction. The possible reason for this discrep-ancy might be due to the influence of the compositional na-ture of the oceanic islands and structural complexity as evi-dent from the surface bathymetry.
4.2 Rano Kau Ridge (RPN) and Macquarie Ridge (MCQ)
Station RPN is situated on Easter Island∼350 km east from the Rano Kau Ridge in the Pacific, while station MCQ is lo-cated on Macquarie Island, which lies in the middle of the Macquarie Ridge (Duncan et al., 1998; Tapley et al., 2004). Both these volcanic islands are dominated by the presence of basalt and gabbro (Duncan and Varne, 1988; Jorg, 2005). The results of receiver function modeling (Fig. 5) suggest a crustal thickness of ∼12±1 km and a plate thickness of 46±2 km at station RPN. On the other hand, the crust is much thicker (∼19±1 km) below the station MCQ and the observation of LAB is dubious. The negative phases seen close to 6 s and 10 s are barely above the error limit (Fig. 2). Station MCQ is directly located on the MOR, but the re-trieved Moho depth is larger than expected. This might be due to the fact that the observations are more representative of the islands. The LAB depth found below RPN is consis-tent with the results obtained earlier from S receiver
func-tions (Heit et al., 2007; Li, et al., 2003). This study suggests that the numerical value corresponding to the negative dis-continuity below RPN might correspond to an oceanic LAB.
4.3 Shear-wave velocity drop across LAB
There are a number of models that describe the generation and migration of melt in a ridge system (Spiegelman and McKenzie, 1987; Phipps-Morgan, 1987; Sparks and Parmen-tier, 1993; Garmany, 1989; Buck and Su, 1989; Kelemem et al., 1997, etc.). However, geophysical studies, which help in constraining the existing models, are quite limited. The most important geophysical study aimed at deciphering the melt generation was the MELT experiment (Forsyth, 1992). Re-sults from inversion of Love wave dispersion data from the East Pacific Rise revealed an asymmetric velocity structure across the ridge (Dunn and Forsyth, 2003), where a crustal magma chamber is confined.
Our modeling results suggest variable shear-wave velocity contrasts across the LAB for the five stations on the oceanic islands close to the mid-oceanic ridges. The inversion results reveal that the first-order discontinuities are not characterized by an abrupt change in shear velocity. The need for incorpo-rating a gradational nature of the velocity interfaces in order to fit the observed and computed waveforms is due to lack of multiples. The velocity contrast across the LAB varies from
C. Haldar et al.: Seismic structure of the lithosphere 331
Figure 2.ObservedP-receiver function stacks (solid lines) at the
five stations. Before stacking, the receiver functions are low-pass fil-tered with a corner frequency of 3 s and moveout corrected to a ref-erence slowness of 6.4 s/◦using the IASP91 Earth model. The two gray lines on both sides of the mean lines represent the 2σstandard error estimated using bootstrap resampling technique. The color codes correspond to different stations: Black, MCQ; Red, ASCN; Blue, PSCM; Green, RPN and Grey, ROSA. Different disconti-nuities are marked as M, Moho; LAB, lithosphere–asthenosphere boundary and L. sub-lithospheric low-velocity layer.
of partial melts in the uppermost mantle (i.e., Humphreys and Dueker, 1994; Zhao et al., 1992; Sobolev et al., 1996; Xu and Wiens, 1997; Dunn and Toomey, 1997; Kawakatsu et al., 2009). The sharp and abrupt drop in shear-wave ve-locity can be reconciled by the fact that the hot mantle up-welling near the ridges possibly enhances the reflectivity of the LAB (Schmerr, 2012). Moreover, the fraction of melt re-tention in the asthenosphere may cause such a large drop in shear velocity. Inclusion of little more than 1 % melt in the asthenosphere, in addition to the temperature contrast, pro-vides a realistic explanation of this velocity drop (Hammond and Humphreys, 2000; Rychert et al., 2012). Karato (1990) indicated that the presence of H2O in olivine weakens the
material. Recently, Karato (2013) argued against the vari-ous partial melt models to explain the seismically observed anomalies and emphasized the important role played by the geometry of melt. However, the presence of hydrogen in the uppermost mantle may present an alternate model (Dai and Karato, 2009). Anelastic relaxation caused by the elastically accommodated grain-boundary sliding may also be a cause
Figure 3.Stacked L-component receiver functions at different
sta-tions that essentially indicate theP-wave at zero time.
of large velocity drops of more than 5 % (Karato, 2012). In the normal oceanic (not ocean island) plate, there is an indi-cation of an abrupt increase in electrical conductivity (Shank-land and Waff, 1977; Honkura, 1975; Utada and Baba, 2013), often interpreted as the electrical asthenosphere, favoring the idea of partial melts. Interestingly this layer corresponds to the seismologically identified layer.
Figure 6 illustrates the variation of plate thickness with age. It is clearly seen that the seismologically estimated lithospheric thicknesses in oceanic environment generally show an asymptotic increase with age, in agreement with the thermally predicted models (e.g., Stein and Stein, 1992; Kawakatsu et al., 2009). The presence of a significant scat-ter in the data requires incorporation of additional controlling factors. The present values obtained from the receiver func-tion analysis (Table 1) seem to fill the existing gap in the lower end of the age spectrum and are consistent with the already observed values using the receiver function analysis.
5 Sub-lithospheric low-velocity layer
The observedP-receiver function traces (Figs. 2, 4 and 5)
-0.4 -0.2 0.0 0.2 0.4
-5 0 5 10 15 20
Time (s) 0 50 100 150 Depth (km)
2 3 4 5
Vs (km/s) 0 50 100 150 Depth (km)
2 3 4 5
Vs (km/s) 0 50 100 150 Depth (km)
2 3 4 5
Vs (km/s) 0 50 100 150 Depth (km)
2 3 4 5
Vs (km/s) -0.2 -0.1 0.0 0.1 0.2
-5 0 5 10 15 20
Time (s) 0 50 100 150 Depth (km)
2 3 4 5
Vs (km/s) 0 50 100 150 Depth (km)
2 3 4 5
Vs (km/s) 0 50 100 150 Depth (km)
2 3 4 5
Vs (km/s) 0 50 100 150 Depth (km)
2 3 4 5
Vs (km/s) -0.2 -0.1 0.0 0.1 0.2
-5 0 5 10 15 20
Time (s) 0 50 100 150 Depth (km)
2 3 4 5
Vs (km/s) 0 50 100 150 Depth (km)
2 3 4 5
Vs (km/s) 0 50 100 150 Depth (km)
2 3 4 5
Vs (km/s)
M M
a
b
c
M ROSA PSCM ASCN L LAB L LAB LAB
Figure 4.Models obtained by inversion of stacked traces in the bottom panel (colored as in Fig. 1) of each subplot. Synthetic traces (black
dashed lines) computed from these models fit the observed traces well for the stations PSCM, ROSA and ASCN. The two gray lines that bound the thick colored lines model in the upper panel of each subplot are the±2 SE in the velocity models derived from inversion. The dashed black line shows the 1-D starting velocity model used to invert the data.
-0.2 -0.1 0.0 0.1 0.2
-5 0 5 10 15 20
Time (s) 0 50 100 150 Depth (km)
2 3 4 5
Vs (km/s) 0 50 100 150 Depth (km)
2 3 4 5
Vs (km/s) 0 50 100 150 Depth (km)
2 3 4 5
Vs (km/s) 0 50 100 150 Depth (km)
2 3 4 5
Vs (km/s) -0.2 -0.1 0.0 0.1 0.2
-5 0 5 10 15 20
Time (s) 0 50 100 150 Depth (km)
2 3 4 5
Vs (km/s) 0 50 100 150 Depth (km)
2 3 4 5
Vs (km/s) 0 50 100 150 Depth (km)
2 3 4 5
Vs (km/s) 0 50 100 150 Depth (km)
2 3 4 5
Vs (km/s)
b
MCQ RPN
a
M M LAB LAB LFigure 5.Same as Fig. 4 for the stations RPN and MCQ.
those predicted by the cooling model for the ocean litho-sphere. The converted phases related to the deeper low-velocity layers (Fig. 2) below RPN, ROSA and ASCN are observed much beyond the error limits. Owing to the prox-imity of these stations to the mid-oceanic ridges, the possible source for the generation of these LVLs may be related to the source of magma at a depth range of∼75–106 km, from where the magma ascends along narrow lithospheric open-ings. For the region close to the ridges, occurrence of
C. Haldar et al.: Seismic structure of the lithosphere 333
Figure 6. Observed lithospheric thickness values plotted against
their age. Different color symbols denote data from different sources and red open circles denote the observations from the present study. Isotherms (gray contour lines with a 200◦C interval) and the estimated top of partial melting region (the black, dashed contour line) are taken from Kawakatsu et al. (2009). KK: Kumar and Kawakatsu et al. (2011).
low-velocity layers (L), as observed along the Mid-Atlantic Ridge, where regions affected by the shallow mantle plumes are detected.
An interesting review by Sinton and Detrick (1992) pre-sented geophysical and petrological evidence for the distribu-tion and behavior of magma bodies beneath the ridges. When these magma bodies assume a crystalline form greater than about 50 %, rheologically they behave much like a solid. The presence of melts in the lower crust and also in the upper mantle is suggested by active source tomography (Toomey et al., 1990; Dunn and Toomey, 1997) and compliance tech-niques (Crawford et al., 1991; Crawford et al., 1998; Craw-ford and Webb, 2002). In the latter technique, the pressure field caused by the long-period ocean waves that deform the sea floor is studied. The relation between pressure and de-formation is called compliance and used to investigate the structure under MOR locations.
6 Upper mantle discontinuities
Figure 7 shows theP-receiver function stacks at individual
stations after the application of a low-pass filter with a corner frequency of 6 s in the time domain. The stacks clearly reveal the global upper mantle seismic discontinuities typically de-tected at 44.1 and 68.1 s. The lateral extent of theP-to-S
con-version points at a depth of 520 km (insets in Fig. 1) suggests that they sample regions far away from the ridges. Stacked traces, in fact, represent an average character of the upper mantle below the station. Due to the large sampling of upper mantleP-to-Sconversions, we grouped the traces in such a
way that one group is far from the ridge and other nearer to it. Station RPN (in Fig. 7) has two groups labeled as RPN1
and RPN2. Similarly, we made two clusters for MCQ. Other stations like ASCN, ROSA and PSCM have only one cluster, since the other clusters had much fewer traces. The P -to-Sconversion times from the 410 and 660 km discontinuities
with their errors are depicted in Table 1. The oceanic stations reveal a delay in both the phases (see Table 1). These seis-mic discontinuities are globally observed and generally inter-preted to be formed due to a phase transformation in the man-tle from olivine to spinel and from spinel-structured gamma phase to perovskite-structured magnesiowüstite (Duffy and Anderson, 1989) respectively. These phases are in a state of equilibrium governed by the temperature and pressure at those depths, described by the Clapeyron slope. The Clapey-ron slope is positive and negative for the 410 and 660 km discontinuities respectively (e.g., Bina and Helffrich, 1994). Thus, the respective locations of these phases can be inter-preted in terms of the temperature in the upper mantle. For temperatures in excess of∼200◦C, the separation between
these discontinuities can be reduced by∼20–30 km (Helf-frich, 2000). TheP-to-Sconversion times of the upper
man-tle discontinuities also depend on the average shear velocity in the upper mantle, implying that any discrepancies in these timings are related to the velocity perturbation in the upper-most mantle. The delays in both the phases might also indi-cate the lower average velocity in the upper mantle implying a thinner mantle lid and/or higher temperature of the oceanic lithosphere as compared to the continental mantle, corrobo-rated by the LAB at shallower depths.
Figure 7.Stacked receiver functions similar to Fig. 2 but shown to deeper depths in order to display the upper mantle discontinuities. The traces are low-pass filtered with corner frequency of 6 s and moveout corrected to a reference slowness of 6.4 s/◦using the IASP91 Earth model prior to stacking. Two bounding blue lines parallel to the mean represent 2 sigma error bounds. The stack traces are based on the geographical locations at a depth of 520 km forP-to-Sconversions. We grouped those data that fall near and far away from the mid-oceanic ridge in order to avoid any structural complexities. For the station ASCN we made only one cluster since the data near the ridge are too scant to make a meaningful stack. All stations show clear arrivals of the Ps conversions from the 410 and 660 km discontinuities (marked by short red lines) and they are delayed with respect to the predicted times from the IASP91 global Earth models (dashed lines).
hand, for the station RPN, the transition zone is thinner on the eastern side of the ridge by∼14 km (1.4 s) .
7 Conclusions
P-receiver function analysis at the five stations located near
the mid-ocean ridges reveals significant converted energy from the crust–mantle boundary, LAB and an additional deeper low-velocity layer (L). Modeling results reveal that the Moho depths vary from ∼10 km to ∼20 km. Hence, we conclude that the crustal thickness beneath the MORs is∼15 km. The LAB depths beneath the MORs vary from
∼40 km to ∼65 km. The observed LAB depths are con-sistent with the thermal cooling model (Stein and Stein, 1992); however, the depth estimates may not represent a pure oceanic plate in view of the contamination from the com-position of the ocean islands on which the stations are
C. Haldar et al.: Seismic structure of the lithosphere 335
Acknowledgements. Seismic data are from IRIS, DMC. Seismic data analysis was performed in Seismic Handler (K. Stammler). Plots are generated using Generic Mapping Tool (Wessel and Smith, 1995). Xiaohui Yaun (GFZ) provided the moveout script. Thanks to Rainer Kind for his valuable suggestions on the initial version of the manuscript. M. K. Sen, the director of NGRI has kindly permitted the publication of this work. Chinmay Haldar is a PhD student funded by the University Grants Commission (UGC). This work has been performed under the GENIAS Project PSC0104 (PK) of CSIR-NGRI. We thank the Topical Editor, J. Plomerova, for constructive suggestions and excellent handling of the manuscript. We thank an anonymous reviewer and W. Geissler for their thoughtful and constructive comments and suggestions that improved the original manuscript.
Edited by: J. Plomerova
References
Agee, C. B.: Phase transformations and seismic structure in the up-per mantle and transition zone, in: Ultrahigh-Pressure Mineral-ogy: Physics And Chemistry of the Earth’s Deep Interior, edited by: Hemley, R. J., Reviews in Mineralogy, Mineralogical Society of America, Washington DC, 37, 165–201, 1997.
Atwater, T. and Mudie, J. D.: Block faulting on the Gorda Rise, Science, 159, 729–731, 1968.
Backus, G. E.: Long-wave elastic anisotropy produced by horizon-tal layering, J. Geophys. Res., 67, 4427–4440, 1962.
Ballard, R. D. and Van Andel, T. H.: Morphology and tectonics of the inner rift valley at lat. 36◦50′N on the Mid-Atlantic Ridge, Geol. Soc. Am. Bull., 88, 507–530, 1977.
Barclay, A. H. and Toomey, D. R.: Shear wave splitting and crustal anisotropy at the Mid-Atlantic Ridge, 35◦N, J. Geophys. Res, 108, 2378, doi:10.1029/2001JB000918, 2003.
Bina, C. R. and Helffrich, G.: Phase transition Clapeyron slopes and transition zone seismic discontinuity topography, J. Geo-phys. Res., 99, 15853–15860, 1994.
Bjarnason, I., Menke, W., Flovenz, O., and Caress, D.: Tomographic image of the spreading center in southern Iceland, J. Geophys. Res., 98, 6607–6622, 1993.
Brozena, J. M.: Temporal and spatial variability of sea-floor spread-ing processes in the northern South-Atlantic, J. Geophys. Res., 91, 497–510, 1986.
Buck, W. R. and Su, W.: Focused mantle upwelling below mid-ocean ridges due to feedback between viscosity and melting, Geophys. Res. Lett., 16, 641–644, 1989.
Burdick, L. J. and Langston, C. A.: Modelling crustal structure through the use of converted phases in teleseismic body wave forms, B. Seismol. Soc. Am., 67, 677–691, 1977.
Christensen, N. I.: Compressional and shear wave velocities in basaltic rocks: Deep Sea Drilling Project, Leg 16, in Initial Re-ports of the Deep Sea Drilling Project, XVI, 647–650, 1973. Crawford, W. C., Webb, S. C., and Hildebrand, J. A.: Seafoor
com-pliance observed by long-period pressure and displacement mea-surements, J. Geophys. Res., 96, 16151–16160, 1991.
Crawford, W. C., Webb, S. C., and Hildebrand, J. A.: Estimating shear velocities in the oceanic crust from compliance
measure-ments by two-dimensional finite difference modeling, J. Geo-phys. Res., 103, 9895–9916, 1998.
Crawford, W. C. and Webb, S. C.: Variations in the distribution of magma in the lower crust and at the Moho beneath the East Pa-cific Rise at 9◦–10◦N, Earth Planet. Sci. Lett., 203, 117–130, 2002.
Deuss, A.: Seismic observations of transition zone discontinuities beneath hotspot locations, Geol. Soc. Am., 430, 121–136, 2007. Du, Z. J. and Foulger, G. R.: The crustal structure beneath the north-west fjords, Iceland, from receiver functions and surface waves, Geophys. J. Int., 139, 419–432, 1999.
Duffy, T. S. and Anderson, D. L.: Seismic velocities in mantle min-erals and the mineralogy of the upper mantle, J. Geophys. Res., 94, 1895–1912, 1989.
Duncan, R. A. and Varne, R.: The age and distribution of the ig-neous rocks of Macquarie Island: Papers and Proceedings of the Royal Society of Tasmania, 122, 45–50, 1988.
Dunn, R. A. and Toomey, D. R.: Seismological evidence for three-dimensional melt migration beneath the East Pacific Rise, Na-ture, 388, 259–262, 1997.
Dunn, R. A. and Forsyth, D. W.: Imaging the transition be-tween the region of mantle melt generation and the crustal magma chamber with short-period Love wave propagation along the southern East Pacific Rise, J. Geophys. Res., 108, 2352, doi:10.1029/2002JB002217, 2003.
Efron, B. and Tibshirani, R.: An Introduction to the Bootstrap, Stan-ford University, California, USA, 1993.
Evangelidis, C. P., Minshull, T. A., and Henstock, T. J.: Three-dimensional crustal structure of Ascension Island from active source seismic tomography, Geophys. J. Int., 159, 311–325, 2004.
Forsyth, D. W.: Geophysical constraints on mantle flow and melt generation beneath mid-ocean ridges, In: mantle flow and melt generation at mid-ocean ridges, edited by: Morgan, J. P., Black-man, D. K., and Sinton, J. M., Geophys. Monogr. Ser., 71, 1–65, AGU, Washington, 1992.
Frederiksen, A. W. and Bostock, M. G.: Modelling teleseismic waves in dipping anisotropic structures, Geophys. J. Int., 141, 401–412, 2000.
Fuchs, K. and Müller, G.: Computation of synthetic seismograms with the reflectivity method and comparison with observations, Geophys. J. R. Astr. Soc., 23, 417–433, 1971.
Gaherty, J. B., Kato, M., and Jordan, T. H.: Seismological structure of the upper mantle: a regional comparison of seismic layering, Phys. Earth Planet. In., 110, 21–41, 1999.
Garmany, J.: Accumulations of melt at the base of young oceanic crust, Nature, 340, 628–632, 1989.
Gu, Y. J. and Dziewonski, A. M.: Global variability of transition zone thickness, J. Geophys. Res., 107, 2135, doi:10.1029/2001JB000489, 2002.
Gutenberg, B.: Physics of the Earth’s Interior, Academic Press, New York, 1959.
Hammond, W. C. and Humphreys, E. D.: Upper mantle seismic wave velocity: Effects of realistic partial melt geometries, J. Geo-phys. Res., 105, 10975–10986, 2000.
Helffrich, G.: Topography of the transition zone seismic disconti-nuities, Rev. Geophys., 38, 141–158, 2000.
Holtzman, B. K.: Melt segregation and strain partitioning: implica-tions for seismic anisotropy and mantle flow, Science, 301, 1227– 1230, 2003.
Holtzman, B. K. and Kohlstedt, D. L.: Stress-driven melt segrega-tion and strain partisegrega-tioning in partially molten rocks: Effects of stress and strain, J. Petrology, 48, 2379–2406, 2007.
Honkura, Y.: Partial melting and electrical conductivity anomalies beneath the Japan and Philippine seas, Phys. Earth Planet. Inter., 10, 128–134, 1975.
Humphreys, E. D. and K. G.: Dueker, Physicalstate of the western U.S. upper mantle, J. Geophys. Res., 99, 9635–9650, 1994. Jorg, W. E.: Fassbinder, Easter Island (Chile): Magnetometry of
ar-chaeological structures basaltic, J. Org. Geology, 2005. Kanamori, H. and Press, F.: How thick is the lithosphere?, Nature,
226, 330–331, 1970.
Karato, S.: The role of hydrogen in the electrical conductivity of the upper mantle, Nature, 347, 272–273, 1990.
Katz, R. F., Spiegelman, M., and Holtzman, B.: The dynamics of melt and shear localization in partially molten aggregates, Na-ture, 442, 676–679, 2006.
Kawakatsu, H., Kumar, P., Takei, Y., Shinohara, M., Kanazawa, T., Araki, E., and Suyehiro, K.: Seismic evidence for sharp lithosphere-asthenosphere boundaries of oceanic plates, Science, 324, 499–502, 2009.
Kelemen, P. B., Hirth, G., Shimizu, N., Spiegelman, M., and Dick, H. J.: A review of melt migration processes in the adiabatically upwelling mantle beneath oceanic spreading ridges, Phil. Trans. Roy. Soc. Lond., A, 355, 1–35, 1997.
Kendall, J. M.: Teleseismic arrivals at a mid-ocean ridge: effects of mantle melt and anisotropy, Geophys. Res. Lett., 21, 301–304, 1994.
Kind, R.: The reflectivity method for a buried source, J. Geophys., 44, 511–523, 1978.
Kind, R., Yuan, X., and Kumar, P.: Seismic receiver functions and lithosphere-asthenosphere Boundary, Tectonophysics, 536, 25– 43, 2012.
Kumar, P. and Kawakatsu, H.: Imaging the seismic lithosphere-asthenosphere boundary of the oceanic plate, Geochem. Geo-phys. Geosyst., 12, Q01006, doi:10.1029/2010GC003358, 2011. Kumar, P., Kawakatsu, H., Shinohara, M., Kanazawa, T., Araki, E., and Suyehiro, K.: P and S receiver function analysis of seafloor borehole broadband seismic data, J. Geophys. Res., 116, B12308, doi:10.1029/2011JB008506, 2011.
Langmuir, J., Klein, E. M., and Plank, T.: in Mantle Flow and Melt Generation at Mid-Ocean Ridges:American Geophysical Union, Washington, DC, 183–200, 1992.
Langston, C. A.: Corvallis, Oregon, crustal and upper mantle struc-ture from teleseismic P and S waves, B. Seismol. Soc. Am., 67, 713–724, 1977.
Leeds, A. R.: Lithospheric thickness in the western Pacific, Phys. Earth Planet. In., 11, 61–64, 1975.
Li, X., Kind, R., and Yuan, X.: Seismic study of upper mantle and transition zone beneath hotspots, Phys. Earth Planet Int., 136, 79–92, 2003.
Menke, W., Brandsdottir, B., Jakobsdottir, S., and Stefansson, R.: Seismic anisotropy in the crust at the Mid-Atlantic plate bound-ary in south-west Iceland, Geophys. J. Int., 119, 783–790, 1994.
Mierdel, K., Keppler, H., Smyth, J. R., and Langenhorst, F.: Water Solubility in Aluminous Orthopyroxene and underline Science and the Origin of Earth’s Asthenosphere, Science, 315, 364–368, 2007.
Montagner, J. P. and Ritsema, J.: Interactions between ridges and plumes, Science, 294, 1472–1473, 2001.
Nettles, M. and Dziewo’nski, A.: Radially anisotropic shear ve-locity structure of the upper mantle globally and beneath North America, J. Geophys. Res.-Sol. Ea., 113, B02303, doi:10.1029/2006JB004819, 2008.
Nowacki, A., Kendall, J. M., and Wookey, J.: Mantle anisotropy be-neath the Earth’s mid-ocean ridges, Earth Planet. Sc. Lett., 317– 318, 56–67, 2012.
Parsons, B. and Sclater, J. G.: An analysis of the variation of ocean floor bathymetry and heat flow with age, J. Geophys. Res., 82, 803–827, 1977.
Phipps Morgan, J.: Melt migration beneath mid-ocean spreading centers, Geophys. Res. Lett., 145, 1238–1241, 1987.
Revenaugh, J. and Jordan, T. H.: Mantle layering from reverbera-tions: 2. The transition zone, J. Geophys. Res., 96, 19763–19780, 1991.
Rodgers, A. and Harben, P.: Modeling the Conversion of Hydroa-coustic to Seismic Energy at Islands and Continental Margins: Preliminary Analysis of Ascension Island Data, 21st Seismic Re-search Symposium, Technologies for Monitoring the Compre-hensive Nuclear-Test-Ban Treaty Las Vegas, Nevada, 1999. Rychert, C. A. and Shearer, P. M.: A global view of the lithosphere–
asthenosphere boundary: Science, 324, 495–498, 2009. Rychert, C. A. and Shearer, P. M.: Imaging the
lithosphere-asthenosphere boundary beneath the Pacific using SS waveform modeling, J. Geophys. Res., 116, B07307, doi:10.1029/2010JB008070, 2011.
Schmerr, N.: The Gutenberg discontinuity: melt at the lithosphere-asthenosphere boundary, Science, 335, 1480–1483, 2012. Shankland, T. J. and Waff, H. S.: Partial melting and electrical
con-ductivity anomalies in the upper mantle, J. Geophys. Res., 82, 5409–5417, 1977.
Shearer, P. M.: Upper Mantle Seismic Discontinuities, American Geophysical Union, 115–131, 2000.
Shinohara, M., Fukano, T., Kanazawa, T., Araki, E., Suyehiro, K., Mochizuki, M., Nakahigashi, K., Yamada, T., and Mochizuki, K.: Upper mantle and crustal seismic structure beneath the North-western Pacific Basin using seafloor borehole broadband seis-mometer and ocean bottom seisseis-mometers, Phys. Earth Planet. In., 170, 95–106, 2008.
Sinton, J. M. and Detrick, R. S.: Mid-Ocean Ridge Magma Cham-bers, J. Geophys. Res., 97, 197–216, 1992.
Sobolev, S. V., Zeyen, H., Stoll, G., Werling, F., R. Althern, and K. Fuchs, Upper mantle temperatures from teleseismic tomography of French Massif Central including effects of composition, min-eral reactions, anharmonicity, anelasticity and partial melt. Earth Planet. Sci. Left., v. 139, p. 147-163, 1996.
C. Haldar et al.: Seismic structure of the lithosphere 337
Spiegelman, M. and McKenzie, D.: Simple 2-D models for melt extraction at mid-ocean ridges and island arcs, Earth Planet. Sci. Lett., 83, 137–152, 1987.
Stammler, K.: Seismic Handler: programmable multichannel data handler for interactive and automatic processing of seismological analysis: Comput. Geosci., 19, 135–140, 1993.
Stein, C. A. and Stein, S.: A model for the global variation in oceanic depth and heat flow with lithospheric age, Nature, 359, 123–129, 1992.
Tan, Y. and Helmberger, D. V.: Trans-Pacific upper mantle shear velocity structure, J. Geophys. Res., 112, B08301, doi:10.1029/2006JB004853, 2007.
Tapley, I., Dijkstra, A. H., and Brolsma, H.: The Geology, Land-forms and Topography of Sub-Antarctic Macquarie Island, Aus-tralia, as revealed by AIRSAR, Geosci. Remote Sens. Sympo-sium, 1, 2004.
Toomey, D. R., Purdy, G. M., Solomon, S. C., and Wilcock, W. S. D.: The three-dimensional seismic velocity structure of the East Pacific Rise, near latitude 9◦30′N, Nature, 347, 639–645, 1990. Utada, H. and Baba, K.: Estimating the electrical conductivity of the melt phase of a partially molten asthenosphere from seafloor magnetotelluric sounding data, Phys. Earth Planet. Int., doi:10.1016/j.pepi.2013.12.004, 2013.
Vinnik, L. P.: Detection of waves converted from P to SV in the mantle, Phys. Earth Planet. In., 15, 294–303, 1977.
White, R. S., McKenzie, D., and Onions, R. K.: Oceanic crustal thickness from seismic measurements and rare earth element in-versions, J. Geophys. Res., 97, 19683–19715, 1992.
Xu, Y. and Wiens, D. A.: Upper mantle structure of the southwest Pacific from regional waveform inversion, J. Geophys.Res., 102, 27439–27451, 1997.
Yaun, X., Ni, J., Kind, R., Mechie, J., and Sandvol, E.: Lithospheric and upper mantle structure of southern Tibet from a seismolog-ical passive source experiment, J. Geophys. Res., 102, 27491– 27500, 1977.
Zhang, Y. and Tanimoto, T.: High resolution global upper man-tle structure and plate tectonics, J. Geophys. Res, 98, 148–227, 1993.