IMPACT OF IT INVESTMENTS IN THE OPERATING INCOME OF
BRAZILIAN BANKS
IMPACTO DOS INVESTIMENTOS EM TI NO RESULTADO OPERACIONAL DOS BANCOS BRASILEIROS
IMPACTO DE LAS INVERSIONES EN TI EN EL RESULTADO OPERACIONAL DE LOS BANCOS BRASILEÑOS
IT has transformed the banking industry in recent ye-ars, becoming strategic and vital for business. Given this context, the main objective of this study was to analyze the impact of IT investments in the operating income of Brazilian banks. The econometric model was based on a Cobb-Douglas production function with three variables, namely, the operating income, IT investments and personnel expenses. Data were collected from COSIF system, operated by the
Brazi-lian Central Bank, and the study covered the period from 1997 to 2008. After specifying the model, four analyses on the impact of IT investments were con-ducted: cross section analysis, longitudinal analysis (panel data), comparative analysis of IT investments by both domestic and foreign banks, and the analysis of behavior of these investments within the context of the millennium bug (Y2K) and the implementation of the Brazilian Payment System (SPB).
ABSTRACT
RESUMO A TI transformou a indústria dos bancos nos últimos anos e tornou-se estratégica e vital para o negócio. Considerando essa premissa, o objetivo principal do trabalho foi analisar o impacto dos investimentos em TI no resultado operacional dos bancos que operam no Brasil. O modelo utilizado baseou-se em uma função de produção Cobb-Douglas com três variáveis, o resultado operacional, os investimentos em TI e os gastos com pessoal. Os dados são provenientes dos saldos contábeis extraídos do sistema Cosif do Banco Central, e a pesquisa abrangeu o período de 1997 a 2008. Após a especiicação dos modelos econométricos, foram realizadas quatro análises sobre o impacto dos investimentos em TI: análise cross section (cortes transversais anuais), análise longitudinal (dados em painel), análise comparativa dos investimentos em TI pelos bancos nacionais e estrangeiros, e análise do comportamento desses investimentos nos marcos do bug do milênio (Y2K) e da implantação do Sistema de Pagamentos Brasileiro (SPB).
Palavras-chave Investimento em TI, resultado operacional, Cobb-Douglas, cross section, painel de dados.
Resumen La TI ha transformado la industria de los bancos en los últimos años y tornóse estratégica y vital para el negocio. Considerando esa premisa, el objetivo principal del trabajo fue analizar el impacto de las inversiones en TI en el resultado operacional de los bancos que operan en el Brasil. El modelo utilizado se basa en una función de producción Cobb-Douglas con tres variables, el resultado operacional, las inversiones en TI y los gastos con personal. Los datos son provenientes de los saldos contábiles extraídos del sistema Cosif del Banco Central del Brasil, y la investigación cubrió el período de 1997 a 2008. Después de la especiicación de los modelos econométricos, fueron realizados cuatro análisis sobre el impacto de las inversiones en TI: análisis cross section (cortes transversales anuales), análisis longitudinal (datos en panel), análisis comparativa de las inversiones en TI por los bancos nacionales y estranjeros, y análisis del comportamiento de esas inversiones en los marcos del bug del milenio (Y2K) y de la implantación del Sistema de Pagamentos Palabras clave Inversión en TI, resultado operacional, Cobb-Douglas, cross section, panel de datos.
Fernando de Abreu Faria fernando.afaria@hotmail.com
Doctorate Student at the Business Administration Graduate Program, Federal University of Rio Grande do Sul - Porto Alegre - RS, Brazil
Antonio Carlos Gastaud Maçada acgmacada@ea.ufrgs.br
Professor at the Business Administration School and Business Administration Graduate Program, Federal University of Rio Grande do Sul - Porto Alegre - RS, Brazil
INTRODUCTION
The analysis of impacts of Information Technology (IT) investments has been the subject of studies and discussions among professionals and researchers, par-ticularly because of the difficulties to measure their results (GUNASEKARAN et al, 2005; HEIM and PENG, 2010). Studies have been conducted in order to mea-sure whether IT investments contributed to improve organization performance, results or even efficiency. Although findings have not been unanimous regarding the effect of IT investments, organizations continue to invest large sums of money in IT in order to improve their performance.
Banking is one of the industries with highest investments in IT worldwide, which is not surpris-ing, considering that banks need to continuously improve their efficiency in order to remain competi-tive (JONAS and KING, 2008). In Brazil, the banking market is the largest consumer of IT products and services. According to the Brazilian Federation of Banks (Febraban, 2009), in 2008, the total IT budget of banks was over R$ 16 billion reais, with 6.4 billion reais of investments.
In recent years, technology has been the factor that has changed the financial services of banks, allowing the creation of new customer relation channels. The increasing sophistication, flexibility and complexity of banking products and services make IT a key factor to manage risks related with the business.
The studies by Mahmood and Szewczak (1999) and Maçada (2001) found the necessity to develop new studies to assess both economic and strategic impacts of IT investment on organization productivity and per-formance. Several papers were later published in Brazil in order to meet this demand; the studies by Becker, Lunardi and Maçada (2003, 2005), Santos, Andrade and Macedo (2005), Sanchez and Albertin (2009) and Gartner, Rodder and Zwicker (2009) are among such studies. The techniques used to assess the impact of IT investments are classified as parametric and nonpara-metric (Berger and Humphrey, 1997). One example of a parametric technique is the Cobb-Douglas produc-tion funcproduc-tion; data envelopment analysis (DEA) is a nonparametric technique.
The objective of this paper is to analyze the impact of IT investments in the operating income of Brazil-ian banks. In order to test the relationship between the variables involved, econometric quantitative in-struments had to be used, since they allow to build
models and to mathematically represent the real world (PINDYKC and RUBINFELD, 2004). Econometrics was applied because it allows, among other possibilities, to confront economic theory with facts and to test hypotheses involving economic behavior (RAMANA-THAN, 1992).
LITERATURE REVIEW
This review section approaches IT investments in the banking business, the employment of Cobb-Douglas function to measure the impact of such IT investments, the studies on IT investment that have been conducted in Brazil and the research model used.
IT investments in banks
Technology is increasingly present in banking activi-ties, and it is making a difference in issues that are sensitive to banks, such as mobile banking, branch automation, security and compliance. In recent years, innovative technologies have become an increasingly important element in banking industry’s competitive scenario, as they have allowed the development of multiple access channels and have made new banking services viable to customers. In order to maintain and create competitive edge, banks are continuously trying to expand their capabilities (LUO et al., 2010).
In the banking sector, investing in (and moderniz-ing) IT has been essential to business survival. Accord-ing to Ho and Mallick (2010), IT can improve banks performance by reducing operating costs. In this re-spect, the Internet has allowed banks to provide bank-ing services at much lower costs and with no physical presence required in branches (HERNANDEZ-MURILLO et al., 2010).
This paper provides evidence that the IT invest-ments made by banks operating in Brazil are significant, and that IS literature has used the Cobb-Douglas func-tion as a means to assess the impacts of these invest-ments on organizations.
The Cobb-Douglas function
It is a production function relating final product variation to the variation in the application of a par-ticular production factor, or the variation of all factors simultaneously. According to Mittal and Nault (2009), a production function is a mathematical relation between the quantities of inputs and outputs. This relationship is tested using regression analysis, which statistically mea-sures the relationship between independent variables (production factors) and the dependent variable (final product). Prasad and Harker (1997) found production functions to be both valid and successful in a number of empirical studies. The properties of a production function are described in detail in the study by Chambers (1988).
One of the simplest, most widely used produc-tion funcproduc-tions is Cobb-Douglas. It has interesting properties for a quantitative study, e.g., the ability to become linear, which allows using multiple regres-sion. In addition, the Cobb-Douglas function can be adapted in order to relate various inputs to the re-sult or product. Therefore, many studies have used multiple regression models to measure the impact of different, IT investment-related variables for the productivity of companies (GURBAXANI, MELVILLE
and KRAEMER, 1998; KO and OSEI-BRYSON, 2006; KO, CLARK and KO, 2008). These studies normally used productivity or added value as the dependent variable, and IT capital, non-IT capital and labor as independent variables.
Studies on IT investments in Brazil
A literature review was conducted involving Brazilian journals (RAC, RAE, RAUSP, REAd) and congresses (Enad, EnANPAD and CATI) in the last five years, in order to find the studies conducted and methods used to analyze the relationship between IT investments and organization productivity, product, efficiency and performance. The result of this review is summarized in Exhibit 1.
Table 1 shows that researchers used different methods to measure the relationship between IT and organization productivity or products. Among those methods are: data envelopment analysis (DEA) (MAÇADA, BECKER and LUNARDI, 2005; SANTOS, MACEDO and ANDRADE, 2005; SANTOS et al., 2007); case study (CORREIA NETO, 2007; SANCHEZ
Author Year Information/
Period Data / Period Variables Result
Gartner, Zwicker e Rodder
2009 Cobb- Douglas
100 Most Connected Companies according to INFO Magazine, from 2000 to 2006
Number of IT employees; IT investments;
Number of microcomputers; Number of servers
Productivity paradox was refuted, since a signiicant, positive relation was found between increase in IT invest-ment and increased production
Sanchez e Albertin
2009 Case Study study
MATIF
Mar 2005 to Apr 2006
Potential Value; Perceived Value; Realized Value
Effectiveness achieved using IT is actually related to managers ability to identify previous economic ineficiencies in the dynamics of business and to mitigate them
by using IT
Mendonça, Freitas e Souza
2009 Cobb- Douglas
Industrial Research (PIA), Annual Social Information Report (RAIS), Industrial Technology Innovation Research (PINTEC) 26,776 production units with at least 30 workers; 2001 to 2003
Personnel Employed; Capital stock;
Information Technology; Foreign capital; Export;
Average study time, Employee retention rate Absorptive capacity
At least in average, IT is now a critical success factor in the industry
Exhibit 1 - Summary of studies in Brazil on the relationship between IT investments and the result.
Santos, Silva e Chamon
2008 Cobb- Douglas
Data from VPP industry disaggregated from PIA-Empresa full questionnaire; 1996 to 2005
IT capital; Work in IT and non-IT
IT investments were found not to positively impact
productivity in the industrial sector in the area of Vale do Paraíba, São Paulo. Investment in non-IT Work
enhances productivity
Santos, Macedo, Benac e Amorim
2007 DEA Ranking by Info-Exame Magazine; Balanço Financeiro Magazine, from Gazeta Mercantil; 10 companies in 2003
IT investments; Revenue; Return on equity (ROE);
Operation eficiency (EOP)
Results indicate the validity of DEA use
to assess comparative eficiency In converting investments in Brazilian banks
Correia Neto
2007 Method Monte Carlo
Single case of Brazilian company
Incremental cash lows Monte Carlo method allows to simultaneously
estimate inancial beneits expected and risks.
It applies primarily to analysis of quantitative returns Brito e Ferreira 2006 Variance components Technique; Multiple Regression
200 largest IT Companies in Brazil by InfoExame magazine; 2000 to 2004
Size; Productivity
No signiicant impact of the ‘size’ variable over performance was found. A positive, statistically signiicant relation
between variable ‘productivity’ and performance
was found for all of its forms of measure.
Maçada, Becker e Lunardi
2005 DEA 41 Brazilian banks; 1995 to 1999
IT investments; Personnel Expenses; Other administrative expenses; Costs of internationalization; Net revenue from inancial intermediation, services and international operations
Banks with highest IT investment enhanced eficiency over the period
Santos, Macedo, e Andrade
2005 DEA Data from banks and
insurance companies in Brazil collected from Info-Exame Magazine; 2003 and 2004
IT investments; Revenue;
Number of microcomputers; Number of servers Number of professionals; Internet connection
DEA has the ability to distinguish eficient from ineficient companies regarding IT investments
Menezes e Moura 2004 Cobb-Douglas Prasad and Harker test A state-owned multi-bank; 1995 to 2002
Product; IT capital; Non-IT capital IT Work; non-IT Work;
No evidence was found to support that that additional investments in IT have contributed to improve productivity in the company studied
and ALBERTIN, 2009); Monte Carlo method - MCM (CORREIA NETO, 2007); multiple regression (BRITO and FERREIRA, 2006); and Cobb-Douglas (MENEZES and MOURA, 2004; SANTOS, SILVA and CHAMON,
2008), MENDONÇA, FREITAS and SOUZA, 2009), GARTNER, ZWICKER and RODDER, 2009).
A few studies measured the relationship between IT and productivity in banks; among these, only the
Menezes and Moura (2004) study used the Cobb-Douglas function to conduct the analysis. In summary, according to Brazilian studies, the methods to measure the impact of IT investments and company results or productivity were the following: DEA, case study, Monte Carlo, multiple regression and Cobb-Douglas.
Study model
The variables used in this work are: operating inco-me, IT investments and personnel expenses. Figure 1 details the model used in the study in order to relate IT investments to operation income for the organi-zations. The actual conversion of inputs into income was measured using multiple regression, based on a Cobb-Douglas function.
Since this paper studies the banking industry, it is known that banks play a financial intermediation role between those who have capital and the borrowers, which makes the businesses of banks largely depen-dent on information. While estimating a Cobb-Douglas function for the sector, the relationship between the inputs and results of banks must be considered. This function must necessarily include factors related to capital and labor. Today, banks are fully dependent on IT resources. Therefore, IT investments (capital), as well as the people (labor) who make the organiza-tion work, were defined as the main inputs in order to compose an econometric model that aims to assess the impact on operating income. The Cobb-Douglas production function is:
(1)
Where: OI (OBS.: substituir ROP por OI em todas as fórmulas)= Operating Income; IIT (ITI)= IT
invest-ments; PE (OBS.: substituir GP por PE em todas as fórmulas)= Personnel Expenses.
This study took income (OI) into consideration because it directly reflects the operating incomes of institutions; it is the direct result of the difference between operating revenues and expenses. The op-erating revenues are the fees that banks charge for their credit and service operations, i.e., those refer-ring to typical, routine activities. Operating expenses are the result of costs related to their typical, routine activities.
METHOD
Study design
Figure 2 shows the study design, including its diffe-rent steps. On step 1, a literature review was con-ducted in order to get deeper knowledge about how the impact of IT investments on organization results are assessed. Moreover, it was necessary to turn to the production theory and econometrics for the ele-ments that should specify the Cobb-Douglas model used. Step 2 comprehends the collection, analysis and preparation of data. On this step, STATA software was chosen for the analysis. The dashed line, which involves the first and second steps, shows that they occurred in parallel. On step 3, the econometric mo-del specified was pre-tested with data for 2007 and 2008. Once the model was validated and the data prepared, the study proceeded to step 4, on which 4 different types of analysis were conducted regarding IT investments in banks.
The cross-section analysis was conducted using multiple regression and ordinary least square (OLS).
The longitudinal analysis was completed by de-signing a panel of non-balanced data; multiple
re-Figure 1 – Detailed model of regression variables
Personnel Expenses (PE)
Investment IT (ITI)
Operating income Other
Variables
Conversion effectiveness
gression and generalized least squares (GLS) were used in the analysis. The comparison between Bra-zilian and foreign banks was conducted using a dif-ferent econometric model, with dummy (or binary) variables, and it used regression combined with the GLS method. The Y2K and SPB events were analyzed using of a direct analysis of figures in a time series for IT investments.
Data sources and unit of analysis
The data used in this study were collected from CO-SIF, a database system of the Brazilian Central Bank (2009a). COSIF keeps the records of every ledger of every Brazilian financial institution since July 1994. The study by Faria (2010) details the specifications for the COSIF accounts that form each of variable in our model; they are designated as operating in-come (OI), IT investment (ITI) and personnel ex-penses (EP).
The unit of analysis is the Bank, and the popula-tion in this study is formed by banking conglomerates and joined institutions, totaling 42 financial institu-tions registered with the Brazilian Central Bank as independent and normally operating in the period from 1997 to 2008. Within this group are: commer-cial banks, development banks, investment banks, multi-banks, savings banks and state-owned Banco do Brazil and Caixa Economica Federal.
Table 1 shows the samples used in the cross section and longitudinal analyses as well as Y2K and SPB events. N refers to the number of banks selected for the year, and n refers to the number of banks that were actually included in the calculation of regressions. This difference is due to the fact that banks with a negative OI or zeroed values for ITI or PE were not considered in the calculations due to the use of logarithms.
A group of 8 banks from a ranking provided by the Brazilian Central Bank and designated in this study as
Figure 2 – Study Design
Literature review
Deining theoretical model
Specifying the econometric
model
Collecting data from BACEN datawarehouse
Cross section
Analysis of results
Final Report
Y2K and SPB Analyzing
and preparing data
Longitudinal (data in table)
Analyzing and choosing the econometric
software
Brazilian X foreign
Data model validation STEP 1 – Deining the model
STEP 3
STEP 2 – Data and Software
STEP 4 – The Analyses
“Group 8” was designed in order to assess IT invest-ments more accurately. The group is formed by eight of the ten largest banks in the country. The consolidated figures for “Group 8” are compared with the consoli-dated figures for the whole sample, year by year, provid-ing an accurate view of changes in IT investments over the period. In addition, IT investments were studied individually for four banks from “Group 8”, which allows to accurately assess variations in the period.
The banks forming the sample of this study repre-sent almost all institutions - both in terms of quantity and trading volume – that were operating in the country from 1997 to 2008.
Estimating the econometric models for the
analyses
This study proposes four analyses, namely, cross section analysis, longitudinal analysis (panel data), comparative analysis of IT investments made by domestic and foreign banks, and the analysis of IT investments for the Y2K and SPB events. The cross section analyses were conducted from expression (1); after a logarithmic transformation to make it li-near, it resulted in:
(2)
Where: β0 is the intercept;
1 and β2 are the partial elasticities for ITI and PE,
res-pectively; “e” = error term;
OI, ITI and PE represent the natural logarithms of their respective values.
The longitudinal analysis used a panel of unbal-anced data. Random effects was used as the estimation method, since no correlation was found between the unobserved effect and the explanatory variables in the period from 1997 to 2008. Therefore, the
econo-metric model is:
(3)
Where: vit = ai + eit ↔ composition error = unobser-ved effects + idiosyncratic errors;
i = 1, 2, ..., N (N = total of institutions); t = 1, 2, ..., T (T = total of years).
A variation of the model above was used in order to compare Brazilian and foreign banks, withdraw-ing personnel expenses (EP) and includwithdraw-ing both intercept and slope dummy (or binary) variables. Therefore, it was possible to distinguish the impact of IT investments on operating income for Brazil-ian and foreign banks. The expression (4) details the new model.
(4)
Where: D_NE = dummy variable indicating the con-trol (1= foreign, 0 = Brazilian)
β0 = Brazilian bank intercept ; β0 + β1 = foreign bank intercept;
β2 = straight slope ITI regression for Brazilian bank β2 + β3 = straight slope ITI regression for foreign bank
In order to analyze IT investments for the millen-nium bug (Y2K) and Payment System (SPB), the time series of IT investments was directly studied.
RESULTS
In this study, four analyses were proposed, all of whi-ch considered data for the period from 1997 to 2008. The four analyses are: annual cross section analysis; longitudinal analysis; comparative analysis between domestic and foreign banks; and the analysis of IT investments for Y2K and SPB.
Year 2008 2007 2006 2005 2004 2003 2002 2001 2000 1999 1998 1997
N 128 128 131 144 144 146 157 170 183 184 190 205
n 98 110 111 114 113 115 121 128 141 144 133 143
Cross section analysis
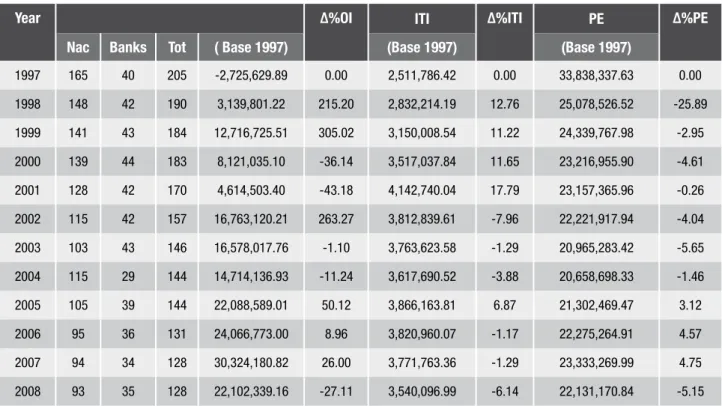
Before presenting the results of regressions, the data collected from COSIF and which form the basis of our calculations are listed below. Table 2 shows a summary with the values of consolidated balances in real terms (base year 1997) for both Brazilian- and foreign-con-trolled banks operating in Brazil during the period. IGP-M index, from the Getulio Vargas Foundation’s, was used to convert OI and ITI values. With regard to EP, the salary adjustment index specific for Brazilian bank employees was used.
The consolidated operating income (OI) of banks was found to vary significantly over the period, al-ternating growth and retraction results, as well as changing levels in 1998, 1999, 2002, 2005 and 2007. Banks were found to have improved their operating performance, which may have been caused by reduced spending, revenue growth or, more likely, both. The consolidated operating incomes of banks in real terms were found to significantly vary their levels from 1997 to 2008, from a R$2.726 billion negative result in 1997 to R$22.102 billion in 2008.
IT investments (ITI) were found to continuously increase from 1998 to 2001; these increases were caused by the events Y2K and SPB, as found in this study. In subsequent years, the changes were all nega-tive, except for 2005 which saw a positive variation of 6.87 percent. However, it is clear that ITI for 2001 reached another plateau regarding the consolidated amount invested yearly by banks, as it increased by 17.79 percent in real terms from 2000 to 2001, reach-ing unprecedented R$ 4.142 billion reais. Considerreach-ing the series analyzed, ITI annual consolidated values increased from R$ 2.512 billion reais in 1997 to R$ 3.540 billion reais in 2008, meaning a real growth of 41 percent.
By analyzing the consolidated personnel expenses (EP), we found that personnel expenses continued to decrease after 1998 and followed a downward trend until 2004.
We found a small PE increase for the period from 2005 to 2007, which was reversed in 2008. Addition-ally, negative effects from the global financial crisis which erupted in the second half of 2008 were found; those effects are reflected in the figures for the three
Year ∆%OI
ITI ∆%ITI
PE ∆%PE
Nac Banks Tot ( Base 1997) (Base 1997) (Base 1997)
1997 165 40 205 -2,725,629.89 0.00 2,511,786.42 0.00 33,838,337.63 0.00
1998 148 42 190 3,139,801.22 215.20 2,832,214.19 12.76 25,078,526.52 -25.89
1999 141 43 184 12,716,725.51 305.02 3,150,008.54 11.22 24,339,767.98 -2.95
2000 139 44 183 8,121,035.10 -36.14 3,517,037.84 11.65 23,216,955.90 -4.61
2001 128 42 170 4,614,503.40 -43.18 4,142,740.04 17.79 23,157,365.96 -0.26
2002 115 42 157 16,763,120.21 263.27 3,812,839.61 -7.96 22,221,917.94 -4.04
2003 103 43 146 16,578,017.76 -1.10 3,763,623.58 -1.29 20,965,283.42 -5.65
2004 115 29 144 14,714,136.93 -11.24 3,617,690.52 -3.88 20,658,698.33 -1.46
2005 105 39 144 22,088,589.01 50.12 3,866,163.81 6.87 21,302,469.47 3.12
2006 95 36 131 24,066,773.00 8.96 3,820,960.07 -1.17 22,275,264.91 4.57
2007 94 34 128 30,324,180.82 26.00 3,771,763.36 -1.29 23,333,269.99 4.75
2008 93 35 128 22,102,339.16 -27.11 3,540,096.99 -6.14 22,131,170.84 -5.15
variables for that year: -27.11 percent for OI, -6.14 percent for ITI and -5.15percent for PE.
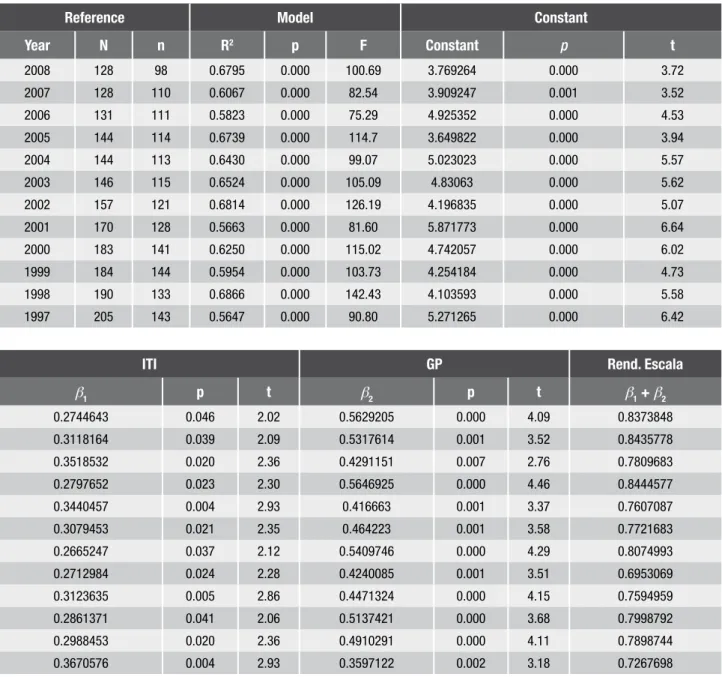
Table 3 summarizes the results found in all cross section analyses conducted for the period from 1997 to 2008, using equation (2) in STATA. Because natural logarithms were used, banks with negative OI values were not considered in the regressions. In the twelve years studied, the calculated coefficients of determina-tion R2 were significant (p 0.05 <) and ranged from 0.5647 to 0.6866. According to Kennedy (2008), a high R2 value does not necessarily mean that the model is strong. According to Gujarati (2006), the researcher should worry about the relevance logic of explanatory variables in relation to the dependent variable and its statistical significance.
The results found were analyzed in economic and statistic terms. According to the statistical signifi-cance of the two explanatory variables, determined by their t-statistics, the results showed that they were statistically significant for all years analyzed, as they had values above 2 for all years. Besides its relevance to test the hypothesis, the fact that t-statistic presents values above 2 is relevant to deal with the question of multicolinearity in Cobb-Douglas functions. Accord-ing to Kennedy (2008, p. 196), the existence of mul-ticolinearity in a Cobb-Douglas production function is natural, and although capital and labor variables have a high collinearity, solid estimations are pro-duced. According to the economic significance sug-gested by the coefficients of regression (or betas) and their signs, evidence was found that variations in IT investments (ITI) or in personnel expenses (EP) have a significant, positive impact on the operating income (OI) of banks. The coefficient for IT investments (β1)
varied from 0.2665 the 0.3671, and the coefficient for personnel expenses (β2) varied from 0.3597 to 0.5647.
Betas β1 and β2 represent the partial elasticities of the
dependent variable (OI) in relation to the independent variables (ITI and PE).
With regard to scale incomes, the addition of the coefficients varied from 0,7268 to 0,8445, and they were found to have decreased for all years during the studied period (β1 + β2 < 1). Importantly enough,
the presence of decreasing incomes does not imply that it is bad to invest in IT or personnel expenses. It only implies that incomes are decreasing, i.e., the investment in the first unit provides a given revenue, the second one provides a slightly lower revenue and so on. In economic terms, the company would have to invest until marginal return is zeroed.
Therefore, the cross section analyzes found statistic evidence that for all years in the period from 1997 to 2008, IT investments, as well as personnel expenses, had a positive impact on the operating income of banks. It is noteworthy that banks invest in IT not only for financial return; they seek other factors that imply strategic edges, like service quality improvement, or the use of new technologies that will allow them to create more sophisticated products (BECCALLI, 2007, p. 4). The figures suggest that investing in IT became critical for the survival of businesses, as banks continue to invest large amounts in IT in the country.
Longitudinal analysis
The longitudinal analysis with unbalanced panel was conducted in order to observe the impact of IT invest-ments on the operating income of banks. Choosing an unbalanced panel increased the number of obser-vations, which is relevant in a study using a panel data. Banks with a negative OI were not considered in the regression. This analysis was conducted using expression (3) in STATA.
According to Asteriou and Hall (2007), the Hausman test helps to choose between the fixed and random ef-fect approaches, testing if values for ai(non-observable error) are correlated to the regressors (independent vari-ables) of the model. Its result (Prob > chi2 = 0,3066; p > 0,05) suggested that the random effect model should be used. The Breusch-Pagan test, which is, according to Wooldridge (2006), a heterocedasticity test (the vari-ance of the term of error is not constant) where OLS (Ordinary Least Squares) square residuals are regressed over the explanatory variables of the model, resulted in (Prob > chi2 = 0,0000; p < 0,05), which suggested that the errors were heterocedastic; therefore, the robust regression was used.
Regression in panel was used for 1,471 measures regarding the 12 years of the analyzed period. The coefficient (or beta, which indicates partial elasticity) calculated for ITI was 0.3059 and the PE coefficient was 0.4962. R2 was 0.6339, which is significant and suggests that the model explains 63.39 percent of the variation in operation income (OI). The coefficient calculated for IT investment showed that if these investments in-crease by 1 percent, the operating income will inin-crease by 0.3059 percent.
The intercept in the multiple linear regression straight line (β0) was 4.2166. This number is
to simulate the impacts of both IT and personnel expenses investments on the operating income of banks.
The inclination coefficients for IT and personnel expenses investments were 0.3059 (β1) and 0.4962
(β2), respectively. The sum of elasticities, which was 0.8021 (below 1), suggested decreasing scale incomes.
The regression was calculated using the method of generalized least squares (random effects). The result-ing estimator is:
(5)
The same equation in the form of a Cobb-Douglas function is:
Reference Model Constant
Year N n R2 p F Constant p t
2008 128 98 0.6795 0.000 100.69 3.769264 0.000 3.72
2007 128 110 0.6067 0.000 82.54 3.909247 0.001 3.52
2006 131 111 0.5823 0.000 75.29 4.925352 0.000 4.53
2005 144 114 0.6739 0.000 114.7 3.649822 0.000 3.94
2004 144 113 0.6430 0.000 99.07 5.023023 0.000 5.57
2003 146 115 0.6524 0.000 105.09 4.83063 0.000 5.62
2002 157 121 0.6814 0.000 126.19 4.196835 0.000 5.07
2001 170 128 0.5663 0.000 81.60 5.871773 0.000 6.64
2000 183 141 0.6250 0.000 115.02 4.742057 0.000 6.02
1999 184 144 0.5954 0.000 103.73 4.254184 0.000 4.73
1998 190 133 0.6866 0.000 142.43 4.103593 0.000 5.58
1997 205 143 0.5647 0.000 90.80 5.271265 0.000 6.42
ITI GP Rend. Escala
β1 p t β2 p t β1 + β2
0.2744643 0.046 2.02 0.5629205 0.000 4.09 0.8373848
0.3118164 0.039 2.09 0.5317614 0.001 3.52 0.8435778
0.3518532 0.020 2.36 0.4291151 0.007 2.76 0.7809683
0.2797652 0.023 2.30 0.5646925 0.000 4.46 0.8444577
0.3440457 0.004 2.93 0.416663 0.001 3.37 0.7607087
0.3079453 0.021 2.35 0.464223 0.001 3.58 0.7721683
0.2665247 0.037 2.12 0.5409746 0.000 4.29 0.8074993
0.2712984 0.024 2.28 0.4240085 0.001 3.51 0.6953069
0.3123635 0.005 2.86 0.4471324 0.000 4.15 0.7594959
0.2861371 0.041 2.06 0.5137421 0.000 3.68 0.7998792
0.2988453 0.020 2.36 0.4910291 0.000 4.11 0.7898744
0.3670576 0.004 2.93 0.3597122 0.002 3.18 0.7267698
(6)
The intercept 67.80 is the value of the Neperian anti-logarithm of β0, and the exponents for the
ex-planatory variables ITI and PE are the elasticity co-efficients-products estimated, and they measure their relative impact on OI. The equation (6) represents an estimator of the impacts caused on OI because of inverted values in ITI and GP; this estimator is generated by the regression using the data from the unbalanced panel.
Assessment of IT investments in banks
The longitudinal analysis was complemented by di-rectly examining the IT investments in banks using the same data from the unbalanced panel, which allo-wed a few interesting comparisons regarding the re-alized figures in the country. In order to conduct this analysis, an online report on the 50 largest banks in the country (Brazilian Central Bank website) with the position for September 2008 was created and used. In order to preserve bank identity, the study discretio-narily selected 8 of the 10 largest banks in the report; we designated these 8 banks “Group 8.” All banks in “Group 8” are in the unbalanced panel.
Table 4 shows the consolidated figures in abso-lute terms for the IT investments (ITI) made by the institutions that form “group 8” – and participate in the unbalanced panel (UP). These figures allowed studying how the concentration of IT investments progressed in Brazil. The total invested in IT by “group 8” in 2008 accounted for 82.44 percent of to-tal consolidated IT investment of all 222 institutions that formed the unbalanced panel, which means that the other 214 institutions in the panel invested only 17.56 percent of the overall total.
From 1997 to 2008, the number of institutions in the sample decreased by approximately 38%, sharply decreasing from 205 to 128. This fact shows that a significantly smaller number of institutions is investing a significantly larger amount in IT in 2008, since the consolidated values for ITI in abso-lute terms increased from R$ 2.512 billion reais to R$ 9.995 billion reais. This may suggest that banks are individually investing more in IT in real terms in 2008 than they were in 1997. In order to clarify this point, four banks were selected from the 6 larg-est banks in the country (among the participants in “group 8”); this was made in order to analyze
indi-vidual behavior regarding IT investments. Table 5 shows the consolidated ITI data for these four banks, identified as Banks A, B, C and D. All values were transformed for base year 1997, using IGP-M index from the Getúlio Vargas Foundation (FGV) in order to compare them in real terms.
A variation of 118,75 percent in real terms was found for Bank A from 1997 to 2008.
It is noteworthy that the last was found to have invested more constantly in IT in the analyzed period.
Therefore, Brazilian large banks were found to have reached another plateau in IT investments in 2008 compared to the values employed in 1997. Fig-ure 3 shows the evolution of IT investments for the four banks listed in Table 5.
Bank D was clearly found to have invested most in IT, and to have had the most constant IT invest-ment trajectory. Bank A was also found to have a significant growth trajectory. Bank B had an expres-sive growth in ITI investments until 2002, then had a significantly decreasing trajectory in its annual sums.
Bank C was found to have grown significantly until 2001; then, a gradual decrease was found until
Year ITI ITI %Particip.
Group 8 PNB Group 8
no PNB
1997 1,368,202,432.93 2,511,786,422.00 54.47
1998 1,768,485,644.85 2,882,627,602.00 61.35
1999 2,455,480,608.15 3,850,500,506.00 63.77
2000 3,276,100,284.00 4,726,914,296.00 69.31
2001 4,394,292,816.08 6,145,247,972.00 71.51
2002 5,130,654,732.53 7,086,818,959.00 72.40
2003 5,796,459,257.28 7,603,237,753.00 76.24
2004 6,494,837,669.78 8,216,131,513.00 79.05
2005 6,861,918,584.66 8,885,804,115.00 77.22
2006 7,069,902,932.70 9,119,135,353.00 77.53
2007 7,252,678,403.73 9,698,455,376.00 74.78
2005; a sharp, remarkable recovery in IT investments was found for 2008.
Comparison between Brazilian and foreign
banks
A comparison between IT investments made by Brazilian institutions (those with Brazilian control)
and foreign ones (those with foreign control) was also conducted. The same data from the above mentioned unbalanced panel were used to conduct this analysis. IT investments (ITI) are separated in Brazilian and foreign in Table 6. ITI values were transformed for base year 1997 using IGP-M index from FGV.
Year Banco A ∆%A Banco B ∆%B Banco C ∆%C Banco D ∆%D
1997 287,673.11 0.00 106,748.60 0.00 223,155.32 0.00 463,240.74 0.00
1998 339,313.90 17.95 188,840.47 76.90 252,838.86 13.30 589,689.72 27.30
1999 390,272.69 15.02 380,807.10 101.66 278,313.26 10.08 558,873.54 -5.23
2000 462,373.94 18.47 393,477.78 3.33 352,961.50 26.82 576,229.14 3.11
2001 470,199.15 1.69 513,215.40 30.43 408,572.02 15.76 545,266.55 -5.37
2002 415,333.01 -11.67 525,475.46 2.39 371,968.22 -8.96 565,489.36 3.71
2003 441,896.98 6.40 493,255.29 -6.13 301,911.16 -18.83 556,806.48 -1.54
2004 504,191.39 14.10 427,991.29 -13.23 249,948.03 -17.21 565,252.68 1.52
2005 634,014.64 25.75 428,116.28 0.03 219,369.70 -12.23 604,354.33 6.92
2006 617,569.80 -2.59 271,860.19 -36.50 325,048.72 48.17 687,183.09 13.71
2007 576,042.33 -6.72 211,303.60 -22.27 260,494.81 -19.86 731,594.39 6.46
2008 629,283.73 9.24 238,140.11 12.70 523,044.11 100.79 686,912.85 -6.11
TOTAL 5,768,164.65 4,179,231.56 3.767.625.70 7.130.892.88
Tabela 5 – ITI de 4 grandes bancos, em R$ mil (ano-base 1997)
800,000.00
1997 1998 1999 2000 2001 2002 2003 2004 2005 2006 2007 2008 600,000.00
400,000.00
200,000.00 700,000.00
500,000.00
300,000.00
100,000.00
0.00
A B C D
An increased participation of foreign financial institutions in the total of financial institutions (FIs) was found from 1997 to 2008, from 19.51 percent in 1997 to 27.34 percent in 2008. It is noteworthy that the number of Brazilian institutions was found to have significantly decreased during the period, from 165 to 93, which contrasts with a small reduc-tion in the number of foreign institureduc-tions, from 40 to 35. These numbers are evidence that the ongoing process of banking concentration in the Brazilian system had more impact on Brazilian institutions than foreign ones during the analyzed period. Still, Brazilian institutions have always had a predominant role in IT investments, ranging from a 67.35 percent minimum participation in 2003 to a 78.91 percent maximum participation in 2000.
Brazilian banks were found to have significantly increased their total annual investment from R$ 1.876 billion reais in 1997 to R$ 2.519 billion reais in 2008, which represents an increase of roughly 34 percent in the period. Foreign banks increased their annual amount of investments from R$ 636 million reais to R$ 1.021 billion reais, which was a 61 percent increase. According to this figures, a 44 percent smaller group of Brazilian institutions invested a 34 percent higher amount in real terms in 2008 compared to 1997. On
the other side, a 13 percent smaller group of foreign banks invested a 61 percent higher amount in real terms in 2008 compared to 1997. Foreign participa-tion in the total invested was found to increase in real terms from 25.3 percent in 1997 to 28.8 percent in 2008.
Brazilian and foreign institutions were also com-pared using dummy variables, as demonstrated in equation (4). Due to the use of natural logarithms, banks with a negative OI were not considered in the regression.
According to the econometric model proposed, it can be deduced that:
à for foreign insti-tutions
and
à for Brazilian institutions. After replacing the coefficients by their respective values calculated in the regression, we have:
(foreign) and (Brazilian)
Year IF´s ITI (Base 1997)
Nac % Est % Total Nac % ∆% Est % ∆% Total ∆%
1997 165 80.49 40 19.51 205 1,875,923.92 74.68 0.00 635,862.50 25.32 0.00 2,511,786.42 0.00
1998 148 77.89 42 22.11 190 2,166,829.43 76.51 15.51 665,384.76 23.49 4.64 2,832,214.19 12.76
1999 141 76.63 43 23.37 184 2,424,075.17 76.95 11.87 725,933.36 23.05 9.10 3,150,008.54 11.22
2000 139 75.96 44 24.04 183 2,775,341.30 78.91 14.49 741,696.54 21.09 2.17 3,517,037.84 11.65
2001 128 75.29 42 24.71 170 2,988,028.35 72.13 7.66 1,154,711.70 27.87 55.69 4,142,740.04 17.79
2002 115 73.25 42 26.75 157 2,685,312.21 70.43 -10.13 1,127,527.41 29.57 -2.35 3,812,839.61 -7.96
2003 103 70.55 43 29.45 146 2,534,751.53 67.35 -5.61 1,228,872.05 32.65 8.99 3,763,623.58 -1.29
2004 115 79.86 29 20.14 144 2,460,609.81 68.02 -2.93 1,157,080.70 31.98 -5.84 3,617,690.52 -3.88
2005 105 72.92 39 27.08 144 2,680,906.07 69.34 8.95 1,185,257.74 30.66 2.44 3,866,163.81 6.87
2006 95 72.52 36 27.48 131 2,725,402.94 71.33 1.66 1,095,557.13 28.67 -7.57 3,820,960.07 -1.17
2007 94 73.44 34 26.56 128 2,964,572.84 78.60 8.78 807,190.52 21.40 -26.32 3,771,763.36 -1.29
This result suggested that foreign banks started from a higher intercept, but because they have a lower inclination, they are less efficient in transforming IT investments in their operating income. Figure 4 shows the two lines generated.
Analysis of IT investments for Y2K and SPB
This study also assessed what occurred to IT investments (ITI) in both the millennium bug and SBP implementation. Table 6 relates the consolidated values in absolute terms for ITI and the values in real terms for ITI (base year 1997). The periods when banks conducted their IT projects related to both Y2K and SPB are represented on the right of the table. Figure 4 was generated using data from table 6, and it shows the evolution curves for both time series for IT investment consolidated values. The consolidated values in real terms that banks invested in IT were found to have been kept on an annual level that started to be produced from 2000 to 2001.The Y2K event
The millennium bug (Y2K) was an event that occur-red in the turn of 1999 to 2000; it mobilized all sec-tions in banks, especially those related to IT. Many systems had been built with no concern for treating the datum ‘year’ with four digits or in a date for-mat, which imposed a complete review of
compu-ter program codes and the redesigning of files and databases.
From 1998 to 2000, Brazilian banks invested large sums in projects related to Y2K. From 1998 to 1999, their projects were being followed by the Brazilian Central Bank, and in 2000 they completed many proj-ects related to Y2K. There is no connection between Y2K projects and the implementation of SPB, since banks only started their projects related to payment system in 2001.
The figures suggest a movement in Brazil similar to what Anderson and others (2006) found in the United States. Many IT managers from banks turned Y2K into an “opportunity” for other investments, in order to modernize the technology in their computing resources. This explains the real variations in the con-solidated amounts invested in IT, which were 12.76 percent in 1999 and 11.65 percent in 2000. IT annual investments increased sharply from R$ 2.512 billion reais in 1997 to R$ 3,517 billion reais in 2000, which means a real increase of 40 percent. Such an increase was not only caused by software adjustments.
The SPB event
The implementation of the Brazilian Payment Sys-tem (SBP) took place on April 22, 2002. The project, conducted by the Brazilian Central Bank (Bacen) (2009b) was the result of a partnership between Bacen and Bank Associations and Clearing Houses, and it was developed between July 2000 and April 2002. In the SPB event, investments involved high sums of money in hardware, software and services. The investments in hardware involved new data communication equipment, new contracts with data transmission operators and new computers capable of supporting the new technologies incorporated by the system. Investments in softwareinvolved re-building or buying many vital internalsystems such as bank account, treasure and back office support. According to Lowenthal (2005), the impact on tech-nology was considered greater than that caused by the millennium bug, and its implementation requi-red no less monumental an effort. Obviously, SPB required high IT investments from banks - much more than Y2K did.
Table 7 shows that, for 2001, the variation index for consolidated IT investments (base year 1997) was 17.79 percent in real terms. This is the highest figure in the analyzed series, and it reveals that IT
Figure 4 – Regression lines for Brazilian x foreign
Brazilian
Foreign
investments were significant in that year. The volume of consolidated IT investments increased sharply from a R$3.517 billion-real level to R$ 4.143 billion reais by the end of 2001. In 2000, investments were still very much related to Y2K projects, but in 2001, investments were driven by the beginning of SPB. Many financial institutions completed investments
related to SPB in 2002. This occurred because the large majority of banks only became involved in SPB projects from 2001.
FINAL REMARKS
This study aimed to generally analyze the impact of IT investments on the operating income of Brazilian bank
In order to accomplish this goal, we proposed a model based on a Cobb Douglas production function, which used IT invest-ments (ITI) and personnel expenses (PE) as capital and labor inputs, respectively. The data used in this study are from the Cosif System of the Brazilian Central Bank, and they cover the period from 1997 to 2008. Four major analyses were performed: cross section and longitudinal analyses, a com-parative analysis between investments by Brazilian and foreign banks, and finally, the analysis of Y2K and SPB events.
In the cross section analyses, the results of all regressions provided evidence of rel-evant coefficients of determination (R2) and significant coefficients (beta) for the 2 ex-planatory variables, indicating the impact of IT investments and personnel expenses on
12,000,000.00
10,000,000.00
8,000,000.00
6,000,000.00
4,000,000.00
2,000,000.00
0.00 1997
ITI ITI (base 1997)
2005 2001
1999 2003 2007
1998 2000 2002 2004 2006 2008
Figure 5 – ITI Evolution
Ano IFs ITI ∆%ITI ITI
(Base 1997) ∆%ITI
1997 2,511,786.42 0.00 2,511,786.42 0.00
1998 190 2,882,627.60 14.76 2,832,214.19 12.76
1999 184 3,850,500.51 33.58 3,150,008.54 11.22
2000 183 4,726,914.30 22.76 3,517,037.84 11.65
2001 170 6,145,247.97 30.01 4,142,740.04 17.79
2002 157 7,086,818.96 15.32 3,812,839.61 -7.96
2003 146 7,603,237.75 7.29 3,763,623.58 -1.29
2004 144 8,216,131.51 8.06 3,617,690.52 -3.88
2005 144 8,885,804.12 8.15 3,866,163.81 6.87
2006 131 9,119,135.35 2.63 3,820,960.07 -1.17
2007 128 9,698,455.38 6.35 3,771,763.36 -1.29
2008 128 9,994,835.15 3.06 3,540,096.99 -6.14 Table 7 – consolidated ITI, R$ thousand
the operating income of banks. In the longitudinal analysis using the unbalanced panel, the coefficient of determination (R2) for the regression was signifi-cant; the coefficient for the ITI was also significant. The panel result also suggested real, positive impact of IT investments on the operating result of banks during the analyzed period. Still regarding the lon-gitudinal analysis, and using the same data from the unbalanced panel, a specific assessment about IT investment amounts in banks was conducted. This assessment found a process of concentration of these investments in large Brazilian banks in the period from 1997 to 2008.
With regard to the comparison between total IT investments by Brazilian and foreign banks, two dif-ferent yet complementary ways were used to conduct it. In the first one, foreign participation was found to have increased its total investments slightly, and although the number of Brazilian institutions was found to have decreased significantly in the analyzed period, their total IT investment amounts were found to have been significantly high. In the second way of comparing Brazilian and foreign banks with re-gard to IT investments, an econometric model with dummy variables was used. The regression with dummies suggested that Brazilian institutions were more efficient than foreign ones in “transforming” IT investments to benefit their operating incomes in the analyzed period. This finding allowed to infer that Brazilian banks had a better knowledge of the market they operated in, and were therefore able to direct their IT investments in a better way.
The last analysis in this study assessed the be-havior of IT investments by banks at two particularly relevant times for the financial system, namely the millennium bug (Y2K) and the implementations of the Brazilian Payment System (SPB). Figures were found to provide unmistakable evidence that banks increased their amounts invested in IT in real terms in the years immediately preceding both events. The most significant of them in terms of financial amounts invested was SPB. This was not surprising, consider-ing that in order to participate in the new payment system banks had to invest heavily both in hardware and software and services. New processes were cre-ated and new technologies implemented.
In the case of Y2K, IT investments were also considerable. The figures for the period from 1998 to 2000 suggested that Y2K led banks to take advantage of the event as an “opportunity” to modernize their IT
and computing resources. This event allowed a few banks to conduct projects involving much more than simply buying or adapting software for year 2000. This occurred not only in Brazil, and it was also the subject of studies abroad.
The model of this study, with only 3 variables, could be said to limit it; however, although its model is quite simple, the independent variables selected (ITI and PE) are currently the most relevant ones in defining the operating income of a bank. It is note-worthy that no mathematic artifice was used that could allow including into regressions the institutions excluded for having a negative OI; the institutions used in the calculations were found to represent the majority and they comprehended the largest ones.
Future research could provide a sequence to this study, considering the refinement of the econo-metrical model and finding other explanatory variables (including macroeconomic ones), or even proposing a new, dependent variable that can be related to IT investments.
ACKNOWLEDGEMENTS
The authors would like to thank the Coordination for the Improvement of Higher Level Personnel (CAPES) and the National Council for Scientific and Technological Develo-pment (CNPq) for their financial support to the research that originated this paper.
REFERENCES
ANDERSON, M.C; BANKER, R.D; RAVINDRAN, S. Value Implications of Investments in Information Technology.
Management Science, v. 52, n. 9, p. 1359-1376, 2006.
ASTERIOU, D; HALL, S. G. Applied Econometrics. A Modern
Approach. New York: Palgrave Macmillan, 2007.
BANCO CENTRAL DO BRASIL (2009a). Informações
Ca-dastrais e Contábeis/Cosif. Disponível em: http://www.bcb. gov.br. Acesso em: 28 set. 2009.
BANCO CENTRAL DO BRASIL (2009b). Sistema de
BECCALLI, E. Does IT investment improve bank performan-ce? Evidence from Europe. Journal of Banking e Finance, v. 31, n. 7, p. 2205-2230, 2007.
BECKER, J. L; LUNARDI, G. L; MAÇADA, A. C. G. Análise de eficiência dos bancos brasileiros: um enfoque nos in-vestimentos realizados em Tecnologia de Informação (TI).
Produção (São Paulo), v. 13, p. 70-81, 2003.
BERGER, A. N; HUMPHREY, D. B. Efficiency of financial institutions: international survey and directions for future research. European Journal of Operational Research, v. 98, n. 2, p. 175-212, 1997.
BRITO, L. A. L; FERREIRA, F. C. M. A Variabilidade do De-sempenho das Empresas da Nova Economia e os Efeitos da Produtividade e Economias de Escala e Escopo. In: EN-CONTRO NACIONAL DA ASSOCIAÇÃO NACIONAL DOS PROGRAMAS DE PÓS-GRADUAÇÃO EM ADMINISTRAÇÃO, 30, 2006, Salvador. Anais. Salvador: ANPAD, 2006.
BRYNJOLFSSON, E; HITT, L. Paradox lost? Firm-level evi-dence on the returns to information systems spending.
Management Science, v. 42 n.4, p. 541-558, 1996.
CHAMBERS, R. G. Applied Production Analysis. New York:
Cambridge University Press, 1988.
CORREIA NETO, J. F. Avaliação de investimento em um sistema de informação através do método de Monte Car-lo. In: Encontro de Administração da Informação, 1, 2007, Florianópolis. Anais. Florianópolis: ANPAD, 2007.
FARIA, F. A. Análise do impacto dos investimentos em TI
no resultado operacional dos bancos brasileiros. 2010.
148f. Dissertação de Mestrado em Administração, Escola de Administração da Universidade Federal do Rio Grande do Sul, Porto Alegre, 2010.
FEBRABAN – Federação Brasileira de Bancos. O setor
ban-cário em números. São Paulo. 2009. Disponível em: http:// www.febraban.com.br. Acesso em: 5 nov. 2009.
GARTNER, I. R; ZWICKER, R; RODDER, W. Investimentos em tecnologia da informação e impactos na produtividade empresarial: uma análise empírica à luz do paradoxo da produtividade. RAC, v. 13, n. 3, p. 391-409, 2009.
GUJARATI, D. N. Econometria básica. 3. ed. São Paulo:
Pearson, 2006.
GUNASEKARAN, A; NGAI, E. W. T; MCGAUGHEY, R. E. Information technology and systems justification: a review for research and applications. European Journal of Opera-tional Research, v. 173, n. 3, p. 957-983, 2006.
GURBAXANI, V; MELVILLE, N; KRAEMER, K. L. Disaggrega-ting the return on investment to IT capital. Center for
Rese-arch on Information Technology and Organizations, 1998.
HEIM, G. R; PENG, D. X. The impact of information tech-nology use on plant structure, practices, and performance:
an exploratory study. Journal of Operations Management,
v. 28, n. 2, p. 144-162, 2010.
HERNÁNDEZ-MURILLO, R; LLOBET, G; FUENTES, R. Stra-tegic online banking adoption. Journal of Banking & Fi-nance, v. 34, n. 7, p. 1650-1663, 2010.
HO, S. J; MALLICK, S. K. The impact of information technology on the banking industry. Journal of the Operational Research Society, v. 61, n. 2, p. 211-221, 2010.
JONAS, M. R.; KING, S. K. Bank Efficiency and the Effecti-veness of Monetary Policy. Contemporary Economic Policy, v. 26, n. 4, p. 579-589, 2008.
KENNEDY, P. A Guide to Econometrics. Malden: Blackwell
Publishing, 2008.
KO, M; OSEI-BRYSON, K. Analyzing the impact of infor-mation technology investments using regression and data mining techniques. Journal of Enterprise Information Ma-nagement, v. 19, n. 4, p. 403-441, 2006.
KO, M; CLARK, J. G; KO, D. Revisiting the impact of infor-mation technology investments on Productivity: an empi-rical investigation Using Multivariate adaptive regression
splines (Mars). Information Resources Management
Jour-nal, v. 21, n. 3, p. 1-23, 2008.
LICHTENBERG, F. R. The output contributions of compu-ter equipment and personnel: a firm-level analysis.
Eco-nomics of Innovation and New Technology, v. 3, n. 4, p.
201-217, 1995.
LOWENTHAL, R. Brasil: showcase de competência em e--business. São Paulo: Makron Books do Brasil, 2005.
LUO, X; LI, H; ZHANG, J; SHIM, J. P. Examining multi--dimensional trust and multi-faceted risk in initial accep-tance of emerging technologies: an empirical study of mobile banking services. Decision Support Systems, v. 49, p. 222-234, 2010.
McKEEN J. D; HEATHER, A. S; PARENT, M. An integrative research approach to assess the business value of Infor-mation Technology. In: MAHMOOD, M. A; SZEWCZAK,
E. J. Measuring Information Technology Investment
Payo-ff: Contemporary Approaches. Hershey: Idea Group
Pu-blishing, 1999.
MAÇADA, A. C. G. Impacto dos investimentos em Tecnologia da Informação nas variáveis estratégicas e na eficiência dos bancos brasileiros. 2001. 211f. Tese de Doutorado em Administração, Escola de Administração da Universidade Federal do Rio Grande do Sul, Porto Alegre, 2001.
MAÇADA, A. C. G; BECKER, J. L; LUNARDI, G. L. Efetivi-dade de conversão dos investimentos em TI na eficiência dos bancos brasileiros. Revista de Administração Contem-porânea, v. 9, n. 1, p. 9-33, 2005.
MAHMOOD, M; SZEWCZAK, E. Measuring Information
Technology Investment Payoff: Contemporary Approaches.
Hershey: Idea Group Publishing, 1999.
MENDONÇA, M. A. A; FREITAS, F. A; SOUZA, J. M. Tecno-logia da informação e produtividade na indústria brasileira.
RAE, v. 49, n.1, 2009.
MENEZES, R. B; MOURA, H. J. Revisitando o paradoxo da produtividade de Tecnologia da Informação (TI): estudo
de caso de um banco brasileiro. Resumo dos trabalhos.
EnAnpad, 2004.
MITTAL N; NAULT B. R. Investments in Information Tech-nology: indirect effects and information technology inten-sity. Information Systems Reseach, v. 20, n. 1, p. 140-154, Mar. 2009.
PINDYCK, R. S; RUBINFELD, D. L. Econometria Modelos e
Previsões. 4. ed. São Paulo: Elsevier, 2004.
PRASAD, B; HARKER, P. T. Examining the contribution of information technology toward productivity and
profi-tability in US retail banking. University of Pennsylvania,
Financial Institutions Center Working Papers, 97-09, Phi-ladelphia, 1997.
RAMANATHAN, R. Introductory Econometrics with
appli-cations. 2nd ed. New York: Harcourt Brace Javanovich
Publishers, 1992.
SANCHEZ, O. P; ALBERTIN, A. L. A racionalidade limitada das decisões de investimento em tecnologia da informação.
RAE, v. 49 . n. 1, 2009.
SANTOS, R; MACEDO, M. A; ANDRADE. C. R. Eficiência dos investimentos em TI no setor financeiro. In: CON-GRESSO ANUAL DA TECNOLOGIA DA INFORMAÇÃO (CATI), 2, 2005.
SANTOS, R; MACEDO, M. A. S; BENAC, M. A; AMORIM, D. X. B. Desempenho organizacional e eficiência da con-versão dos investimentos em Tecnologia da Informação no setor bancário brasileiro. In: Encontro de Administração da Informação, 1, 2007, Florianópolis. Anais. Florianópo-lis: ANPAD, 2007.
SANTOS, F. F, SILVA, M. R; CHAMON, M. A. O paradoxo da produtividade no setor industrial do vale do Paraíba paulista. Resumo dos trabalhos. EnAnpad, 2008.
STOLARICK, K. M. Are some firms better at IT? Differing relationships between productivity and IT spending. Dis-cussion Papers. Bureau of the Census - Center for Econo-mic Studies, Washington, Oct. 1999.
WOOLDRIDGE, J. M. Introdução à econometria: uma