1
Universidade Federal de Santa Catarina, Centro de Ciências da Saúde, Departamento de Nutrição. Campus Universitário, Trindade, 88040-9000, Florianópolis, SC, Brasil. Correspondência para/Correspondence to: FAG VASCONCELOS. E-mail: <[email protected]>.
2
Faculdade de Medicina do ABC, Departamento de Saúde da Coletividade, Laboratório de Epidemiologia e Análise de Dados. Santo André, SP, Brasil.
3
Universidade Federal de Santa Catarina, Centro de Desportos, Departamento de Educação Física. Florianópolis, SC, Brasil.
Article based on the master’s thesis of MGM PINHO, intitled “Associação entre atividade sedentária, consumo, alimentar e sobrepeso/ obesidade em escolares de 11 a 14 anos de idade em Florianópolis, SC”. Universidade Federal da Santa Catarina; 2015.
Support: Conselho Nacional de Desenvolvimento Científico e Tecnológico(Process nº 483955/2011-6).
Association between screen time and
dietary patterns and overweight/obesity
among adolescents
Associação entre tempo de tela e padrões
alimentares com sobrepeso/obesidade
em adolescentes
Maria Gabriela Matias de PINHO1
Fernando ADAMI2
Jucemar BENEDET3
Francisco de Assis Guedes de VASCONCELOS1
A B S T R A C T
Objective
The association between screen time and dietary patterns and overweight/obesity among adolescents was analysed in this study.
Methods
In this cross-sectional study, 963 Brazilian adolescents, aged between 11 and 14 years were evaluated. Body mass index was used to assess overweight/obesity. Dietary patterns and screen time were assessed using qualitative questionnaires. Principal component analysis was used to obtain dietary patterns. Confounder variables were: type of school (public or private), sexual maturation, mother’s weight and mother’s education. The Chi-square test was used for the crude analysis; for the adjusted analysis was used Poisson regression with sample weighting.
Results
bread and chocolate milk pattern (only in girls), were inversely associated with overweight/obesity. In this study, dietary patterns influenced overweight/obesity, although in some cases, in an inverse way from what expected. Conclusion
A high prevalence of overweight/obesity and a high proportion of screen time activities among the adolescents were observed. Our results indicate a high consumption of unhealthy dietary pattern among adolescents. Keywords: Adolescents. Food behavior. Obesity. Overweight.
R E S U M O
Objetivo
Analisar a associação entre tempo de tela e padrões alimentares com sobrepeso/obesidade em adolescentes de Florianópolis, Santa Catarina, Brasil.
Métodos
Estudo transversal com amostra probabilística de 963 adolescentes de 11 a 14 anos de idade matriculados em escolas públicas e privadas do município. O sobrepeso/obesidade foi avaliado por meio do índice de massa corporal e o consumo alimentar do dia anterior por meio da aplicação de questionário qualitativo. Análise de Componentes Principais foi utilizada para obtenção dos padrões alimentares. Os fatores de confusão considerados foram: tipo de escola, maturação sexual, peso e escolaridade da mãe. Usou-se teste Qui-quadrado e regressão de Poisson nas análises bruta e ajustada, respectivamente.
Resultados
A prevalência de sobrepeso/obesidade foi de 29,8%, sendo estatisticamente maior nos meninos (34,7%). A prevalência de alto tempo de tela foi de 39,1%. Os padrões alimentares obtidos foram: obesogênico; café e produtos lácteos; refeição tradicional brasileira; frutas e vegetais; pão e achocolatado. O padrão de consumo alimentar que melhor representou o consumo dos adolescentes nessa amostra foi o obesogênico. Não houve associação estatisticamente significativa entre tempo de tela e sobrepeso/obesidade. Foram inversamente associados com sobrepeso/obesidade os padrões: obesogênico; café e produtos lácteos; e pão e achocolatado (apenas em meninas). Padrões de consumo alimentar influenciaram a prevalência de sobrepeso/obesidade, porém, em alguns casos, de maneira contrária ao esperado.
Conclusão
Observou-se alta prevalência de sobrepeso/obesidade e alta frequência de atividades sedentárias. Os resultados sugerem alto índice de padrão alimentar não saudável pelos adolescentes.
Palavras-chave: Adolescentes. Comportamento alimentar. Obesidade. Sobrepeso.
I N T R O D U C T I O N
Despite the reported stabilization in some developed countries, the prevalence of overweight/ obesity among children and adolescents remains high, therefore, representing an important public health issue [1]. However, this stabilization does not appear to be occurring in developing countries. The overweight/obesity prevalence has increased from 8.1% to 12.9% in boys and from 8.4% to 13.4% in girls between 1980 and 2013 in 188 countries [2]. In Brazil, according to data from the Household Budget Survey (HBS), conducted between 2008 and 2009, the
prevalence of overweight/obesity among 10 to 19 year-olds was 20.5% [3]. Moreover, the estimated prevalence of overweight/obesity in 2013 was 22.1% for boys and 24.3% for girls [2].
unhealthy dietary practices and sedentary
activities (e.g., excessive computer, television
and videogame use) [5,6]. In Brazil, the Pesquisa
Nacional de Saúde de Escolar, 2012 showed a
high consumption of non-healthy foods, with 41.3%, 33.2% and 31.9% of the adolescents
eating sweets (i.e., candies, chocolate, ice
cream), soft drinks and cookies, respectively, on five or more days per week. In the same survey, 78.0% of Brazilian adolescents watched two or more hours of television per weekday [7].
There is a growing body of literature demonstrating that unhealthy food consumption and sedentary behaviour during childhood and adolescence can promote overweight/obesity in adulthood [8,9]. Hence, the analysis of food consumption and sedentary activities among adolescents becomes essential in epidemiologic studies examining overweight/obesity. It has been suggested that the identification of patterns in the study of diets is a good methodological strategy, allowing for the evaluation of diets as a whole, rather than analysis of a specific nutrient. As people eat complete meals, not specific nutrients, analysis of dietary patterns enables a greater understanding of the diet of a population and facilitates public health decision-making [10,11].
The association between overweight/ obesity and unhealthy food consumption or sedentary activities is not fully understood [12,13]. In view of the lack of conclusive evidence on this association and the shortage of studies in Brazil examining this issue, the association between
sedentary activities (i.e., screen time) or dietary
patterns and overweight/obesity in adolescents from Florianópolis, a city in the South of Brazil, was analysed.
M E T H O D S
The survey took place in Florianópolis
(SC), a coastal city located in the South of Brazil.
Florianópolis is a city with a Very High Human
Development Index (HDI); in 2013, its HDI was 0.847, higher than national HDI, which was 0.744.
This study is part of a wider research
project funded by the Conselho Nacional de
Desenvolvimento Científico e Tecnológico analysing the tendency and prevalence of obesity and associated factors among school children (7
to 14 year olds) in Florianópolis. More detailed
information about the project is described elsewhere [14]. In this study, a cross-sectional analysis with a probabilistic school-based sample of 11-14-year-old adolescents from public and
private schools in Florianópolis was performed.
The whole sample could not be included in this analysis because one of our exposure measures (screen time) was only evaluated among the 11 to 14 year old population.
The sample was obtained from 26,075 students at 85 schools in 2010. For sample size calculation among this population, five percentage points, a 95% confidence interval, and an estimated outcome prevalence of 38% were considered. To account for potential sample losses, 10% was added to the final calculation. Clustered sampling was performed with schools as the primary sampling unit. In each school, a systematic sampling of classes was performed. All students from a chosen class were invited to join the survey. Written informed consent of the parents was necessary for students to be enrolled in the survey.
classified according to two categories: non-overweight/obesity (Z-score of BMI-for-age <+1 standard deviation; overweight/obesity: Z-score of BMI-for-age > to +1 standard deviation.
Dietary data were obtained using the
third version of the Questionamento Alimentar
do Dia Anterior (Quada-3, Previous Day Food
Questionnaire). Quada is a questionnaire that
evaluates children’s food consumption on previous
day, in a qualitative way. This questionnaire was applied to the entire population sample of 7 to 14 year olds because Quada is an illustrative tool enabling children to be situated in time and space by mentioning the previous day and showing each meal chronologically, with illustrations. This strategy facilitates data collection among schoolchildren. Although Quada was validated among children between 6 and 11 years of age, it was postulated that the older children in this sample (aged 12, 13 and 14 years) would have sufficient cognitive ability to answer the questionnaire and provide reliable data. Quada includes 21 foods over 6 meals (breakfast, morning snack, lunch, afternoon snack, dinner, and supper) [16]. The students received the questionnaires at school and were asked to indicate the foods they had eaten during each meal on the previous day.
From the questionnaire, 126 dichotomous dietary variables (six variables per meal for each food) were obtained; these were further summed out in order to obtain a score of consumption for each food. As a result, 21 dietary variables representing a score for food consumption were obtained, the score ranged from 0 to 6, with 0 representing no consumption of the food during the previous day and 6 representing consumption of the food in 6 meals on the previous day. The dietary patterns were obtained using Principal Component Analysis (PCA) with orthogonal rotation (varimax) on these 21 discrete variables. PCA is a multivariate analysis that aims to reduce a data set containing many interrelated variables, by identifying the key components, or patterns. Besides the reduction
in the number of variables, a further advantage of using this analysis is that it can be applied
to any type of data or distribution (i.e., no
assumption of normality is required) [17]. In PCA, the components are obtained so that the first ones include most of the variance of the original variables and the subsequent components can be rejected. On the basis of the screen plot – by looking at the moment the graph begins to show a plateau – and by observing the Kaiser criterion (eigenvalue >1.0) [17], five components were chosen to be kept, and then these components were split into tertiles. To be part of a pattern, the food item should have an eigenvector >0.30 in that pattern.
Sedentary activities were evaluated by asking the following questions; “How many hours a day do you spend watching television on a weekday, and on the weekend?”; “How many hours a day do you spend using the computer on a weekday, and on the weekend?”; “How many hours a day do you spend playing videogame on a weekday, and on the weekend?”.
categorize the variable at the median point, resulting in a dichotomous variable of screen
time. Thus, the exposure variable ‘screen time
score’ represents the individuals who performed
less than three screen activities for more than 2 hours per day and individuals who performed three or more screen activities for more than 2 hours per day.
Information such as pubertal status and sociodemographic characteristics were collected in order to verify potential roles as confounding variables. Measures for the evaluation of the sexual maturation stage were collected according to the Tanner staging system [19]. The pubertal stages variable took into account the five stages of genital development in boys and breast development in girls, resulting in the following classification: pre-pubertal (first maturation stage), pre-pubertal (second, third and fourth maturation stages), and post-pubertal (fifth maturation stage) [20]. Information regarding student name, date of birth, grade, and type of school attended were obtained from school records. Socio-demographic data were collected from a questionnaire sent to parents, who reported their age, weight, height, years-of-study and household income.
Data were processed using Epi Data (Epi Info Centers for Disease Control and Prevention, Atlanta, Georgia, United States) 3.2. in a double data entry procedure, statistical analyses were
performed using Stata® (Statistical Software
for Professionals, College Station, Texas, United Station) 11.0. The SVY command was used to consider weighted sample. Prevalence and 95% confidence intervals were calculated using the Chi-square test. Effect measures were calculated using backward Poisson regression. Analyses were stratified by sex, taking in account the differences between boys and girls during the adolescence period (including sexual dimorphism, different skeletal growth and body composition) [19].
The research protocol was approved
by the Ethics Committee of the Universidade
Federal de Santa Catarina, in accordance with
the standards established by Resolution nº 466/2012 of the Brazilian National Health Council.
R E S U L T S
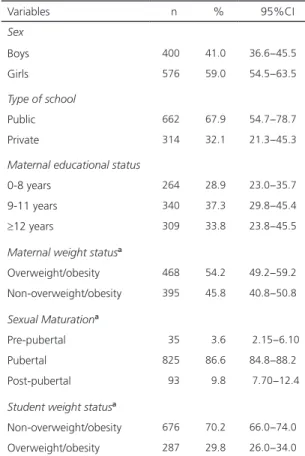
Table 1 presents participant characteristics. Outcome information was available for 963 adolescents, of which 59.0% were girls, most attended public schools (67.9%) and were in the pubertal stage of sexual maturation. In the majority (37.3%) of cases, the mothers of these adolescents had a history of 9 to 11 years of studying and 45.8% of the mothers were overweight/obese. The prevalence of overweight/ obesity among the adolescents was 29.8% (95.0% Confidence Interval-95%CI=26.0–34.0); this was higher among boys (34.7%; 95%CI=29.6–40.2;
Table 1. Characteristics of the surveyed adolescents from
Florianópolis (SC), Brazil (2012-2013).
Variables n % 95%CI
Sex
Boys 400 41.0 36.6−45.5
Girls 576 59.0 54.5−63.5
Type of school
Public 662 67.9 54.7−78.7
Private 314 32.1 21.3−45.3
Maternal educational status
0-8 years 264 28.9 23.0−35.7
9-11 years 340 37.3 29.8−45.4 ≥12 years 309 33.8 23.8−45.5
Maternal weight statusa
Overweight/obesity 468 54.2 49.2−59.2
Non-overweight/obesity 395 45.8 40.8−50.8
Sexual Maturationa
Pre-pubertal 35 3.6 2.15−6.10
Pubertal 825 86.6 84.8−88.2
Post-pubertal 93 9.8 7.70−12.4
Student weight statusa
Non-overweight/obesity 676 70.2 66.0−74.0
Overweight/obesity 287 29.8 26.0−34.0
p=0.008). The proportion of all adolescents who performed three or more screen activities for 2 hours or more per day was 39.1% (Figure 1). Specifically, this was 44.6% among boys and 35.5% among girls and this difference was
statistically significant (p=0.010).
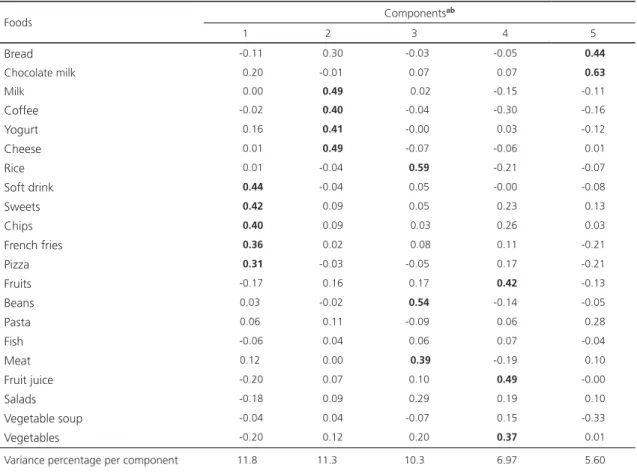
Table 2 shows the five components kept from Principal Component Analysis. Foods with an eigenvector >0.30 were considered part of the correspondent pattern; these values are shown in bold in Table 2. The components, referred to as dietary patterns, were indicated as follows:
Figure 1. Proportion of adolescents who attended three or more screen activities for more than 2 hours per day (n=901). Florianópolis (SC), Brazil (2012-2013).
Note: Chi-square test p=0,010.
95%CI: 95% Confidence Interval.
Foods Components
ab
1 2 3 4 5
Bread -0.11 0.30 -0.03 -0.05 0.44
Chocolate milk 0.20 -0.01 0.07 0.07 0.63
Milk 0.00 0.49 0.02 -0.15 -0.11
Coffee -0.02 0.40 -0.04 -0.30 -0.16
Yogurt 0.16 0.41 -0.00 0.03 -0.12
Cheese 0.01 0.49 -0.07 -0.06 0.01
Rice 0.01 -0.04 0.59 -0.21 -0.07
Soft drink 0.44 -0.04 0.05 -0.00 -0.08
Sweets 0.42 0.09 0.05 0.23 0.13
Chips 0.40 0.09 0.03 0.26 0.03
French fries 0.36 0.02 0.08 0.11 -0.21
Pizza 0.31 -0.03 -0.05 0.17 -0.21
Fruits -0.17 0.16 0.17 0.42 -0.13
Beans 0.03 -0.02 0.54 -0.14 -0.05
Pasta 0.06 0.11 -0.09 0.06 0.28
Fish -0.06 0.04 0.06 0.07 -0.04
Meat 0.12 0.00 0.39 -0.19 0.10
Fruit juice -0.20 0.07 0.10 0.49 -0.00
Salads -0.18 0.09 0.29 0.19 0.10
Vegetable soup -0.04 0.04 -0.07 0.15 -0.33
Vegetables -0.20 0.12 0.20 0.37 0.01
Variance percentage per component 11.8 11.3 10.3 6.97 5.60 Table 2. Coefficient’s scores from Principal Components Analysis on dietary patterns among adolescents from Florianópolis (SC), Brazil
(2012-2013) (N=975).
Note: aGreater values indicate higher percentage of variance of data from each food in the component. 1: Obesogenic; 2: Coffee and dairy
products; 3: Traditional Brazilian meal; 4: Fruits and vegetables; 5: Bread and chocolate milk. Values in bold indicate that the corresponding food
is part of that pattern (eigenvector >0.30).
54.7
44.6
35.5
44.6
35.5
27.4
47.7
39.1
31.1 60.0
50.0
40.0
30.0
20.0
Boys Girls Total
Distribution by sex and total
Pr
l Component 1 (soft drink, sweets, chips, French fries, pizza): obesogenic dietary pattern.
lComponent 2 (milk, coffee, yogurt,
cheese): coffee and dairy products dietary pattern.
l Component 3 (rice, beans and meat):
traditional Brazilian meal dietary pattern.
l Component 4 (fruits, fruit juice and
vegetables): fruits and vegetables dietary pattern.
l Component 5 (bread and chocolate
milk): bread and chocolate milk dietary pattern.
The dietary patterns that represented the most data variability were the obesogenic and
coffee and dairy products (both eigenvalues >2.5). The remaining patterns had eigenvalues <2.0 points (data not shown). The magnitude of each dietary pattern in food consumption is presented in Table 2 as percentages of variance for each dietary pattern in the analysis. For both boys and girls, the dietary patterns were formed by the same foods; however, in boys, the pattern accounting for the greatest variance was the Obesogenic pattern, while in girls, it was the coffee and dairy products pattern (data not shown).
Crude and adjusted analysis for the association
between ‘dietary patterns’ and ‘screen time score’
Variables Overweight/obesity (%)
Crude analysis PR
(95%CI) p
Adjusted analysis PR
(95%CI)b p
Total (n=437) 34.7 - - -
-Screen time scorec 0.746 0.303
<3 activities 33.9 1 1
≥3 activities 35.7 1.05 (0.76−1.47) 1.17 (0.85−1.63)
Dietary patterns: obesogenic 0.014 0.003
1st Tertile 39.6 1 1
2nd Tertile 45.7 1.16 (0.80−1.66) 1.21 (0.88−1.66)
3rd Tertile 2.6 0.55 (0.34−0.88) 0.44 (0.26−0.74)
Coffee and dairy products 0.568 0.476
1st Tertile 35.8 1 1
2nd Tertile 28.7 0.80 (0.53−1.21) 0.76 (0.48−1.20)
3rd Tertile 39.1 1.09 (0.60−2.00) 1.06 (0.67−1.67)
Traditional Brazilian meal 0.834 0.205
1st Tertile 31.8 1 1
2nd Tertile 36.4 1.15 (0,73−1.80) 1.46 (0.89−2.43)
3rd Tertile 35.4 1.11 (0.68−1.83) 1.13 (0.68−1.89)
Fruit and vegetables 0.675 0.748
1st Tertile 34.0 1 1
2nd Tertile 38.7 1.14 (0.69−1.88) 1.24 (0.70−2.21)
3rd Tertile 32.3 0.95 (0.72−1.26) 1.09 (0.73−1.63)
Bread and chocolate milk 0.728 0.603
1st Tertile 32.0 1 1
2nd Tertile 37.2 1.16 (0.79−1.70) 1.09 (0.76−1.56)
3rd Tertile 35.0 1.09 (0.75−1.59) 1.12 (0.73−1.71)
Table 3. Overweight/obesity prevalence, crude and adjusted analysis to its association with screen time score and dietary patterns among boys from Florianópolis (SC), Brazil, 2012-2013 (n=350)a.
Note: aNumber of observations for complete case analysis among boys; bAdjusted for mother’s weight status; cPerformed less than three screen
activities for more than 2 hours per day or performed three or more screen activities for more than 2 hours per day.
and overweight/obesity among boys is shown in Table 3. The confounding variable that remained in the model was the mother’s weight. Screen time score was not associated with overweight/ obesity. The obesogenic pattern was associated with the outcome in boys, both in the crude
and adjusted analysis (p=0.003). In the adjusted
analysis, adolescents in the highest tertile of consumption of the obesogenic pattern (third
tertile) had a Prevalence Ratio (PR) for overweight/
obesity that was 56% lower than among subjects in the lowest tertile of consumption (first tertile) (PR=0.44; 95%CI=0.26–0.74). Among those who moderately consumed this pattern (second
tertile), the prevalence ratio for overweight/obesity
was 21% greater than among subjects in the reference tertile (PR=1.21; 95%CI=0.88–1.66).
Among girls (Table 4), the confounding variables that remained in the model was maternal weight and sexual maturation. As with boys, the screen time score was not associated with overweight/obesity. However, the only dietary pattern that were not associated with overweight/obesity in girls was the traditional Brazilian meal pattern. The obesogenic pattern was associated with overweight/obesity in the
adjusted analysis (p=0.017; the prevalence ratio
Variables Overweight/obesity (%) Crude analysis (95%CI) p Adjusted analysis (95%CI)b p
Total (n=526) 26.4 - - -
-Screen time scorec 0.394 0.320
<3 activities 27.9 1 1
≥3 activities 24.2 0.87 (0.62−1.22) 0.85 (0.62−1.18)
Dietary patterns: obesogenic 0.436 0.017
1st Tertile 24.2 1 1
2nd Tertile 29.4 1.22 (0.70−2.12) 1.23 (0.73−2.08)
3rd Tertile 25.4 1.05 (0.49−2.28) 0.79 (0.49−1.28)
Coffee and dairy products 0.016 0.029
1st Tertile 31.1 1 1
2nd Tertile 19.8 0.64 (0.46−0.89) 0.58 (0.37−0.90)
3rd Tertile 27.0 0.87 (0.49−1.53) 1.05 (0.76−1.45)
Traditional Brazilian meal 0.554 0.499
1st Tertile 25.8 1 1
2nd Tertile 29.9 1.16 (0.75−1.80) 1.26 (0.83−1.90)
3rd Tertile 22.5 0.87 (0.53−1.44) 1.00 (0.60−1.70)
Fruit and vegetables 0.025 0.009
1st Tertile 25.6 1 1
2nd Tertile 34.9 1.36 (1.00−1.85) 1.40 (1.04−1.88)
3rd Tertile 19.3 0.76 (0.40−1.42) 0.84 (0.44−1.61)
Bread and chocolate milk 0.038 0.045
1st Tertile 33.9 1 1
2nd Tertile 24.0 0.71 (0.46−1.09) 0.63 (0.46−0.85)
3rd Tertile 20.2 0.60 (0.37−0.96) 0.53 (0.27−1.06)
Note: aNumber of observations for complete case analysis among girls; bAdjusted for mother
’s weight status and sexual maturation; cPerformed
less than three screen activities for more than 2 hours per day or performed three or more screen activities for more than 2 hours per day.
PR: Prevalence Ratio; 95%CI: 95% Confidence Interval.
for overweight/obesity for girls in the highest consumption of obesogenic pattern (third tertile) was 21% lower when compared with those in the reference tertile (PR=0.79; 95%CI=0.49–1.28). Among those who moderately consumed this
pattern (second tertile), the prevalence ratio for
overweight/obesity was 23% greater than in the reference tertile (PR=1.23; 95%CI=0.73–2.08).
Coffee and dairy products pattern was associated with overweight/obesity in both crude
(p=0.016) and adjusted analysis (p=0.029). In the
adjusted analysis, the prevalence ratio among
girls who ate it moderately, was 42% lower than among those in the reference tertile (PR=0.58; 95%CI=0.37–0.90).
The fruit and vegetable pattern was also associated with the outcome in crude
(p=0.025) and adjusted analysis (p=0.009).
In the adjusted analysis, the prevalence ratio for overweight/obesity for girls in the highest tertile of consumption was 16% lower than among girls in the reference tertile (PR=0.84; 95%CI=0.44–1.61). Among those who ate it
moderately, the prevalence ratio for overweight/
obesity was 40% higher than in subjects in the reference tertile (PR=1.40; 95%CI=1.04–1.88).
In the bread and chocolate milk pattern, a significant inverse tendency in the crude (0.038) and adjusted analysis (0.045) with a higher tertile of consumption associated with a lower
overweight/obesity prevalence ratio was observed.
In the adjusted analysis, the overweight/obesity
prevalence ratio for girls in the highest tertile
of consumption was 47% lower compared with those in the reference tertile (PR=0.53; 95%CI=0.27–1.06 considering the bread and chocolate pattern, among subjects who ate
moderately, the prevalence ratio for overweight/
obesity was 37% lower than among those in the reference tertile (PR=0.63; 95%CI=0.46–0.85).
D I S C U S S I O N
The overweight/obesity prevalence found in this study was high and statistically different
for boys and girls, corroborating the results of international [21-23] and Brazilian [24-26] studies.
Our results indicate that 39.1% of adolescents performed three or more screen activities per day for 2 hours or more, exceeding the American Academy of Pediatrics recommendations, advising parents to limit total screen time for children to a maximum of 2 hours per day [18]. Studies from Brazil [25,26] and abroad [27,28] found a high frequency of sedentary activities among adolescents. We found that the frequency of sedentary activities was different for boys and girls (higher in boys), corroborating the results
Thibault et al. [28], in study involving 2,385
adolescents.
There was no statistically significant association between screen time score and overweight/obesity in this sample. The literature from cross-sectional studies evaluating this association is controversial. A number of international [13,29] and Brazilian [30-32] studies did not find this association. However, there is a growing body of research showing that sedentary activities are a risk factor to overweight/obesity [27,28,33]. It appears that there is not enough evidence to establish a positive association between screen time and BMI or body fat. This may be because research is not being conducted in an ideal manner. In addition, it is possible that children and adolescents are not exposed to sedentary behaviour for sufficient time to observe differences in overweight/obesity, and therefore, long-term, longitudinal studies, are required [12].
decades, traditional Brazilian dietary patterns, consisting of beans, rice, fruits, vegetables and meat, have been replaced by ultra-processed or ready-to-eat foods [34].
Contrary to what was expected, the obesogenic pattern was inversely associated with overweight/obesity. This may be explained by reverse causality, a common limitation in cross-sectional studies. So that, adolescents, realising they were overweight, could be limiting their intake to the foods in this pattern, which are known to be unhealthy and potentially obesogenic. A further reason to believe this finding is due to reverse causality is that an inverse association between unhealthy dietary intake and body fat percentage was found in another study based on the same sample [35]. Alternatively, longitudinal studies may be performed in order to avoid reverse causality. The 1970 British birth cohort is an example of a longitudinal study examining the association between diet and body weight. The study followed 4,461 adolescents to adulthood and found that the exaggerated consumption of soft drinks and take-way-foods resulted in increased BMI at 30-years-old [8].
The moderate consumption of coffee and dairy products pattern was inversely associated with overweight/obesity in girls. In Brazil, the foods that compose this pattern are commonly eaten for breakfast, therefore, this could be indicative of breakfast consumption, this habit, in turn, has been considered a protective factor to overweight/obesity [29,36].
No association between the Traditional Brazilian meal pattern and overweight/obesity was found. A cross-sectional study performed
in the state of Minas Gerais, Brazil, in 2011,
involving 523 adolescents found no association between the traditional pattern (rice, beans, meat, vegetables, eggs and juice) and overweight/ obesity [37]. Rice, beans and meat are part of the dietary habit of the Brazilian population and are considered markers of a healthy diet. According to the Brazilian Household Budget Survey (2008-2009), beans, rice and meat, respectively,
were the foods that had the greatest mean of daily consumption per capita among analysed foods.
The prevalence ratios from the fruit and
vegetables pattern had different directions for those that had high or moderate consumption of this pattern. The cross-sectional literature on the association between fruit and vegetables intake and overweight/obesity is controversial. In the literature, fruit and vegetable consumption has been be positively [38] and negatively associated with overweight/obesity [39]. There is limited longitudinal evidence on the association between consumption of fruit and vegetables and overweight. A school-based study in Norway evaluated the impact of increasing fruit and vegetables intake on body weight. Students who received free fruit over three years had lower odds for overweight/obesity in the crude, but not in the adjusted analysis. The authors concluded that higher fruit intake can prevent future weight gain, although the results indicate that further time may be necessary to notice body weight changes [40].
Regarding the last dietary pattern, it is known that adolescents in Brazil commonly consume chocolate milk, normally alongside bread. Chocolate milk is rich in added sugar,
and as shown in a study performed in São Paulo
city, Brazil, with 793 adolescents, chocolate milk was present in a significant proportion of diets of those who showed higher sugar intake [41]. Therefore, chocolate milk intake should be discouraged, although moderate consumption did not appear to contribute to overweight/ obesity in this study.
Among the study’s limitations is the high
increased by a further 10.0% in order to account for potential losses. For sensitivity analysis, a simulated calculation, considering a loss percentage of 48.0%, approximating the real loss percentage of this study was performed. The sample size required was 952 respondents, which is lower than the actual number of respondents in this study (963).
C O N C L U S I O N
This study tested the association between
‘screen time activities’ and ‘dietary patterns’ and
overweight/obesity among adolescents. Results showed a high prevalence of overweight/obesity and a high proportion of screen time activities among the adolescents. The dietary pattern that accounted for the most variance in the data
was the ‘obesogenic pattern’, indicating that
frequency of consumption of foods from this pattern (soft drink, sweets, chips, French fries, pizza) was high among adolescents. Associations between dietary patterns and overweight/ obesity were found, although in some cases, the direction of the association was contrary to what was expected. There was no association between screen time activities and overweight/ obesity in this study. Further research is required to measure the long-term effects of dietary patterns and screen time on overweight/obesity among adolescents.
C O N T R I B U T O R S
The authors MGM de PINHO and FAG de VASCONCELOS contributed to study conception, design, data analysis and interpretation of findings. The authors J BENEDET and F ADAMI contributed to data analysis and interpretation of findings. All authors contributed to writing and have approved the final version of manuscript. This manuscript is an output from a master thesis.
R E F E R E N C E S
1. Olds T, Maher C, Zumin S, Peneau S, Lioret S, Castetbon K, et al. Evidence that the prevalence
of childhood overweight is plateauing: Data from nine countries. J Pediatr Obes. 2011;6(5-6):342-60. https://doi.org/10.3109/17477166.2011.605895 2. Ng M, Fleming T, Robinson M, Thomson B,
Graetz N, Margono C, et al. Global, regional, and national prevalence of overweight and obesity in children and adults during 1980-2013: A systematic analysis for the Global Burden of Disease Study 2013. Lancet. 2014;384(9945):766-81. https//:doi.org/10.1016/S0140-6736(14)60460-8 3. Instituto Brasileiro de Geografia e Estatística.
Pes-quisa de orçamentos familiares 2008-2009: antropometria e estado nutricional de crianças, adolescentes e adultos do Brasil. Rio de Janeiro: IBGE; 2010.
4. Inge TH, King WC, Jenkins TM, Courcoulas AP, Mitsnefes M, Flum DR, et al. The effect of obesity in adolescence on adult health status. Pediatrics. 2013;132(6):1098-104. https://doi.org/10.1542/ peds.2013-2185
5. Currie C, Zanotti C, Morgan A, Currie D, Looze M, Roberts C, et al. Social determinants of health and well-being among young people. Health Behaviour in School-aged Children (HBSC) study: International report from the 2009/2010 survey. Copenhagen: WHO Regional Office for Europe; 2012.
6. Enes CC, Slater B. Obesidade na adolescência e seus principais fatores determinantes. Rev Bras Epidemiol. 2010;13(1):163-71. https://doi.org/10. 1590/S1415-790X2010000100015
7. Instituto Brasileiro de Geografia e Estatística. Pes-quisa Nacional de Saúde do Escolar – PeNSE 2012. Rio de Janeiro: IBGE; 2013.
8. Viner RM, Cole TJ. Who changes body mass between adolescence and adulthood? Factors predicting change in BMI between 16 year and 30 years in the 1970 British Birth Cohort. Int J Obes, 2006;30(9):1368-74. https//:doi.org/10.1038/sj.ijo. 0803183
9. Mamun AA, O’Callaghan MJ, Williams G, Najman JM. Television watching from adolescence to adulthood and its association with BMI, waist circumference, waist-to-hip ratio and obesity: A longitudinal study. Public Health Nutr. 2013;16(1):54-64. https//:doi.org/10.1017/S1368 980012002832
11. Hu FB. Dietary pattern analysis: A new direction in nutritional epidemiology. Curr Opin Lipidol. 2002;13(1):3-9. https//:doi.org/10.10 97/0004143 3-200202000-00002
12. Chinapaw M, Altenburg T, Brug J. Sedentary behaviour and health in children: Evaluating the evidence. Prev Med. 2015;70:1-2. https//:doi. org/10.1016/j.ypmed.2014.10.029
13. Mihas C, Mariolis A, Manios Y, Naska A, Panagiotakos D, Arapaki A, et al. Overweight/ obesity and factors associated with body mass index during adolescence: The VYRONAS study. Acta Paediatrica. 2009;98(3):495-500. https//:doi. org/10.1111/j.1651-2227.2008.01129.x
14. Motter AF, Vasconcelos FA, Correa EN, Andrade DF. Pontos de venda de alimentos e assiciação com sobrepeso/obesidade em escolares de Flo-rianopolis, Santa Catarina, Brasil. Cad Saúde Pública. 2015;31(3):620-32. https//:doi.org/10.15 90/0102-311X00097814
15. World Health Organization. Growth reference data for 5-19 years. Geneva: WHO; 2007.
16. Assis MAA, Benedet JR, Vasconcelos FAG, Pietro PF, Kupek E. Validação da terceira versão do Questionário Alimentar do Dia Anterior (Quada-3) para escolares de 6 a 11 anos. Cad Saúde Pública. 2009;25(8):1816-26. https://doi.org/10.1590/S01 02-311X2009000800018
17. Jolliffe IT. Principal component analysis. New York: Springer; 2010.
18. American Academy of Pediatrics. Council on Communications and Media. Children, adolescents, and the media. Pediatrics. 2013;132(5):958-61. https://doi.org/10.1542/peds.2013-2656
19. Malina RM, Bouchard C. Growth, maturation, and physical activity. 2nd ed. Illinois: Human Kinetics Books; 2004.
20. Adami F, Vasconcelos FAG. Obesidade e maturação sexual precoce em escolares de Florianópolis-SC. Rev Bras Epidemiol. 2008;11(4):549-60. https//:doi. org/10.1590/S1415-7 90X2008000400004 21. Minghelli B, Nunes C, Oliveira R. Prevalence of
overweight and obesity in portuguese adolescents: Comparison of different anthropometric methods. North Am J Med Sci. 2013;5(11):653-9. https:// doi.org/10.4103/1947-2714.122309
22. Wrotniak BH, Malete L, Maruapula SD, Jackson J, Shaibu S, Ratcliffe S, et al. Association between socioeconomic status indicators and obesity in adolescent students in Botswana, an African country in rapid nutrition transition. Pediatr Obes. 2012;7(2):e9-e13. https//:doi.org/10.1111/ j.2047-6310.2011.00023.x
23. Zaghloul S, Al-Hooti SN, Al-Hamad N, Al-Zenki S, Alomirah H, Alayan I, et al. Evidence for nutrition transition in Kuwait: Over-consumption of macronutrients and obesity. Public Health Nutr. 2013;16(4):596-607. https//:doi.org/10.1017/S13 68980012003941
24. Barros MS, Fonseca VM, Meio MDBB, Chaves CR. Excesso de peso entre adolescentes em zona rural e a alimentação escolar oferecida. Cad Saúde Coletiva. 2013;21(2):201-8. https://doi. org/10.1590/S1414-462X2013000200016 25. Silva Júnior LM, Santos AP, Souza OF, Farias
ES. Prevalência de excesso de peso e fatores associados em adolescentes de escolas privadas de região urbana na Amazônia. Rev Paul Pediatr. 2012;30(2):217-22. https://doi.org/10.1590/S010 3-05822012000200010
26. Vasconcellos MB, Anjos LA, Vasconcellos MTL. Estado nutricional e tempo de tela de escolares da Rede Pública de Ensino Fundamental de Ni-terói, Rio de Janeiro, Brasil. Cad Saúde Pública. 2013;29(4):713-22. https//:doi.org/10.1590/S010 2-311X2013000400009
27. Maher C, Olds TS, Eisenmann JC, Dollman J. Screen time is more strongly associated than physical activity with overweight and obesity in 9- to 16-year-old Australians. Acta Paediatrica. 2012;101(11):1170-4. https://doi.org/10.1111/j.16 51-2227.2012.02804.x
28. Thibault H, Contrand B, Saubusse E, Baine M, Maurice-Tison S. Risk factors for overweight and obesity in French adolescents: Physical activity, sedentary behavior and parental characteristics. Nutrition. 2010;26(2):192-200. https://doi.org/10. 1016/j.nut.2009.03.015
29. Al-Haifi AR, Al-Fayez MA, Al-Athari BI, Al-Ajmi FA, Allafi AR, Al-Hazzaa HM, et al. Relative contribution of physical activity, sedentary behaviors, and dietary habits to the prevalence of obesity among Kuwaiti adolescents. Food Nutri Bull. 2013;34(1). https//:doi.org/10.5539/gjhs.v8 n1p107
30. Nogueira JAD, Costa THM. Gender differences in physical activity, sedentary behavior, and their relation to body composition in active Brazilian adolescents. J Physi Act Health. 2009;6:93-8. https://doi.org/10.1123/jpah.6.1.93
31. Silva KS, Nahas MV, Hoefelmann LP, Lopes AS, Oliveira ES. Associações entre atividade física, índice de massa corporal e comportamentos sedentários em adolescentes. Rev Bras Epidemiol. 2008;11(1):158-68. https://doi.org/10.1590/S141 5-790X2008000100015
potenciais fatores de risco. Rev Paul Pediatr. 2013;31(2):172-81. https://doi.org/10.1590/S010 3-05822013000200007
33. Nasreddine L, Naja F, Akl C, Chamieh MC, Karam S, Sibai AM, et al. Dietary, lifestyle and socio-economic correlates of overweight, obesity and central adiposity in Lebanese children and adolescents. Nutrients. 2014;6(3):1038-62. https:// doi.org/10.3390/nu6031038
34. Monteiro CA, Levy RB, Claro RM, de Castro IR, Cannon G. Increasing consumption of ultra-processed foods and likely impact on human health: Evidence from Brazil. Public Health Nutr. 2011;14(1):5-13. https://doi.org/10.1017/S136898 0010003241
35. D’Avila GL, Silva DA, de Vasconcelos FA. As-sociação entre cosumo alimentar, atividade física, fatores socioeconômicos e percentual de gordura corporal em escolares. Ciênc Saúde Coletiva. 2016;21(4):1071-81. https://doi.org/10.15 90/14 1 3-81232015214.13722015
36. Dupuy M, Godeau E, Vignes C, Ahluwalia N. Socio-demographic and lifestyle factors associated with overweight in a representative sample of 11-15 year olds in France: Results from the WHO-Collaborative Health Behaviour in School-aged Children (HBSC) cross-sectional study. BMC Public Health. 2011;11:442. https://doi.org/10. 1186/1471-2458-11-442
37. Pinho L, Silveira MF, Botelho AC, Caldeira AP. Identification of dietary patterns of adolescents attending public schools. J Pediatr. 2014;90(3):267-72. https://doi.org/10.1016/j.jped.2013.04.006 38. Rieth MA, Moreira MB, Fuchs FD, Moreira
LB, Fuchs SC. Fruits and vegetables intake and characteristics associated among adolescents from Southern Brazil. Nutri J. 2012;11:95. https://doi. org/10.1186/1475-2891-11-95
39. Musaiger AO, Al-Roomi K, Bader Z. Social, dietary and lifestyle factors associated with obesity among Bahraini adolescents. Appetite. 2014;73:197-204. https://doi.org/10.1016/j.appet.2013.11.002 40. Bere E, Klepp KI, Overby NC. Free school fruit: Can
an extra piece of fruit every school day contribute to the prevention of future weight gain? A cluster randomized trial. Food Nutr Res. 2014;58. https:// doi.org/10.3402/fnr.v58.23194
41. Colucci ACA, Cesar CLG, Marchioni DML, Fisberg RM. Relação entre o consumo de açúcares de adição e a adequação da dieta de adolescentes residentes no município de São Paulo. Rev Nutr. 2011;24(2):219-31. https://doi.org/10.1590/S141 5-52732011000200003