Agreement between Center of Disease
Control and World Health Organization
reference growth
*CONCORDÂNCIA DOS REFERENCIAIS DE CRESCIMENTO PROPOSTOS PELO CENTER OF DISEASE CONTROL E ORGANIZAÇÃO MUNDIAL DE SAÚDE
CONCORDANCIA DE LOS REFERENCIALES DE CRECIMIENTO PROPUESTOS POR EL CENTER OF DISEASE CONTROL Y LA ORGANIZACIÓN MUNDIAL DE LA SALUD
* Taken from the thesis “Tipo de aleitamento materno em crianças de 3 a 11 meses e 29 dias de idade: crescimento e morbidade infantil”, University of São Paulo at Ribeirão Preto College of Nursing, 2008. 1 Master’s student, Graduate Program in Public Health Nursing, University of São Paulo at Ribeirão Preto College of Nursing. Nurse, Ribeirão Preto Municipal Health Secretary. Ribeirão Preto, SP, Brazil. [email protected] 2 Ph.D., Professor, Maternal-Infant and Public Health Nursing Department, University of São Paulo at Ribeirão Preto College of Nursing. Ribeirão Preto, SP, Brazil. [email protected] 3 Associate Profes-sor, Maternal-Infant and Public Health Nursing Department, University of São Paulo at Ribeirão Preto College of Nursing. Ribeirão Preto, SP, Brazil. [email protected] 4 Ph.D., Professor, Maternal-Infant and Public Health Nursing Department, University of São Paulo at Ribeirão Preto College of Nursing. Ribeirão Preto, SP, Brazil. [email protected] 5 Full Professor, Maternal-Infant and Psychiatric Nursing Department, University of São Paulo School of
O
RIGINAL
A
R
TICLE
Cláudia Aparecida Arcari Silva1, Maria José Bistafa Pereira2, Ana Márcia Spanó Nakano3, Flávia Azevedo Gomes4, Isilia Aparecida Silva5
RESUMO
O objetivo deste estudo foi verificar a con-cordância dos referenciais recomendados pelo Center of Disease Control (CDC) e pela Organização Mundial da Saúde (OMS) na ava-liação do estado nutricional. Trata-se de um estudo transversal, com participação de 254 crianças de 3 a 11 meses e 29 dias de idade de São Paulo e Ribeirão Preto, nos meses de junho de 2005 a julho de 2006. Os índices antropométricos foram calculados em progra-mas disponibilizados nos sites do CDC e OMS, respectivamente. Aplicado Teste Kappa para as variáveis nominais (comprimento/idade) e Kappa-ponderado para variáveis ordinais (peso/comprimento) evidenciou-se que os re-ferenciais CDC e OMS apresentam diferenças na avaliação nutricional infantil, sendo encon-trados resultados com maior discordância nas crianças de 3 a 6 meses.
DESCRITORES
Criança
Estado nutricional Desenvolvimento infantil Aleitamento materno Antropometria
ABSTRACT
The objective this study was to verify the a-greement of the guidelines recommended by CDC and WHO to evaluate the nutritional state. This is a cross-sectional study, which counted with the participation of 254 children of ages 3 to 11 months and 29 days from São Paulo and Ribeirão Preto, performed from June 2005 to July 2006. The anthropometric indexes were obtained using the software available on the CDC and WHO websites. The Kappa Test was used for nominal variables (length/age) and weighted-Kappa for ordinal variables (weight/length). It was found that there are differences between the CDC and WHO guidelines regarding the evaluation of child nutrition, with greater differences in the results for children of ages 3 to 6 months.
DESCRIPTORS
Child
Nutritional status Child development Breast feeding Anthropometry
RESUMEN
El objetivo deste estudio fue verificar la concordancia de referenciales recomenda-dos por CDC y OMS en evaluación del esta-do nutricional. Se trata de un estudio trans-versal, con participación de 254 niños de 3 a 11 meses y 29 días, de São Paulo y Ribeirão Preto, entre junio 2005 y julio 2006. Los índices antropométricos fueron calculados en programas disponibilizados en los portales del CDC y de OMS, respecti-vamente. Se aplicó Test Kappa para varia-bles nominales (altura/edad) y Kappa-pon-derado para variables ordinales (peso/altu-ra). Se evidenció que los referenciales CDC y OMS presentan diferencias en la evalua-ción nutricional infantil, encontrándose re-sultados de mayor discordancia en niños de 3 a 6 meses.
DESCRIPTORES
Niño
INTRODUCTION
This study is an excerpt from a multicenter research, funded by the São Paulo State Research Foundation – FAPESP, entitled Iron deficiency in children between three and twelve months old: biological, social determinants and their implications for the stimulus of exclusive breastfeed-ing, carried out concomitantly in São Paulo (SP), Ribeirão Preto (SP) and Rio de Janeiro (RJ).
In Rio de Janeiro, data were collected at a service that delivers care to women and high-risk infants. As one of the research variables in this study is child growth, we consid-ered that this fact could be a source of bias in the study when comparing these infants with low-risk newborns. Therefore, for the purpose of the research, data were col-lected in São Paulo (SP) and Ribeirão Preto (SP).
Across the lifetime, human beings present distinct growth phases that vary in terms of speed and are influ-enced by genetic, psychosocial and environmental factors, food supply and predominant hormonal
ac-tion in each phase(1).
Growth is a continuous but not a constant process, with phases of rapid growth, like in the intra-uterine period, during the first two years of life and puberty, and phases of more constant gains, like in the period between the age of two and the start of puberty(2).
Factors that can affect human growth are classified as exogenous and endogenous(3).
Exogenous factors are determined by nu-tritional, cultural, environmental and social conditions and exert a more dominant influ-ence on growth until the age of two, while endogenous factors, comprising biological,
genetic and ethnic determinants, interfere in growth more actively as from the age of two(3).
Although these factors are described separately for didac-tical purposes, in practice, they can intermingle and associate, making it difficult to define one single problem in the physio-pathology of the process. Despite this fact, in our midst, due to their frequency, food problems are very important(2).
Growth monitoring is one of the resources to obtain collective and individual health information(4-5) and
repre-sents an important instrument for nursing to assess children’s nutritional status, permitting earlier interventions when necessary.
Despite other growth and nutritional status assessment techniques, anthropometric measures, mainly weight and height, are the most commonly used due to their simplic-ity and easy collection.
Child growth reference curves are child health assess-ment and monitoring instruassess-ments. Growth graphs are
con-sidered valuable resources to assess growth and develop-ment during the important period of childhood, determin-ing the extent to which the child’s physiological needs are being attended to(6).
Various child growth assessment references exist, among which the following can be mentioned: the frame-work by Preece et al., 1995, the Curve by Tanner, Whitehouse and Takahishi, 1966, the one by Marques and Marcondes, 1999 and by the National Centre for Health Statistics (NCHS), 1977. Due to its large-scale use, the latter will be addressed in further detail(4).
In 1977, the NCHS and WHO disseminated and recom-mended a Weight/Age (W/A), Weight/Height (W/H), Length/Height (L/H), Length/Age (L/A), Height/Age (H/A) and Head Circumference/Age (HC/A) framework for appli-cation in the United States to female and male children and adolescents between 0 and 18 years of age. The reference (NCHS/1977) was later recommended for the assessment of different racial groups, after international recognition for the adequacy of its use. Although some limitations have been acknowledged, until 2006, it was widely used as a reference and also recommended by the Brazilian Ministry of Health.
Among acknowledged limitations, it is high-lighted that children receiving exclusive breast-feeding present a negative growth curve ac-cording to this reference. What explains this fact is that the data to elaborate the reference for children between 0 and 36 months of age were longitudinally collected by the Fels Re-search Institute, among white middle-class children living in Ohio (USA), between 1930 and 1975. Most of these children were for-mula-fed and showed different growth ratios than children fed with breast milk(7).
Reasons for the inadequacy of this reference pattern are both biological and technical. Data were collected from formula-fed children, which today is not recommended to feed children this age. Besides, these data were collected during a period when solid foods were frequently intro-duced during the first months of life, justifying the biologi-cal inadequacy of the reference. Technibiologi-cal problems are justified by the frequency of data measurement, obtained at birth and at 3, 6, 9 and 12 months. As these measure-ments were not frequent, they do not reliably describe children’s rapid growth in this period of life(8).
The NCHS (1977) reference curves were used for more than 20 years for child growth assessment. In 1985, a re-view process started, due to the recognition of existing limi-tations. Hence, studying another reference was proposed, considering the type of food the child received. Thus, be-tween 1992 and 1997, five meetings were held among dif-ferent professionals, including biostatisticians, pediatricians and nutritionists. The Centers for Disease Control (CDC)
Growth monitoring is one of the resources to
obtain collective and individual health information and
represents an important instrument for nursing to assess children’s nutritional
status, permitting earlier interventions
published this study in 2000, expressing a combination of formula and breast milk-fed children(9).
For the construction of the new CDC curves, data were used that had been collected in seven studies, carried out in the United States and Northern Europe. Although the new curves present some differences in comparison with the NCHS curves, some similar limitations continue regard-ing children up to 2 years of age, suggestregard-ing insufficient weight gain for breastfed children(7,10).
Due to the NCHS curve’s technical and biological prob-lems, highlighted by an Expert Committee from the World Health Organization (WHO), in 1994, the need to develop an international standard was agreed upon in resolution WHA 47.5. WHO was charged with establishing this new standard by elaborating a set of adequate curves to assess the growth and nutritional status of children until the pre-school age.
WHO’s Multicentre Growth Reference Study (MGRS) was carried out between 1997 and 2003. Data were collected from 8,500 children, covering the African, Asian, American and Eu-ropean continents, combining a longitudinal research between birth and 24 months with a cross-sectional study of children between 18 and 71 months. The study included a group of Brazilian children from Pelotas (RS), which served as a pilot project. Sample inclusion criteria were: sub-populations in fa-vorable socioeconomic conditions for growth, low mobility, >20% of mothers following food recommendations and ac-cess to breastfeeding support. The absence of environmental or health restrictions on growth, adherence to food recom-mendations described in the MGRS, non-smoking mothers, single term pregnancy and absence of significant morbidity were the individual criteria for inclusion. The mothers and in-fants were screened and recruited at birth and visited at home 21 times: during weeks 1, 2, 4 and 6; monthly between 2 and 12 months; and every two months in the second year of life. Data were collected on anthropometrics, motor development, socioeconomic, demographic and environmental characteris-tics, perinatal factors and food practices(11).
The results were the new WHO curves, constituting a technically robust instrument and representing the best existing description of physical growth for children below the age of five, characterizing normal child growth in excel-lent environmental conditions. The curves should be used for children in any country, independently of ethnic ori-gins, socioeconomic conditions and food type(12).
It is believed that, through the application of the new standards, children are assessed more adequately, mainly when breastfed, as breastfeeding is considered the biologi-cal standard according to this reference framework.
OBJECTIVES
To check the agreement between the recommended CDC and WHO references in the assessment of low weight for height, adequate weight for height, high weight for
height, low height for age and adequate height for age di-agnoses, according to length/age and weight/length ratios.
METHOD
A cross-sectional, observational, descriptive research with a quantitative approach was carried out, involving mothers of children seen in childcare in São Paulo (SP) and Ribeirão Preto (SP), addressing aspects of growth.
Study participants were 254 children between 3 and 11 months and 29 days of age, attended during previously sched-uled childcare appointments between July 2005 and July 2006, together with their mothers, at selected health ser-vices in two of the three cities involved in the multicenter study: Ribeirão Preto and São Paulo. Due to abovementioned reasons, Rio de Janeiro city, which was part of the multicenter research, was not included in this study. The exclusion crite-ria were: children without a scheduled appointment; chil-dren not accompanied by their mothers: chilchil-dren born with less than 38 weeks of gestational age; twins; children who had already participated in this study earlier.
In Ribeirão Preto, after an analysis by faculty from the University of São Paulo at Ribeirão Preto College of Nurs-ing and nurses from the public network, the Basic District Health Unit of Vila Virgina was chosen, due to the high childcare demand in the age range from 0 to 12 months at this service, which is part of the target public. Also, this service delivers care to clients from different socioeconomic levels, permitting knowledge on the range of living condi-tions in the study population.
Likewise, in São Paulo, the Teaching Health Center Butantã was chosen, with a significant childcare demand for the age range covered in this study. This service belongs to the Uni-versity of São Paulo, which works in partnership with the University’s School of Medicine and the State Health Secre-tary, which receives students from different undergraduate courses in health. Its geographical coverage area is large and clients come from different socioeconomic levels.
For this research, part of the data collected in the multicenter research was used. A previously elaborated data collection form was applied, with questions on the children’s characteristics and anthropometric data (at birth and at the moment of the research).
The study started after approval from the Institutional Review Board at the University of São Paulo School of Nurs-ing, registered under Process No. 342/2003/CEP-EEUSP. In-terviews started after the mothers had been informed about the research aims, procedures to be performed, duration and signing of the Informed Consent Term, according to CNS Resolution 196/196.
The mothers were contacted when they arrived at the unit and, when they agreed to participate in the study, the inter-views were held at a previously prepared room, while they were awaiting the doctor’s appointment, or the mothers were oriented to await data collection after the appointment.
After the data collection, double data entry was used to process data in Excel and later Statistical Package for Social Sciences software (SPSS, version 11.5 for Windows). Weight/length, length/age and weight/age ratios were calculated for each of the references used, through computer programs in the public domain, available on the CDC and WHO websites, respectively. After the calculations, the collected ratios were transported to SPSS for statistical analyses.
To assess the child growth agreement coefficient be-tween the length/age and weight/length ratios according to the CDC and WHO references, the Kappa Test was used for nominal variables (length/age) and the weighted Kappa coefficient for ordinal variables (weight/length).
Cut-off points for child growth classification
To assess the nutritional status of the children analyzed according to the CDC reference, the anthropometric ratios and cut-off points proposed by the CDC were used, which were:
•
Dwarfism or low height/age < Percentile 5; Low weight for height; weight/height < Percentile 5; - Adequate weight for height: Weight/height Percentile between 5 and 95; Overweight: Weight/Height > Percentile 85; Obesity: Weight/height > Percentile 95.The cut-off points to analyze the nutritional status of children as recommended by WHO and adopted by the Brazilian Ministry of Health are described next. The same cut-off points were adopted when this reference was used. The cut-off points for assessment according to the WHO reference were: Low weight for height < Percentile 3; Ad-equate weight or eutrophic > Percentile 3 and < Percentile 97;- High weight for height > Percentile 97; Low Height for Age < Percentile 3; Adequate Height for Age > Percentile 3. As observed, the differences between the CDC and WHO references are not just restricted to calculations to obtain the anthropometric ratios, but also involve the cut-off points to assess the children’s nutritional status.
RESULTS
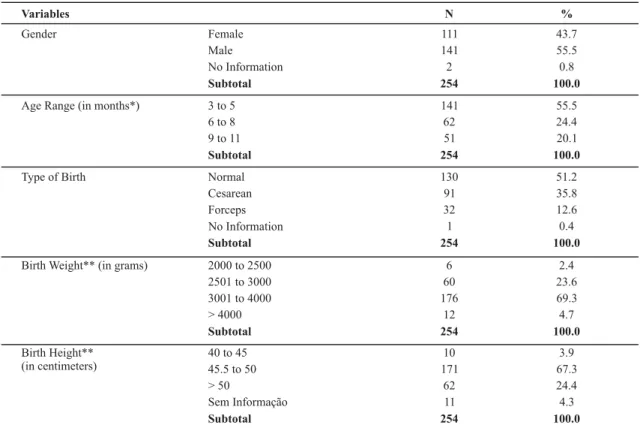
Table 1 shows the sample children’s distribution in terms of gender, age range, delivery type, weight and height at birth.
Table 1 - Characteristics of study population - Ribeirão Preto - 2008
Variables
Gender
Age Range (in months*)
Type of Birth
Birth Weight** (in grams)
Birth Height** (in centimeters)
N %
Female Male No Information Subtotal
111 141 2 254
43.7 55.5 0.8 100.0
3 to 5 6to8 9to11 Subtotal
Normal Cesarean Forceps No Information Subtotal
141 62 51 254
130 91 32 1 254
55.5 24.4 20.1 100.0
51.2 35.8 12.6 0.4 100.0
2000 to 2500 2501 to 3000 3001to4000 > 4000 Subtotal
40to45 45.5to50 > 50
Sem Informação Subtotal
6 60 176
12 254
10 171
62 11 254
2.4 23.6 69.3 4.7 100.0
3.9 67.3 24.4 4.3 100.0
Obs: Children between 3 and 11 months and 29 days of age attended during prescheduled appointments between July/2005 and July/2006 in Ribeirão Preto (SP) and São Paulo (SP). *Age is considered in full months and up to another 29 days. **Child’s weight and height at birth.
As observed in Table 1, of all children who participated in the study, 141 (55.5%) were male and 111 (43.7) female,
months old; 62 (24.4%) between 6 and 8 months and 51 (20.1%) between 9 and 11 months. The children’s mean age in days was 194.31. As for the type of delivery, 130 (51.2%) children were born through normal delivery and 91 (35.8%) through caesarean birth. The questionnaire for 1 (0.4%) child did not mention this data. The minimum weight at birth was 2,340 grams and the maximum 5,585 grams, with a mean 3,303.92 grams. Most children’s weight at birth ranged between 3,001 and 4,000 grams. Regarding height at birth, 176 children measured between 45.5 and 50 cm, totaling 69.3% of the sample, with a minimum of 40 cm, maximum 58 cm and mean 49.17 cm. This information was lost for 11 (4.3%) interviewees.
Anthropometric ratios should be analyzed and assessed in comparison with a reference framework. In this study,
we intended to analyze the weight and length of children in the sample with the reference standards of the CDC and WHO, using the anthropometric ratios weight/height, height/age, calculated through computer programs made available by the CDC and WHO, respectively.
Correlation between measures according to CDC and WHO references
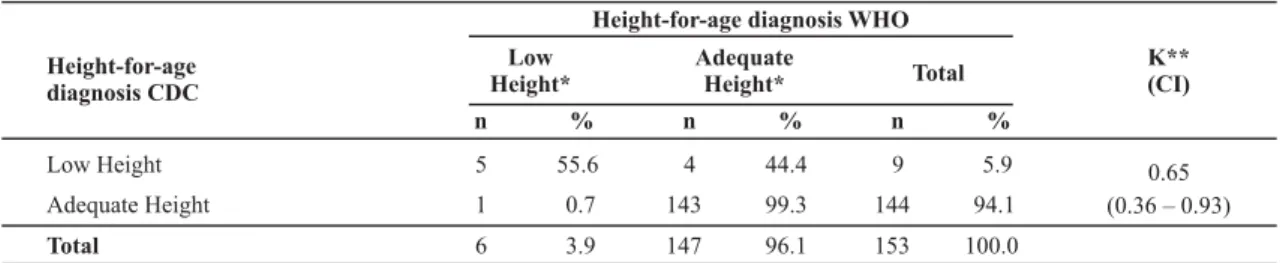
Based on data analysis, the sample was divided in two sub-samples: children between 3 and 6 months and 29 days and children between 7 and 11 months and 29 days of age. Table 2 shows the height-for-age diagnosis of children between 3 and 6 months of age, analyzing the agreement coefficient between the CDC and WHO references.
Table 2 - Distribution of children between 3 months and 6 months and 29 days old, according to Kappa agreement coefficient of
height-for-age coefficient according to WHO and CDC references - Ribeirão Preto - 2008
Height-for-age diagnosis CDC
Low Height
Adequate Height
Total
Height-for-age diagnosis WHO
Low Height*
Adequate
Height* Total
Κ** (CI)
n
5
1
6
%
55.6
0.7
3.9 n
4
143
147 %
44.4
99.3
96.1 n
9
144
153 %
5.9
94.1
100.0
0.65 (0.36 – 0.93)
We found 5 children diagnosed with low height for age, according to the two references, representing a 55.6% a-greement level on this diagnosis, against 99.3% of agree-ment in children considered as adequate height for age.
The analysis of the Kappa agreement coefficient for the height-for-age diagnosis according to the two references in the sub-sample of children between 3 and 6 months old showed K= 0.65 (CI=0.36-0.93), which means a total coeffi-cient of 65.0% of agreement on the diagnoses. These
coef-ficients demonstrate an important difference in the children’s assessment by each of these references, demon-strated by the 35.0% disagreement level.
The agreement coefficient on the height-for-age diag-nosis according to the CDC and WHO references in the subsample of children between 7 and 11 months of age reveals that the diagnosis of children considered as low-height for age was the same in 55.6%, against 98.8% of a-greement on the adequate height diagnosis (Table 3).
Table 3 - Distribution of children between 7 months and 11 months and 29 days old, according to Kappa agreement coefficient of
height-for-age coefficient according to WHO and CDC references - Ribeirão Preto - 2008
Low Height Adequate Height
Total Height-for-age diagnosis CDC
5 2
7
55.6 1.2
4.1
4 161
165
44.4 98.8
95.9
9 163
172
5.2 94.8
100.0
0.61 (0.32– 0.89)
Height-for-age diagnosis WHO Low
Height*
Adequate
Height* Total
Κ** (CI)
n % n % n %
Obs: Attended during prescheduled appointments between July/2005 and July/2006, in Ribeirão Preto (SP) and São Paulo (SP) *Height **K=Kappa with 95% confidence interval
Obs: Attended during prescheduled appointments between July/2005 and July/2006, in Ribeirão Preto (SP) and São Paulo (SP) *Height **K=Kappa with 95% confidence interval
According to the Kappa coefficient, these two references show agreement on the results of the height-for-age diagnosis totaling 61.0%, disagreeing in 39.0%, with K=0.61 (CI=0.32-0.89). The data presented in Table 4 show the comparison between the weight for height diagnosis for children
Table 4 - Distribution of children between 3 months and 6 months and 29 days of age, according to weighted K agreement coefficient of height-for-age diagnosis according to WHO and CDC reference framework - Ribeirão Preto - 2008
Weight/height diagnosis* WHO
Low Weight for Height Adequate Weight for Height* High Weight for Height*
Total
Weight/height diagnosis* CDC Low Weight
for Height*
Adequate Weight for Height*
High Weight
for Height* Total
n
4 0 0
5
%
57.1 0.0 0.0
3.3 n
3 131
3
137 %
42.9 100.0
20.0
89.5
n
0 0 12
12 %
0.0 0.0 80.0
7.8 n
7 131
15
153 %
4.6 85.6
9.8
100.0
0.84 (0.47 – 1.0)
Κ* (CI)
Obs: Attended during prescheduled appointments between July/2005 and July/2006, in Ribeirão Preto (SP) and São Paulo (SP) *Height **K=Kappa with 95% confidence interval
The two references found 4 children with low weight for height, representing 57.1% of agreement. In total, 131 (100%) and 12 (80%) were considered with adequate weight for height and high weight for height, respectively, in the two references (Table 4).
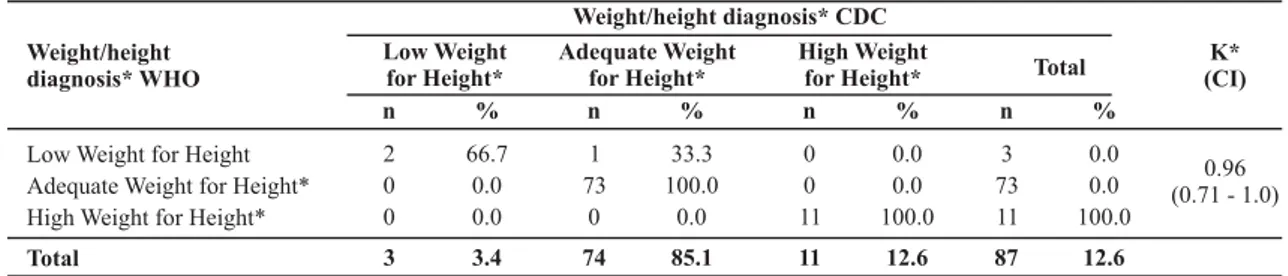
The comparison between the weight for height diagnosis in children between 7 and 11 months of age showed K=0.96 (CI=0.71-1.0), meaning 96% of agreement in the assessment of the sub-sample according to the two reference frameworks.
Table 5 showed 100.0% of agreement on the children considered with adequate weight for height, representing 73 children. Among the children classified with low weight for height, we found 2 children according to the two refer-ences, with 66.7% of agreement on this diagnosis, while 1 child considered with low weight according to the CDC ref-erence was classified with adequate weight according to WHO. The agreement level on the children with high weight for height was 100.0% according to both references, which classified 11 children in this category.
Table 5 - Distribution of children between 7 months and 11 months and 29 days of age, according to weighted K agreement coefficient
of height-for-age diagnosis according to WHO and CDC reference framework - Ribeirão Preto - 2008
Weight/height diagnosis* CDC Weight/height
diagnosis* WHO
Low Weight for Height*
Adequate Weight for Height*
High Weight
for Height* Total
Low Weight for Height Adequate Weight for Height* High Weight for Height*
Total
Κ* (CI)
2 0 0
3
66.7 0.0 0.0
3.4 1 73 0
74
33.3 100.0 0.0
85.1
0 0 11
11
0.0 0.0 100.0
12.6 3 73 11
87
0.0 0.0 100.0
12.6
0.96 (0.71 - 1.0)
n % n % n % n %
Obs: Attended during prescheduled appointments between July/2005 and July/2006, in Ribeirão Preto (SP) and São Paulo (SP) *Height **K=Kappa with 95% confidence interval
DISCUSSION
Although anthropometric methods are widely used to assess individuals and communities, some care should be taken in this assessment, as these methods are generally used separately, with punctual measures.
The differences between the two references uses here relate to the calculations to obtain the percentiles as well as the cut-off points or nutritional diagnosis for each. There is a lack of studies that compare the results reached through the two references selected in this research.
The comparison between the two references through the statistical test to assess the agreement coefficient showed that, in the height/age assessment, 65.0% of agree-ment for children between 3 and 6 months of age and 61.0% for children between 7 and 11 months old. For the weight/ height ratio, agreement levels amounted to 84.0% and 96.0% for children between 3 and 6 months old and
be-tween 7 and 11 months old, respectively. Hence, disagree-ment levels between the two references are higher for height/age assessment and higher in the age range between 3 and 6 months old in the weight/height assessment.
A study on the differences between the CDC and WHO growth references indicated that the differences are more important in childhood. According to the WHO reference framework, lower malnutrition rates were found (except in the first 6 months of life), and higher overweight and obe-sity rates(13). These data diverge from the present study
al-though, for the sake of comparison, other variables would need to be investigated, such as the type of food the chil-dren under analysis consumed.
CONCLUSION
aimed to show the difference between the two growth ref-erences to assess children’s nutritional status. In conclusion, the CDC and WHO references do show differences in child nutrition assessment, with higher disagreement levels for children between 3 and 6 months of age. When assessed by the WHO reference, the children show more adequate diag-noses than according to the CDC. It should be reminded that,
between 3 and 6 months of age, more children receive breast-feeding, which is one of the factors that influenced the elabo-ration of the new WHO growth curves. Further studies are needed to investigate other growth-related variables to clarify the identified differences, as well as the elaboration of a stan-dardized method to compare results for populations from different places.
REFERENCES
1. Longui CA. Crescimento normal. In: Monte O, Longui CA, Calliari E. Endocrinologia para o pediatra. 2ª ed. São Paulo: Atheneu; 1998. p. 3-10.
2. Taddei JAC, Lopes LA. Baixa estatura de causa nutricional. In: Barbieri D, Palma D. Gastroenterologia e nutrição. São Paulo: Atheneu; 2001. p. 233-41.
3. Spyrides MHC. Efeito das práticas alimentares sobre o crescimen-to infantil. Rev Bras Saúde Mater Infant. 2005;5(2):145-53.
4. Zeferino AMB, Barros Filho AA, Bettiol H, Barbieri MA. Acom-panhamento do crescimento. J Pediatr (Rio J). 2003;79 Supl 1:S23-32.
5. Mello DF, Rocha SMM, Martins DC, Chiozi SZ. Cuidados mater-nos a crianças de baixo peso ao nascer. Rev Esc Enferm USP. 2002;36(3):262-9.
6. Onis M, Victora CG. Gráficos de crescimento para bebês alimen-tados com leite materno. J Pediatr (Rio J). 2004;80(2):85-7.
7. Soares, NT. Um novo referencial antropométrico de crescimen-to: significados e implicações. Rev Nutr. 2003;16(1):93-104.
8. Garza C, Onis M. A new internacional growth reference for young children. Am J Clin Nutr. 1999;70(1)169S-72S.
9. Kuczmarski RJ, Ogden CL, Flegal KM, Guo SS, Wei R, Zuguo M, et al. CDC growth charts: advance data from vital and health statistics. Maryland: National Center for Health Statistics; 2000.
10. Onis M, Onyango AW. The Centers for Disease Control and Prevention 2000 growth charts and the growth of breastfed infants. Acta Paediatr. 2003;92(4):413-9.
11. Onis M, Garza C, Victora CG, Bhan MK, Norum KR. The WHO Multicentre Growth Reference Study (MGRS): racionale, planning, and implementation. Food Nutr Bull. 2004;25(1 Suppl):1-89.
12. Brasil. Ministério da Saúde. Secretaria de Atenção à Saúde. De-partamento de Atenção Básica. Coordenação Geral da Política de Alimentação e Nutrição. Vigilância Alimentar e Nutricional (SISVAN). Orientações para coleta e análise de dados antropo-métricos em serviços de saúde:material preliminar. Brasília; 2008.
13. Onis M, Garza C, Onyango AW, Borghi E. Comparision of the WHO child growth standards and CDC 2000 growth charts. J Nutr. 2007;137(1):144-8.