Flávia dos Santos BarbosaI
Rosely SichieriII
Washington Leite JungerII
I Departamento de Nutrição Social. Instituto
de Nutrição. Universidade do Estado do Rio de Janeiro. Rio de Janeiro, RJ, Brasil
II Departamento de Epidemiologia. Instituto
de Medicina Social. Universidade do Estado do Rio de Janeiro. Rio de Janeiro, RJ, Brasil Correspondence:
Flávia dos Santos Barbosa
Instituto de Nutrição. Departamento de Nutrição Social – UERJ
Rua São Francisco Xavier, 524 - 12º Andar Bloco E Sala 12008 Maracanã
20550-900 Rio de Janeiro, RJ, Brasil E-mail: barbosafl [email protected] Received: 11/25/2011
Approved: 11/28/2012
Article available from: www.scielo.br/rsp
Assessing usual dietary intake in
complex sample design surveys:
the National Dietary Survey
Avaliação do consumo alimentar
usual em pesquisas com amostras
complexas: Inquérito Nacional de
Alimentação
ABSTRACT
The National Cancer Institute (NCI) method allows the distributions of usual intake of nutrients and foods to be estimated. This method can be used in complex surveys. However, the user must perform additional calculations, such as balanced repeated replication (BRR), in order to obtain standard errors and confi dence intervals for the percentiles and mean from the distribution of usual intake. The objective is to highlight adaptations of the NCI method using data from the National Dietary Survey. The application of the NCI method was exemplifi ed analyzing the total energy (kcal) and fruit (g) intake, comparing estimations of mean and standard deviation that were based on the complex design of the Brazilian survey with those assuming simple random sample. Although means point estimates were similar, estimates of standard error using the complex design increased by up to 60% compared to simple random sample. Thus, for valid estimates of food and energy intake for the population, all of the sampling characteristics of the surveys should be taken into account because when these characteristics are neglected, statistical analysis may produce underestimated standard errors that would compromise the results and the conclusions of the survey.
For most epidemiological diet analyses, usual intake is required, and in many situations, such as in large surveys, only one or two 24-hour recalls (24HR) or food records are collected. These methods yield an excessive amount of within-person variation,4 and early attempts to compensate for this limitation by averaging over a small number of days1 do not adequately represent usual individual intakes. Thus, more sophisticated methods based on statistical modelling were developed,2 paying special attention to the problems that are inherent in modelling usual intake of foods or food groups that are episodically consumed. Challenges for the statistical modelling of usual intake include the following: the ratio of within-person and between-person variation; the reported days that are without consumption or the consumption-day amounts that are positively skewed, with extreme values in the upper tail; the correlation between the probability of consumption and the consumption-day amount; and covariate information on usual intake.
The National Cancer Institute (NCI) method was designed to meet all of these challenges by allowing effi cient estimation of the usual intake distributions of daily and episodically consumed items.13 The method also allows the prediction of individual intakes to be used in a model to assess the relationship between diet and disease or another variable6 and by performing an assessment of the effects of individual covariates on consumption.12 An extension of the NCI method has also been used to estimate the population distributions of the ratios of usual intakes of dietary components.5
RESUMO
O objetivo do estudo foi indicar uma adaptação do método do Instituto Nacional do Câncer (INC), utilizando-se dados do Inquérito Nacional de Alimentação. Esse método estima a distribuição do consumo usual de nutrientes e alimentos e pode ser aplicado em estudos com amostra complexa. Entretanto, são necessários cálculos adicionais, tais como a replicação repetida balanceada, a fi m de obter os erros padrão e intervalos de confi ança para os percentis e a média da distribuição de consumo usual. A aplicação desse método foi exemplifi cada analisando o total de energia (kcal) e frutas (g), comparando as estimativas das médias e seus respectivos erros padrão obtidos, considerando o desenho do inquérito e supondo amostra aleatória simples. Embora os resultados das estimativas pontuais para a média tenham sido similares, houve aumento de até 60% nos respectivos erros padrão na amostragem complexa, comparada à amostragem simples. Desse modo, para estimativas válidas de consumo de alimentos e de energia devem-se levar em conta todas as características de amostragem dos inquéritos, porque, quando essas características são negligenciadas, a análise estatística pode produzir erros padrão subestimados que podem comprometer os resultados e conclusões da pesquisa.
DESCRITORES: Hábitos Alimentares. Avaliação Nutricional. Inquéritos sobre Dietas, utilização. Amostras Complexas.
INTRODUCTION
The objective of this article is to indicate the necessary adaptations of the NCI method when estimating the distributions of usual intakes of nutrients and foods.
THE NATIONAL CANCER INSTITUTE METHOD
The premise of the NCI method is that usual intake is equal to the probability of consumption on a given day times the average amount that is consumed in one day. For the dietary components that are consumed nearly every day, the probability is one: if less than 5% of the population had zero intake of a food, this amount-only model can be used and is referred to as a one-part model. For a two-part model, the fi rst part estimates the probability of consumption using logistic regression with a person-specifi c random effect. The second part specifi es the consumption-day amount using linear regression on a transformed scale, with a person-specifi c effect. The two parts are linked by allowing the two person-specifi c effects to be correlated and by including common covariates in both parts of the model. Covariates may be included, particularly if there is interest in subpopulations.13
Macros developed by the NCIa in Statistical Analysis System (SAS) program in short, for a single dietary component, two macros are available: The fi rst macro,
MIXTRAN, transforms the data and fi ts the model. The second macro, DISTRIB, uses the parameters that are estimated by MIXTRAN to estimate the usual intake statistics through simulation. DISTRIB can also provide the estimated percentage of the popula-tion whose usual intake falls below a given value.13
The standard errors and p-values output of the Mixtran macro are only valid for an analysis of a simple random sample. Special care must be taken when using the NCI SAS macros to analyze data from a complex survey, because in analysis of complex surveys, calculation of these standard errors requires additional programming to implement a replication method such as Balanced Repeated Replication (BRR).
Standard Errors in complex samples
Complex samples (CS) differ from simple random samples (SRS) in that SRS designs assume inde-pendence of observations, while CS does not. In complex sample design surveys, the standard error estimates are generally small and biased if the differential weighting of individuals and the complexity of a sample design (i.e., the identifi -cation of stratum and primary sample units (PSU) are ignored.7 The replication methods represent one approach to handling this problem, with standard errors computed from each subsample, and the variability among these subsamples (or replicate estimates) is used to compute the standard errors of the full estimate.14
There are various replication methods for creating subsamples. In this study, a variation of the Balanced Repeated Replication (BRR) method known as Fay’s BRR method was used.3,8 The BRR is a variance estimation method for two PSU/stratum designs. BRR makes a half-sample replicate by selecting one unit from each pair of PSUs and weighting the selected unit by 2 so that it represents both units. Consequently, esti-mates from every PSU are in each replicate, although half of them are weighted to zero.
In Fay’s BRR method, observations in the sample PSUs that are not chosen for replication are not zeroed out, in contrast to BRR. Instead, their sampling weight is dimi-nished by a multiplicative factor K (K is a proportion),
whereas the observations in the sample PSU that are chosen for the replication have their sampling weights enhanced by the multiplicative factor (2 – K). Setting K = 0 yields the standard BRR technique. A commonly recommended value is K = 0.3 for Fay’s method. For example, when K = 0.3, the weights are reduced to 30% of their original values in one half sample and are increased to 170% of the original value in the other half sample.
The Fay’s BRR method was developed for the specifi c situation in which there are two PSUs per stratum design; however, the Brazilian Dietary survey has more than two PSUs per stratum. To overcome this restriction, the usual way is to randomly group the PSU in each stratum into two groups and then apply the BRR procedure. This is the so-called grouped balanced half-sample (GBHS) method.
To exemplify the GBHS method, consider stratifi ed random sampling without replacement from a fi nite population of N units divided into H strata, with Nh units in stratum . Let nh be the sample size in stratum h. In the GBHS method, the sample in each stratum
is fi rst divided at random into two groups containing and units. A set of R half-samples balanced on the groups is formed as follows: Let
if group 1 in stratum h is in the r
th half-sample, otherwise, and , r = 1, ..., R. More details on this method may be found in Kish & Frankelb (1968) and Wolter14 (1985). An SAS macro was utilized to perform the random grouping of PSUs within stratum.
We applied all of these procedures in the following example using the 2008-2009 Brazilian Dietary Survey, which has a complex sample design. This survey was performed as a part of the 2008-2009 Household Budget Survey (HBS), which was conducted by the Brazilian Offi ce of Statistics and Geography (IBGE – Instituto Brasileiro de Geografi a e Estatística) as a two-stage sampling process. In the fi rst stage, PSUs were selected according to the number of households that were in a unit, and in the second stage, the households were selected by simple random sampling. The Individual Dietary Intake was conducted in 24% of the households that were selected in the 2008-2009 HBS. Two non-consecutive days of food records were collected among 34,003 individuals. For this analysis, 1,254 women who were pregnant or lactating were excluded. This resulted in a fi nal sample size of 32,749 individuals. Number of individuals in each days of food record for energy and total fruit by sex and age group is shown in Table 1.
a Usual Dietary Intakes: SAS Macros for Analysis of a Single Dietary Component. [cited 2013 Mar 6]. Available from: http://riskfactor.cancer.
gov/diet/usualintakes/macros.html
b Kish L, Frankel MR. Balanced repeated replication for analytical statistics. In: Proceedings of the Social Statistics Section, 2-11. 1968. New
Table 1. Number of individuals in each days of food record for energy and total fruit by sex and age group. Brazilian Dietary
survey 2008-2009.a
Age (years)
Days of food record
Energy (kcal) Total fruit (g)
1 2 Total 0 1 2 Total
n % n % n % n % n % n % n %
Males
10-13 50 3.3 1,465 96.7 1,515 100 887 58.5 384 25.3 244 16.1 1,515 100
14-18 69 3.6 1,836 96.4 1,905 100 1,208 63.4 443 23.3 254 13.3 1,905 100
19-59 365 3.5 9,922 96.5 10,287 100 6,266 60.9 2,417 23.5 1,604 15.6 10,287 100
60+ 56 2.8 1,937 97.2 1,993 100 1,077 54.0 466 23.4 450 22.6 1,993 100
Females
10-13 49 3.1 1,517 96.9 1,566 100 860 54.9 452 28.9 254 16.2 1,566 100
14-18 63 3.5 1,748 96.5 1,811 100 970 53.6 529 29.2 312 17.2 1,811 100
19-59 341 3.0 11,003 97.0 11,344 100 5,647 49.8 3,130 27.6 2,567 22.6 11,344 100
60+ 62 2.7 2,266 97.3 2,328 100 995 42.7 619 26.6 714 30.7 2,328 100
a Women who were pregnant and lactating were excluded.
The application of the NCI method varies for dietary components that are consumed daily and those that are episodically consumed. We exemplifi ed both of the situations, analyzing the total energy (kcal) and
fruits (g). The means, standard errors for means, and intakes at the 10th, 50th, and 90th percentiles and standard errors for gender/age groups were estimated for the two examples, comparing estimations that were based on
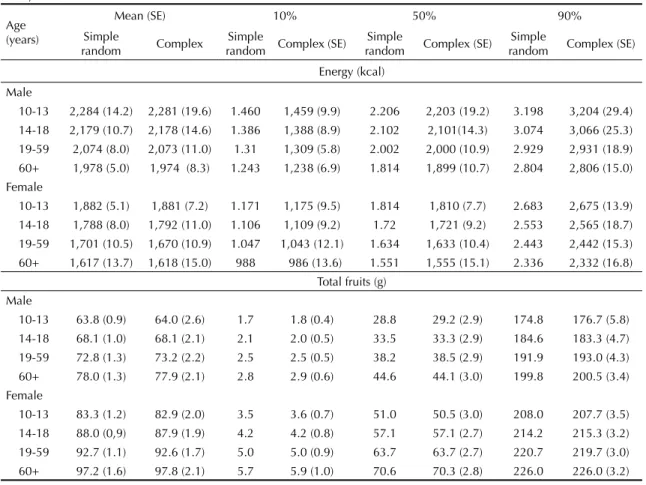
Table 2. Mean (SE) and percentiles (SE) of usual intake according to the sample design assumed for the survey. Brazilian Dietary
survey 2008-2009.a
Age (years)
Mean (SE) 10% 50% 90%
Simple
random Complex
Simple
random Complex (SE)
Simple
random Complex (SE)
Simple
random Complex (SE)
Energy (kcal)
Male
10-13 2,284 (14.2) 2,281 (19.6) 1.460 1,459 (9.9) 2.206 2,203 (19.2) 3.198 3,204 (29.4)
14-18 2,179 (10.7) 2,178 (14.6) 1.386 1,388 (8.9) 2.102 2,101(14.3) 3.074 3,066 (25.3)
19-59 2,074 (8.0) 2,073 (11.0) 1.31 1,309 (5.8) 2.002 2,000 (10.9) 2.929 2,931 (18.9)
60+ 1,978 (5.0) 1,974 (8.3) 1.243 1,238 (6.9) 1.814 1,899 (10.7) 2.804 2,806 (15.0)
Female
10-13 1,882 (5.1) 1,881 (7.2) 1.171 1,175 (9.5) 1.814 1,810 (7.7) 2.683 2,675 (13.9)
14-18 1,788 (8.0) 1,792 (11.0) 1.106 1,109 (9.2) 1.72 1,721 (9.2) 2.553 2,565 (18.7)
19-59 1,701 (10.5) 1,670 (10.9) 1.047 1,043 (12.1) 1.634 1,633 (10.4) 2.443 2,442 (15.3)
60+ 1,617 (13.7) 1,618 (15.0) 988 986 (13.6) 1.551 1,555 (15.1) 2.336 2,332 (16.8)
Total fruits (g) Male
10-13 63.8 (0.9) 64.0 (2.6) 1.7 1.8 (0.4) 28.8 29.2 (2.9) 174.8 176.7 (5.8)
14-18 68.1 (1.0) 68.1 (2.1) 2.1 2.0 (0.5) 33.5 33.3 (2.9) 184.6 183.3 (4.7)
19-59 72.8 (1.3) 73.2 (2.2) 2.5 2.5 (0.5) 38.2 38.5 (2.9) 191.9 193.0 (4.3)
60+ 78.0 (1.3) 77.9 (2.1) 2.8 2.9 (0.6) 44.6 44.1 (3.0) 199.8 200.5 (3.4)
Female
10-13 83.3 (1.2) 82.9 (2.0) 3.5 3.6 (0.7) 51.0 50.5 (3.0) 208.0 207.7 (3.5)
14-18 88.0 (0,9) 87.9 (1.9) 4.2 4.2 (0.8) 57.1 57.1 (2.7) 214.2 215.3 (3.2)
19-59 92.7 (1.1) 92.6 (1.7) 5.0 5.0 (0.9) 63.7 63.7 (2.7) 220.7 219.7 (3.0)
60+ 97.2 (1.6) 97.8 (2.1) 5.7 5.9 (1.0) 70.6 70.3 (2.8) 226.0 226.0 (3.2)
SE: Standard error
simple random sampling (considering only weights) and complex sampling (considering the weights and the complexity of sample design). For complex sampling, standard errors were estimated using Fay’s BRR method, and twelve sets of BRR replicate weights were generated with a factor 0.3. As an additional step, the sampling weights were rounded before being fed into macros, because the MIXTRAN macro can only work with integer sampling weights. The weights were post-stratifi ed to control totals in each replicate.
The models were fi tted to the data using the statistical software package SAS (Version 9.2).
More than 50% of the individuals in each sex-age group reported no consumption of fruits indicating how episodic fruit consumption is. For energy, more than 96% in each sex-age group provide two days (Table 1). As expected, point estimates were similar when complex sampling and simple random sampling were compared, but there was an important difference in the standard errors, which vary according to the subpopulations. The percentiles of usual intakes were also quite similar because the NCI method corrects for within-person variability (Table 2).
DISCUSSION
The NCI method is one way of estimating usual intake. Recently, four methods (Iowa State University Method - ISU, National Cancer Institute - NCI, Multiple Source Method - MSM, and Statistical Program for Age-adjusted
Dietary Assessment - SPACE) were compared, and all of them provided similar estimates of usual food intake. Nevertheless, when a nutrient has a high within-person variation or has a highly skewed distribution, and when the sample size is small, the estimates could be biased.10
One limitation of the NCI and other methods is the assumption that the 24HR records represent an unbiased instrument for measuring food intake. Studies with doubly labeled water have found misreporting of the energy intake on the 24HR record, almost always in the direction of underreporting.11 This observation suggests that at least some foods are underreported as well.10,11
Greater understanding of the effect of each characte-ristic of the sampling on the results should stimulate researchers to use adequate methods for data analysis. The Brazilian Dietary Survey is stratifi ed to account for variation in intakes over the entire year, and strati-fi cation has an important effect on weighting but also in the degrees of freedom of the analysis. Clustering at the PSU level is the most important factor, increasing by more than twice the SE. On the other hand, the NCI process of accounting for intra-individual variability in food intake and weighting corrected almost all of the skewedness in the subpopulation that was analyzed.
Valid estimation of food and energy intake for the population must account for all of the sampling charac-teristics of the surveys because when these characte-ristics are neglected, statistical analysis might produce underestimated standard errors that would compromise the results and the survey’s conclusions.
1. Carriquiry AL. Estimation of usual intake distributions of nutrients and foods. Proceedings from the workshop Future Directions for What We Eat in America–
NHANES: The integrated CSFII-NHANES. J Nutr.
2003;133 (suppl 2):609S-623S.
2. Dodd KW, Guenther PM, Freedman LS, Subar AF, Kipnis V, Midthune D, et al. Statistical methods for estimating usual intake of nutrients and foods: a review
of the theory. J Am Diet Assoc. 2006;106(10):1640-50.
DOI:10.1016/j.jada.2006.07.011
3. Fay RE. Theory and application of replicate weighting for variance calculations. In: Proceedings of the Survey Research Methods Section, 212-17. 1999. New York, United States. New York: American Statistical Association; 1989.
4. Freedman LS, Midthune D, Carroll RJ, Krebs-Smith S, Subar AF, Troiano RP, et al. Adjustments to improve the estimation of usual dietary intake distributions in the
population. J Nutr. 2004;134(7):1836-43. Erratum in: J
Nutr. 2005;135(6):1524.
5. Freedman LS, Guenther PM, Dodd KW, Krebs-Smith SM, Midthune D. The population distribution of ratios of usual intakes of dietary components that
are consumed every day can be estimated from
repeated 24-hour recalls. J Nutr. 2010;140(1):111-6.
DOI:10.3945/jn.109.110254
6. Kipnis V, Midthune D, Buckman DW, Dodd KW, Guenther PM, Krebs-Smith SM, et al. Modeling data with excess zeros and measurement error: application to evaluating relationships between episodically consumed foods and health
outcomes. Biometrics. 2009;65(4):1003-10.
DOI:10.1111/j.1541-0420.2009.01223.x
7. Korn EL, Graubard BI. Analysis of Health Surveys. New
York: JohnWiley & Sons; 1999.
8. Rao JNK, Shao J. Modifi ed balanced repeated replication for complex survey
data. Biometrika. 1999;86(2):403-15.
DOI:http://dx.doi.org/10.1093/biomet/86.2.403
9. Scagliusi FB, Ferriolli E, Pfrimer K, Laureano C, Cunha CS, Gualano B, et al. Underreporting of energy intake in Brazilian women varies according to dietary assessment: a cross-sectional study using doubly
labeled water. J Am Diet Assoc.
2008;108(12):2031-40. DOI:10.1016/j.jada.2008.09.012
10. Souverein OW, Dekkers AL, Geelen A, Haubrock J, De Vries JH, Ocké MC, et al. Comparing four methods to estimate usual intake distributions
2011. Eur J Clin Nutr. 2011;65(Supll 1):92-101.
DOI:10.1038/ejcn.2011.93
11. Subar AF, Kipnis V, Troiano RP, Midthune D, Schoeller DA, Bingham S, et al. Using intake biomarkers to evaluate the extent of dietary misreporting in a large
sample of adults: the OPEN Study. Am J Epidemiol.
2003;158(1):1-13. DOI:10.1093/aje/kwg092
12. Subar AF, Dodd KW, Guenther PM, Kipnis V, Midthune D, McDowell M, et al. The Food Propensity Questionnaire (FPQ): concept,
development and validation for use as a covariate in model to estimate usual food
intake. J Am Diet Assoc. 2006;106(10):1556-63.
DOI:10.1016/j.jada.2006.07.002
13. Tooze JA, Midthune D, Dodd KW, Freedman LS, Krebs-Smith SM, Subar AF, et al. A new statistical method for estimating the distribution of usual intake of episodically consumed
foods. J Am Diet Assoc. 2006;106(10):1575-87.
DOI:10.1016/j.jada.2006.07.003
14. Wolter KM. Introduction to Variance Estimation. New York: Springer-Verlag; 1985.
The authors declare that there are no confl icts of interest.