Lack of access and continuity
of adult health care: a national
population-based survey
Falta de acesso e de continuidade
da atenção à saúde em adultos:
inquérito nacional
I Departamento de Ciências da Saúde. Universidade Federal de Santa Maria. Palmeira das Missões, RS, Brasil II Programa de Pós-Graduação em
Epidemiologia. Universidade Federal de Pelotas. Pelotas, RS, Brasil
III Programa de Pós-Graduação em Enfermagem. Universidade Federal de Pelotas. Pelotas, RS, Brasil
IV Faculdade de Medicina. Universidade Federal de Pelotas. Pelotas, RS, Brasil V Programa de Pós-Graduação em Educação
Física. Universidade Federal de Pelotas. Pelotas, RS, Brasil
Correspondence: Alitéia Santiago Dilélio
Departamento de Medicina Social – UFPEL Av. Duque de Caxias, 250 3º andar Fragata 96030-001 Pelotas, RS, Brasil
E-mail: [email protected] Received: 4/6/2014 Approved: 9/23/2014
Article available from: www.scielo.br/rsp
ABSTRACT
OBJECTIVE:
To describe the lack of access and continuity of health care
in adults.
METHODS:
A cross-sectional population-based study was performed
on a sample of 12,402 adults aged 20 to 59 years in urban areas of
100 municipalities of 23 states in the ive Brazilian geopolitical regions.
Barriers to the access and continuity of health care and were investigated
based on receiving, needing and seeking health care (hospitalization and
accident/emergency care in the last 12 months; care provided by a doctor,
by other health professional or home care in the last three months). Based on
the results obtained by the description of the sample, a projection is provided
for adults living in Brazilian urban areas.
RESULTS: The highest prevalence of lack of access to health services and to
provision of care by health professionals was for hospitalization (3.0%), whilst
the lowest prevalence was for care provided by a doctor (1.1%). The lack of
access to care provided by other health professionals was 2.0%; to accident
and emergency services, 2.1%; and to home care, 2.9%. As for prevalences,
the greatest absolute lack of access occurred in emergency care (more
than 360,000 adults). The main reasons were structural and organizational
problems, such as unavailability of hospital beds, of health professionals, of
appointments for the type of care needed and charges made for care.
CONCLUSIONS: The universal right to health care in Brazil has not yet been
achieved. These projections can help health care management in scaling the
efforts needed to overcome this problem, such as expanding the infrastructure
of health services and the workforce.
DESCRIPTORS:
Adult. Health Services Accessibility. Continuity of
Patient Care. Health Inequalities. Equity in Health. Health Surveys.
Alitéia Santiago Dilélio
IElaine Tomasi
IIElaine Thumé
IIIDenise Silva da Silveira
IVFernando Carlos Vinholes
Siqueira
VRoberto Xavier Piccini
IVSuele Manjourany Silva
IIBruno Pereira Nunes
IIThe Brazilian Uniied Health System (SUS) is guided
by the principles of universal and equal access and aims
to provide services based on health needs.
20,21The concept of “access” is complex and multidimen
-sional, and may focus on people’s characteristics,
service supply or the relationship between people
and services.
19In this study, the concept is a synonym
of accessibility, referring to the possibility of using
health services when necessary.
18Lack of access is the
impossibility of using the service regardless of need,
expressing lack of capacity to respond or dificulty in
ensuring health care.
22The behavioural model proposed by Andersen and
Newman identiies access as one of the mediators
of health service use, and indicates four dimensions
of access: potential access, referring to contextual
factors; realized access, relating to service use; effec
-tive access, referring to the care process; and eficient
RESUMO
OBJETIVO: Descrever a falta de acesso e de continuidade da atenção à saúde
de adultos.
MÉTODOS: Estudo transversal de base populacional com 12.402 adultos entre
20 e 59 anos, residentes em áreas urbanas de 100 municípios de 23 estados
brasileiros, nas cinco regiões geopolíticas. Investigaram-se as barreiras no
acesso e na continuidade da atenção a partir do recebimento, necessidade e
busca de algum atendimento de saúde (internação hospitalar e pronto-socorro
nos 12 meses prévios ao estudo; atendimento médico, de outro proissional de
saúde e domiciliar nos três meses prévios). A partir dos resultados obtidos na
descrição da amostra, apresenta-se uma projeção para os adultos residentes em
áreas urbanas no território nacional.
RESULTADOS: A prevalência de falta de acesso aos serviços e aos atendimentos
com proissionais de saúde mais expressiva foi de 3,0%, para internação
hospitalar, enquanto a menor prevalência foi para atendimento médico (1,1%).
A falta de acesso para o atendimento com outro proissional de saúde foi de
2,0%; em pronto-socorro, 2,1%; e domiciliar, 2,9%. Quanto às prevalências,
o maior número absoluto de falta de acesso foi para atendimentos de urgência
(mais de 360.000 adultos). Os principais motivos foram problemas estruturais
e organizacionais, como falta de leito, de proissionais, de icha/vaga do tipo
de atendimento necessário e cobrança pelo atendimento.
CONCLUSÕES: O direito universal à saúde no Brasil ainda não foi alcançado.
As projeções podem apoiar a gestão no dimensionamento de esforços dirigidos
ao seu enfrentamento, como a ampliação da estrutura física dos serviços e da
força de trabalho.
DESCRITORES:
Adulto. Acesso aos Serviços de Saúde. Continuidade da
Assistência ao Paciente. Desigualdades em Saúde. Equidade em Saúde.
Inquéritos Epidemiológicos.
INTRODUCTION
access, focusing on changes in health conditions and
satisfaction as a result of the received care.
1,18The mechanisms that regulate the seeking and use of
health services need to be understood, such as health
needs which do or do not lead to services being sought;
when seeking care, demand is generated and this is
medi-ated by the existence or inexistence of the service, the
main barrier to access.
18Other barriers are geographic
distribution, the availability and quality of human and
technical resources and the health care model.
20Even when the need is felt, an individual has “freedom
of use” based on the degree of information about choices
or, in other words, an individual has a health need but
does not seek care owing to personal decisions.
18Continuity of care also deserves attention, and its
quality must be evaluated. Continuity is related to the
experiences and relationship of a patient with a clini
-cian, as well as coordinated clinical care as the patient
moves between different parts of the health service.
11Adequate diagnosis and treatment procedures culmi
-nating in user satisfaction would be the desired course
for all health care.
7,14The individual’s lack of access to irst contact or the lack
of continuity of care can be considered indicators of the
quality of health services by identifying inadequacies
as: shortage of professionals, setting and ixed days for
performing programmatic actions shifts.
Despite the importance of barriers to access to health
services and to continuity of care regarding public
health and impact on health indicators, studies in this
area are incipient. This study aimed to describe lack
of access and lack of health care continuity for adults.
METHODS
This study was part of a survey that investigated the
access and quality of health services in Brazil. This was
a cross-sectional population-based study performed
on a sample of 12,402 adults with ages from 20 to 59
years, resident in urban areas of 100 cities in 23 states
in the ive Brazilian geopolitical regions.
9The sample size was estimated
a posteriori
based on
prevalence rates. The largest sample required had 9,151
subjects, assuming: 0.7% prevalence of lack of access,
accuracy of 0.2 pp, and a design effect of 1.2, including
15.0% for losses and refusals. It described the charac
-teristics of continuous care.
The sample representing the adult urban population
was located by a multiple level sampling process
9,17that considered population size, census tracts and
households. Municipalities were aggregated according
to population size and selected systematically. Census
tracts were allocated randomly according to the
proportion of valid sectors and population size, using
the oficial grid of the 2000 Population Census.
aTen
households were visited in each of the 638 sectors
selected, “jumping” systematically 30 households
from one residence to the next with the aim of inding
17 adults per sector.
All adults resident in the households were eligible
to be interviewed. The 55 selected and trained inter
-viewers collected the data using a hand-held device
(PDA – personal digital assistant) in 2009. The data
was stored on portable computers and transferred to
the study headquarters via Internet.
The questionnaire was standardized and pre-tested. It
contained socioeconomic and demographic variables
as well as variables regarding both public and private
health service use.
The respondents were asked if they had received some
form of health care recently (hospital admission and
accident/emergency care in the last 12 months; care
provided by a doctor, other health professional or domi
-ciliary care in the last three months) in order to inves
-tigate lack of access. If no, they were asked whether
they had needed it, despite not having had care (yes/no).
The sequence of questions asked about care provided
by a doctor can be exempliied as follows: “
In the
<last
three months
>, have you been seen by a doctor?
” If
no: “
Despite not having been seen by a doctor, did you
need to be seen by one?
” If needed: “
Have you sought
the care of a doctor in the
<last three months>
?
” If the
care of a doctor was sought: “
Why were you not seen
by a doctor?
”. The questions for investigating the other
forms of care provision followed the same pattern.
Care provided by other health professional referred to
top-level professionals, including dentists, psycholo
-gists, physiotherapists, dieticians, physical education
teachers, speech therapists, social workers and nurses.
The reason for not receiving care and the outcome
of the problem were investigated to describe barriers
to access. With regard to care provided by a doctor,
another health professional or domiciliary care, the
respondents were asked whether they had sought care
and the reason why they had not sought care. The reason
why care was needed was also considered when it was
provided by a doctor or domiciliary care.
In order to characterize barriers to care continuity,
the respondents were asked about: all forms of care
provided, the outcome of the problem after receiving
care, whether they had received any explanation about
the reason for care being provided, whether they were
referred for a follow-up appointment, whether the
follow-up appointment took place and the reason why
they did not have their follow-up appointment. They
were also asked whether they were referred to another
service, whether any of these referrals did not take
place and the reason why they did not have the care to
which they had been referred regarding care provided
by a doctor, another health professional or
domicil-iary care. Exclusively in relation to care provided by a
doctor, respondents were asked whether any tests had
been requested and the reason for not having them. The
term “continuity of care” was used instead of
“manage-ment continuity”, since part of the visits may refer to
a continuum of care throughout life, and part may be
related to speciic problems.
10,11The descriptive variables were gender (male/female),
self-reported skin color (white; black; other – mixed,
Asian and indigenous categories), age in years (20 to 29;
30 to 39; 40 to 49; 50 to 59), education in years (none; one
to four; ive to eight; nine to 11; 12 or more), economic
classiication as per Brazilian Association of Research
Companies (ABEP)
b(A and B; C; D and E),
per capita
income in minimum wages (
≤
0.3; 0.4 to < 1; 1.0 and
more), morbidity diagnosed medically (hypertension;
diabetes mellitus; nerve problems – yes/no), geopolitical
region (MW/N/NE/SE/S) and municipality population
size (
≤
30,000; 30,001 to 100,000; 100,001 to 1,000,000;
> 1,000,000 inhabitants).
For the purposes of quality control, 5.0% of the inter
-views were selected randomly to be repeated within
three days at most, following the first interview.
Hospitalization in the last year and a medical refer
-ence hypertension resulted kappa index of 0.77 and
0.73, respectively.
Based on the results obtained by the sample, a projec
-tion was provided for the reference popula-tion, i.e.
adults in urban areas throughout Brazil, based on a total
of 92,168,985 inhabitants.
cAnalysis was performed using the Stata 12.1 statis
-tics package.
This study was approved by the Research Ethics
Committee of the Faculdade de Medicina of
Universidade Federal de Pelotas (Process 152/07). All
respondents signed an informed consent form.
RESULTS
A total of 13,756 adults were identiied. Losses and
refusals accounted for 9.8%, resulting in 12,402 indi
-viduals included in the study; 55.1% were women and
39.7% self-reported white skin colour. Average age was
37.4 years (SD = 11.5 years) and 31.8% were aged 20
to 29 years.
Approximately 1/3 of the individuals had between nine
and 11 years of schooling. Most individuals fell into
economic classiication C (51.5%) and 42.0% had
per
capita
income > 1 minimum wage. A quarter of the
respondents reported medical diagnosis of at least one
chronic disease. The highest number of respondents
lived in the Southeast (35.4%), in cities with between
100,001 and 1,000,000 inhabitants (39.9%).
About 3.0% were not admitted and did not even have
access to hospitalization (223,324 adult Brazilians),
among those who self-reported need to be admitted
to a hospital. The majority needed to be admitted to
a hospital for an emergency surgery (30.0%) or to
undergo examinations (20.0%); 40.0% did not admit
themselves to a hospital because they thought they did
not need to; and 20.0% reported that the outcome of
their health problem was worsened (Table 1).
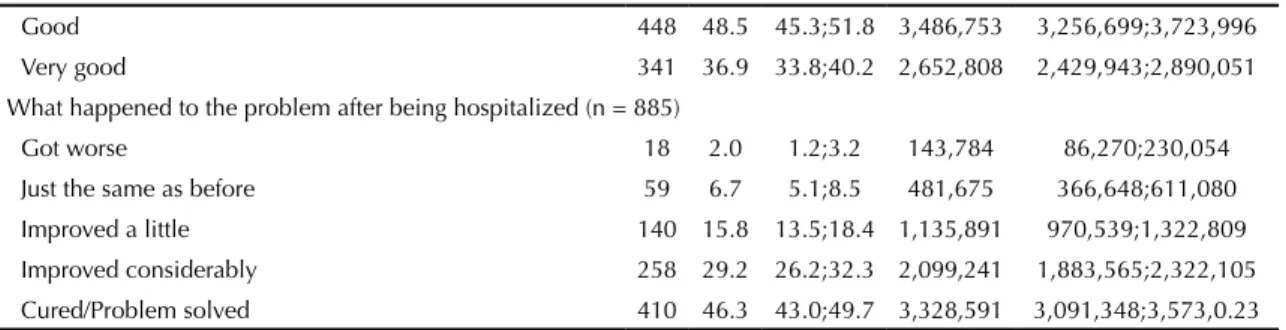
Of those adults who were admitted to a hospital, 42.9%
were discharged without being referred for a follow-up
appointment and 20.6% of those who were referred
did not actually have the appointment (4.7% for difi
-culties within the health service: 1.9% – no appoint
-ments available; 0.9% – no doctor available onsite;
1.9% – lack of SUS doctors) (Table 1).
Of individuals seeking accident/emergency care, 2.1%
(360,186 people)
did not receive it. Almost half (49.0%)
gave up waiting to be seen since it took too long and
the problem causing them to seek care had got worse
in 16.3% of cases (Table 2).
The majority (85.1%) provided with accident/emer
-gency care were discharged without being referred for
a follow-up appointment and 28.4% of those who were
referred did not attend it. Lack of access to follow-up
appointments owing to dificulties within the health
service (no appointments available (1.1%); no doctor
available onsite (5.5%); lack of SUS doctor (2.2%))
accounted for 8.8% (Table 2).
Out of all respondents who sought care provided by
a doctor, 1.1% did not receive care (n = 49): 353,867
Brazilian adults were estimated not to have had access.
The main reason for needing to be seen by a doctor, even
though they were not seen, was “because I thought I
needed to, I was feeling ill” (80.8%). Reasons relating
to health promotion and prevention were reported by
53.9% of the sample: health problem follow-up/moni
-toring (29.9%), check-up (17.4%), pre-cancerous
conditions (4.1%), prostate examination (1.5%) and
antenatal appointment (1.0%). Around 70.7% of indi
-viduals who reported needing care actually sought it.
The main reasons for this were the absence of a doctor
(42.6%) and unavailability of appointments (40.4%).
When asked why they had not sought care provided by
a doctor, 53.4% stated dificulty in getting an appoint
-ment on SUS and 9.3% the lack of a doctor. The
majority (50.3%) considered that their health problem
b Associação Brasileira de Empresas de Pesquisa (ABEP). Critérios de classificação econômica Brasil. São Paulo (SP); 2003 [cited 2014 jan 21]. Available from: http://www.abep.org
Table 1. Description of barriers to access and continued care based on the indicated need for hospital admission among adults. Brazil, 2009.
Variable (n) Sample
Projection for the urban population (20 to 59 years)b 92,168,985
na % 95%CI n 95%CI
Hospitalized (n = 12,365) 961 7.8 7.3; 8.3 7,189,181 6,728,335;7,757,856
Despite not being hospitalized, a doctor had indicated
hospitalization (n = 11,404) 30 0.3
Barriers to access
Lack of access to hospitalization (n = 991)c 30 3.0 2.0;4.3 223,324 148,882;320,097 Reason for needing to be hospitalized (n = 30)
Emergency surgery/Operation 9 300 14.7;49.4 76,482 37,476;125,940
Non-emergency surgery/Operation 2 6.7 8.2;22.1 17,081 20,905;56,342
Clinical treatment 7 23.3 9.9;42.3 59,401 25,239;107,839
To have tests/Examinations 6 20.0 7.7;38.6 50,988 19,630;98,407
Other 6 20.0 7.7;38.6 50,988 19,630;98,407
Reason for not being hospitalized (n = 30)
Thought they did not need it 12 40.0 22.7;59.4 101,976 57,871;151,434
No hospital bed available 6 20.0 7.7;38.6 50,988 19,630;98,407
Family or work commitments 5 16.7 5.6;34.7 42,575 14,277;88,464
Afraid 4 13.3 3.7;30.7 33,907 9,433;78,266
Unable to pay 3 10.0 2.1;26.5 25,494 5,354;67,559
No transport available 1 3.3 0.08;17.2 8,413 204;43,850
Other 6 20.0 7.7;38.6 50,988 9,630;98,407
Health problem outcome after not being hospitalized (n = 30)
Got worse 6 20.0 7.7;38.6 50,988 19,630;98,407
Just the same as before 12 40.0 22.7;59.4 101,976 57,871;151,434
Improved a little – – –
Improved considerably 4 13.3 3.7;30.7 33,907 9,433;78,266
Cured/Problem solved 8 26.7 12.3;45.9 68,069 31,358;117,017
Barriers to continuity of care Did not receive explanation as to the reason for being
hospitalized (n = 915) 799 87.3 85.0;89.4 6,276,155 6,110,804;6,427,128
Discharged from hospital without being referred to a follow-up appointment (n = 935)
401 42.9 39.7;46.1 3,084,159 2,854,105;3,314,212
Did not have the follow-up appointment (n = 534) 110 20.6 17.2;24.3 845,635 706,064;997,520 Reason why did not have follow-up appointment (n = 108)
Date of the appointment not reached yet 59 54.6 44.7;64.2 461,716 377,999;542,897 Did not attempt to make an appointment 33 30.6 22.1;40.2 258,764 186,885;339,945
Unable to go and make the appointment 3 2.8 0.6;7.9 23,678 5,074;66,805
Attempted to make an appointment. but none available 2 1.9 0.2;6.5 16,067 1,691;54,966 No doctor available on SUS and unable to pay for a
private doctor
2 1.9 0.2;6.5 16,067 1,691;54,966
Attempted to make an appointment, but no doctor
available at that service 1 0.9 0.02;5.0 7,611 169;42,282
Other 8 7.4 3.3;14.1 62,577 27,906;119,234
Opinion about care received (n = 923)
Very bad 43 4.7 3.4;6.2 337,891 244,432;445,729
Poor 12 1.3 0.7;2.3 93,459 5,032;165,351
Regular 79 8.6 6.8;10.6 618,270 488,864;762,053
Continuation
Good 448 48.5 45.3;51.8 3,486,753 3,256,699;3,723,996
Very good 341 36.9 33.8;40.2 2,652,808 2,429,943;2,890,051
What happened to the problem after being hospitalized (n = 885)
Got worse 18 2.0 1.2;3.2 143,784 86,270;230,054
Just the same as before 59 6.7 5.1;8.5 481,675 366,648;611,080
Improved a little 140 15.8 13.5;18.4 1,135,891 970,539;1,322,809
Improved considerably 258 29.2 26.2;32.3 2,099,241 1,883,565;2,322,105
Cured/Problem solved 410 46.3 43.0;49.7 3,328,591 3,091,348;3,573,0.23
SUS: Brazilian Unified Health System
a Information is partially unknown for some variables. Differing values may therefore appear. b Instituto Brasileiro de Geografia e Estatística, Censo Demográfico, 2010.
c The denominator refers to the total of individuals who were hospitalized plus individuals who reported having medical indication for hospitalization but did not have access to it.
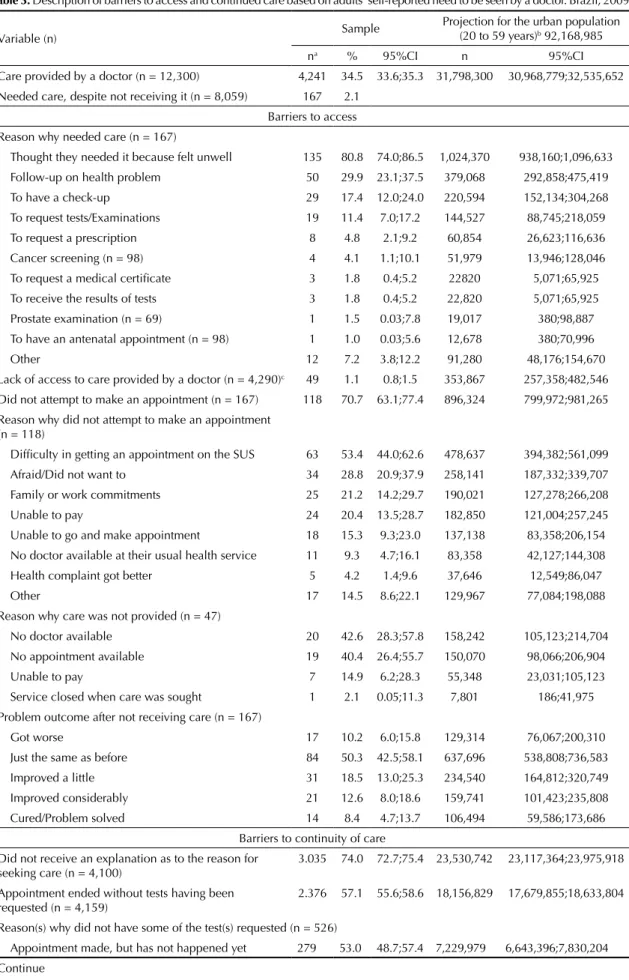
Table 2. Description of barriers to access and continued care based on adults’ self-reported need for accident and emergency care. Brazil, 2009.
Variable (n) Sample
Projection for the urban population (20 to 59 years)b 92,168,985
na % 95%CI n 95%CI
Accident and Emergency Care (n = 12,302) 2,243 18.2 17.6;18.9 16,774,755 16,221,741;17,419,938 Needed care, despite not receiving it (n = 10,059) 49 0.5
Barriers to access
Lack of access to accident and emergency care (n = 2,292)c 49 2.1 1.6;2.8 360,186 274,428;480,248 Reason why care was not provided (n = 49)
Waiting time too long, gave up 24 49.0 34.4;63.7 184716 129,678;240,131
Too many people waiting 18 36.7 23.4;51.7 138,348 88,211;194,894
Specialist not available 12 24.5 13.3;38.9 92,358 50,137;146,642
Service refused to provide care 8 16.3 7.3;29.7 61,446 27,519;111,960
No transport available 2 4.1 0.5;14.0 15,456 188;52,776
Other 10 20.0 10.2;34.3 75,394 38,451;129,301
Problem outcome after not receiving care (n = 49)
Got worse 8 16.3 7.3;29.7 61,446 27,519;111,960
Just the same as before 15 30.6 18.3;45.4 115,353 68,986;171,145
Improved a little 14 28.6 16.6;43.3 107,814 62,577;163,229
Improved considerably 7 14.3 5.9;27.2 53,907 22,241;102,536
Cured/Problem solved 5 10.2 3.4;22.2 38,451 12,817;83,688
Barriers to continuity of care Did not receive an explanation as to the reason for seeking
care (n = 2,126) 1.415 66.6 64.5;68.6 11,171,987 10,819,717;11,507,482
Discharged from the accident and emergency unit without being referred to a follow-up appointment (n = 2,178)
1.854 85.1 83.6;86.6 14,275,317 14,023,695;14,526,938
Did not have the follow-up appointment (n = 324) 92 28.4 23.6;33.6 709,841 589,867;839,811 Reason why did not have the follow-up appointment (n = 91)
Did not attempt to make an appointment 33 36.3 26.4;47.0 257,672 187,398;333,625 Date of the appointment not reached yet 29 31.9 22.5;42.5 226,439 159,714;301,682 Attempted to make an appointment, but no doctor
available at that service 5 5.5 1.8;12.4 39,041 12,777;88,020
Unable to go and make the appointment 3 3.3 0.7;9.3 23,425 4,969;66,015
continued just the same after having been seen by the
doctor (Table 3).
More than half the adults (57.1%) left the appointment
without being referred for tests after being seen by a
doctor, 16.4% did not have any tests performed because
they were not able to on the SUS or because they were
not available in their city (4.4%). Many (92.9%) left the
appointment without being referred to care at another
service (Table 3).
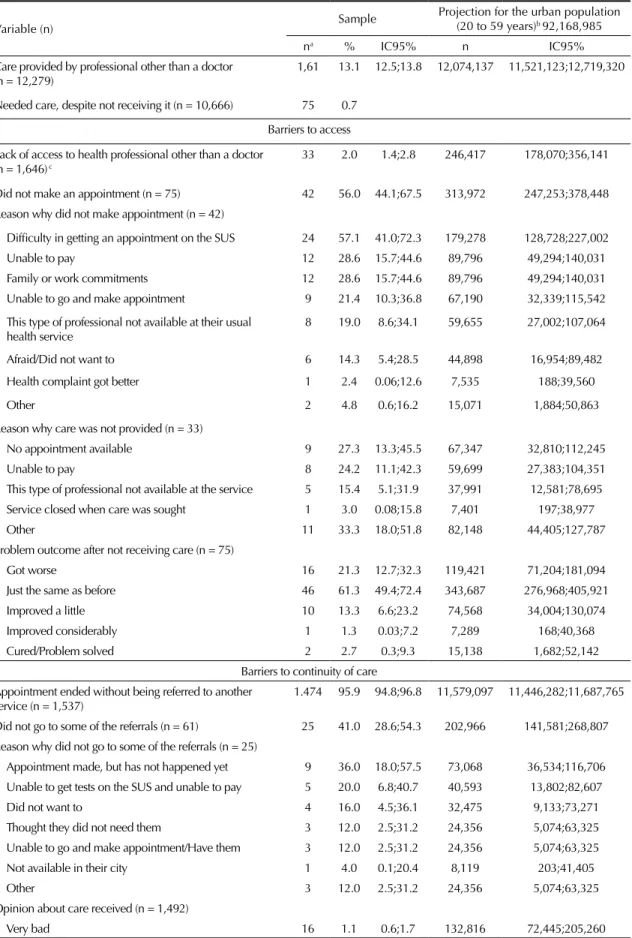
Of the respondents, 2.0% stated that although they
had not received care provided by a health profes
-sional other than a doctor, they needed it (representing
246,417 adults). More than half (56.0%) reported not
having sought care, especially for the dificulty in
getting an appointment on SUS (57.1%). The main
reasons why adults did not receive care were the lack
of appointments (27.3%) and users being unable to
pay for services (24.2%). The majority (61.3%) stated
that their health problem remained unaltered (Table 4).
Most individuals (95.9%) who received care were not
referred to other services. Around 41.0% of those who
were referred did not receive the care to which they had
been referred either because they were not able to get
this care on SUS
(20.0%) or because it was not avail
-able in their city (4.0%) (T-able 4).
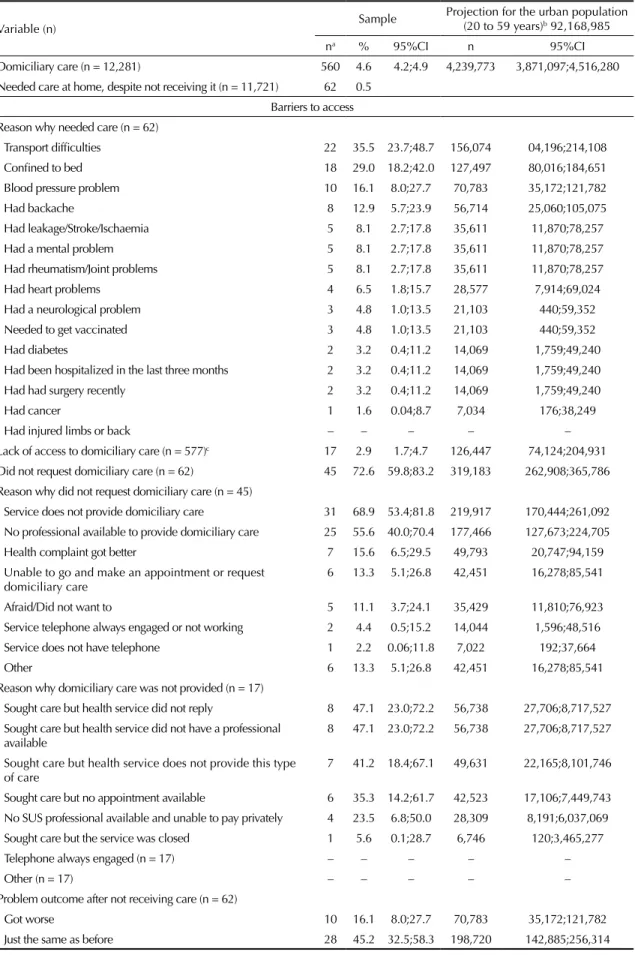
Lack of access to domiciliary care was reported by
2.9% of the adults (representing 126,447 individ
-uals). Transport dificulties (35.5%), being conined
to bed (29.0%), blood pressure problems (16.1%) and
backache (12.9%) were the most reported reasons for
needing to receive domiciliary care. Approximately
3/4 reported not having requested domiciliary care. The
majority (47.1%) did not receive care because, even
though they sought it, no response was provided by the
health service, the health service had no professional
available to provide the care (47.1%), or the health
service did not provide this kind of care (41.2%). The
most mentioned reasons for not seeking domiciliary
care were because the health service did not provide this
kind of service (68.9%) and there was no professional
available to provide it (5.6%). The majority (45.2%)
stated that their condition remained the same as before
seeking care (Table 5).
Around 93.6% of those who did receive domiciliary
health care were not referred to other services, and
11.4% of those who were referred did not reach these
other services because they were unable to schedule an
appointment (25.0%) (Table 5).
DISCUSSION
The prevalence of lack of access to services and provi
-sion of care by health profes-sionals was relatively low
and showed little variation. Lack of access was more
prevalent (3.0%) for individuals who reported needing
hospitalization, whilst individuals who reported
needing provision of care by a doctor presented the
lowest prevalence (1.1%). The prevalence of lack of
Continuation
No doctor available on SUS and unable to pay for a private doctor
2 2.2 0.3;7.7 15,616 2,130;54,658
Attempted to make an appointment, but none available 1 1.1 0.03;6.0 7,808 213;42,590
Other 18 19.8 12.2;29.5 140,548 86,601;209,403
Opinion about care received (n = 2,083)
Very bad 183 8.8 7.6;10.1 1,476,178 1,274,881;1,694,250
Poor 99 4.8 3.9;5.8 805,188 654,215;972,936
Regular 352 16.9 15.3;18.6 2,834,934 2,566,538;3,120,104
Good 1.105 53.0 50.9;55.2 8,890,620 8,538,350;9,259,665
Very good 344 16.5 14.9;18.2 2,767,835 2,415,656;3,053,005
Problem outcome after care was provided (n = 2,158)
Got worse 48 2.2 1.6;2.9 369,045 268,396;486,468
Just the same as before 341 15.8 14.3;17.4 2,650,411 2,398,790;2,918,807
Improved a little 584 27.1 25.2;29.0 4,545,959 4,227,238;4,864,679
Improved considerably 669 31.0 29.1;33.0 5,200,174 4,881,454;5,535,669
Cured/Problem solved 516 23.9 22.1;25.8 4,009,167 3,707,221;4,327,887
SUS: Brazilian Unified Health System
a Information is partially unknown for some variables. Differing values may therefore appear. b Instituto Brasileiro de Geografia e Estatística, Censo Demográfico, 2010.
Table 3. Description of barriers to access and continued care based on adults’ self-reported need to be seen by a doctor. Brazil, 2009.
Variable (n) Sample
Projection for the urban population (20 to 59 years)b 92,168,985
na % 95%CI n 95%CI
Care provided by a doctor (n = 12,300) 4,241 34.5 33.6;35.3 31,798,300 30,968,779;32,535,652 Needed care, despite not receiving it (n = 8,059) 167 2.1
Barriers to access Reason why needed care (n = 167)
Thought they needed it because felt unwell 135 80.8 74.0;86.5 1,024,370 938,160;1,096,633
Follow-up on health problem 50 29.9 23.1;37.5 379,068 292,858;475,419
To have a check-up 29 17.4 12.0;24.0 220,594 152,134;304,268
To request tests/Examinations 19 11.4 7.0;17.2 144,527 88,745;218,059
To request a prescription 8 4.8 2.1;9.2 60,854 26,623;116,636
Cancer screening (n = 98) 4 4.1 1.1;10.1 51,979 13,946;128,046
To request a medical certificate 3 1.8 0.4;5.2 22820 5,071;65,925
To receive the results of tests 3 1.8 0.4;5.2 22,820 5,071;65,925
Prostate examination (n = 69) 1 1.5 0.03;7.8 19,017 380;98,887
To have an antenatal appointment (n = 98) 1 1.0 0.03;5.6 12,678 380;70,996
Other 12 7.2 3.8;12.2 91,280 48,176;154,670
Lack of access to care provided by a doctor (n = 4,290)c 49 1.1 0.8;1.5 353,867 257,358;482,546 Did not attempt to make an appointment (n = 167) 118 70.7 63.1;77.4 896,324 799,972;981,265 Reason why did not attempt to make an appointment
(n = 118)
Difficulty in getting an appointment on the SUS 63 53.4 44.0;62.6 478,637 394,382;561,099
Afraid/Did not want to 34 28.8 20.9;37.9 258,141 187,332;339,707
Family or work commitments 25 21.2 14.2;29.7 190,021 127,278;266,208
Unable to pay 24 20.4 13.5;28.7 182,850 121,004;257,245
Unable to go and make appointment 18 15.3 9.3;23.0 137,138 83,358;206,154
No doctor available at their usual health service 11 9.3 4.7;16.1 83,358 42,127;144,308
Health complaint got better 5 4.2 1.4;9.6 37,646 12,549;86,047
Other 17 14.5 8.6;22.1 129,967 77,084;198,088
Reason why care was not provided (n = 47)
No doctor available 20 42.6 28.3;57.8 158,242 105,123;214,704
No appointment available 19 40.4 26.4;55.7 150,070 98,066;206,904
Unable to pay 7 14.9 6.2;28.3 55,348 23,031;105,123
Service closed when care was sought 1 2.1 0.05;11.3 7,801 186;41,975
Problem outcome after not receiving care (n = 167)
Got worse 17 10.2 6.0;15.8 129,314 76,067;200,310
Just the same as before 84 50.3 42.5;58.1 637,696 538,808;736,583
Improved a little 31 18.5 13.0;25.3 234,540 164,812;320,749
Improved considerably 21 12.6 8.0;18.6 159,741 101,423;235,808
Cured/Problem solved 14 8.4 4.7;13.7 106,494 59,586;173,686
Barriers to continuity of care Did not receive an explanation as to the reason for
seeking care (n = 4,100)
3.035 74.0 72.7;75.4 23,530,742 23,117,364;23,975,918
Appointment ended without tests having been
requested (n = 4,159) 2.376 57.1 55.6;58.6 18,156,829 17,679,855;18,633,804
Reason(s) why did not have some of the test(s) requested (n = 526)
access to care provided by a health professional other
than a doctor, lack of access to accident/emergency care
and lack of access to domiciliary care was 2.0%, 2.1%
and 2.9%, respectively.
Data from the 2003 National Household Sample Survey
(PNAD) shows that the prevalence of lack of access
among adults aged 20 to 64 years who sought health
services in the last two weeks was of 2.2%. The 2008
PNAD
found 2.8% for this same item.
d,eThe preva
-lence rates of this study are similar to those found in
PNAD, even though the PNAD respondents’ recollec
-tion period was shorter, their age range was greater
and more subjects were interviewed than in this study.
A study conducted in the city of Pelotas, Southern
Brazil, found a 6.5% prevalence rate of lack of access
to a health service in the last month in a sample of adults
Continuation
Unable to get tests on the SUS and unable to pay 86 16.4 13.4;19.8 2,237,201 1,827,957;2,701,011 Unable to go and make appointment/Have tests 53 10.1 7.6;13.0 1,377,789 1,036,752;1,773,391
Did not want to 41 7.8 5.7;10.4 1,064,035 777,564;1,418,713
Not available in their city 23 4.4 2.8;6.5 600,225 381,961;886,696
Thought they did not need them 22 4.2 2.6;6.3 572,942 354,678;859,413
Other 82 15.6 12.6;19.0 2,128,069 1,718,825;2,591,879
Appointment ended without being referred to another service (n = 4,178)
3.881 92.9 92.1;93.7 29,540,621 29,286,234;29,795,007
Did not go to some of the referrals (n = 294) 100 34.0 28.6;39.7 767,611 645,696,276;896,298,677 Reason why did not go to some of the referrals (n = 100)
Appointment made, but has not happened yet 45 45.0 35.0;55.3 345,425 268,664;24,489 Unable to go and make appointment/Have them 12 12.0 6.4;20.0 92,113 49,127;153,522
Unable to get tests on the SUS and unable to pay 11 11.0 5.6;18.8 84,437 42,986;144,311
Did not want to 9 9.0 4.2;16.4 69,085 32,240;125,888
Thought they did not need them 4 4.0 1.1;9.9 30,704 8,444;75,993
Not available in their city 3 3.0 0.6;8.5 23,028 4,606;65,247
Other 22 22.0 14.3;31.4 168,874 109,768;241,030
Opinion about care received (n = 4,027)
Very bad 107 2.7 2.2;3.2 858,554 699,563;1,017,546
Poor 61 1.5 1.2;1.9 476,974 381,580;604,168
Regular 313 7.8 7.0;8.6 2,480,267 2,225,881;2,734,654
Good 2.169 53.8 52.3;55.4 17,107,485 16,630,511;17,616,258
Very good 1.377 34.2 32.7;35.7 10,875,019 10,398,044;11,351,993
Problem outcome after care was provided (n = 4,000)
Got worse 41 1.0 0.7;1.4 317,983 222,588;445,176
Just the same as before 1.293 32.3 30.9;33.8 10,270,851 9,825,675;10,747,825
Improved a little 848 21.2 19.9;22.5 6,741,240 6,327,862;7,154,617
Improved considerably 1.046 26.2 24.8;27.5 8,331,155 7,885,978;8,744,532
Cured/Problem solved 772 19.3 18.1;20.6 6,137,072 5,755,492;6,550,450
SUS: Brazilian Unified Health System
a Information is partially unknown for some variables. Differing values may therefore appear. b Instituto Brasileiro de Geografia e Estatística, Censo Demográfico, 2010.
c The denominator refers to the total of individuals who had care provided by a doctor plus individuals who sought this type of care but did not have access to it.
Table 4. Description of barriers to access and continued care based on adults’ self-reported need to have care provided by a health professional other than a doctor. Brazil, 2009.
Variable (n) Sample
Projection for the urban population (20 to 59 years)b 92,168,985
na % IC95% n IC95%
Care provided by professional other than a doctor
(n = 12,279) 1,61 13.1 12.5;13.8 12,074,137 11,521,123;12,719,320
Needed care, despite not receiving it (n = 10,666) 75 0.7
Barriers to access
Lack of access to health professional other than a doctor (n = 1,646) c
33 2.0 1.4;2.8 246,417 178,070;356,141
Did not make an appointment (n = 75) 42 56.0 44.1;67.5 313,972 247,253;378,448 Reason why did not make appointment (n = 42)
Difficulty in getting an appointment on the SUS 24 57.1 41.0;72.3 179,278 128,728;227,002
Unable to pay 12 28.6 15.7;44.6 89,796 49,294;140,031
Family or work commitments 12 28.6 15.7;44.6 89,796 49,294;140,031
Unable to go and make appointment 9 21.4 10.3;36.8 67,190 32,339;115,542
This type of professional not available at their usual
health service 8 19.0 8.6;34.1 59,655 27,002;107,064
Afraid/Did not want to 6 14.3 5.4;28.5 44,898 16,954;89,482
Health complaint got better 1 2.4 0.06;12.6 7,535 188;39,560
Other 2 4.8 0.6;16.2 15,071 1,884;50,863
Reason why care was not provided (n = 33)
No appointment available 9 27.3 13.3;45.5 67,347 32,810;112,245
Unable to pay 8 24.2 11.1;42.3 59,699 27,383;104,351
This type of professional not available at the service 5 15.4 5.1;31.9 37,991 12,581;78,695
Service closed when care was sought 1 3.0 0.08;15.8 7,401 197;38,977
Other 11 33.3 18.0;51.8 82,148 44,405;127,787
Problem outcome after not receiving care (n = 75)
Got worse 16 21.3 12.7;32.3 119,421 71,204;181,094
Just the same as before 46 61.3 49.4;72.4 343,687 276,968;405,921
Improved a little 10 13.3 6.6;23.2 74,568 34,004;130,074
Improved considerably 1 1.3 0.03;7.2 7,289 168;40,368
Cured/Problem solved 2 2.7 0.3;9.3 15,138 1,682;52,142
Barriers to continuity of care Appointment ended without being referred to another
service (n = 1,537)
1.474 95.9 94.8;96.8 11,579,097 11,446,282;11,687,765
Did not go to some of the referrals (n = 61) 25 41.0 28.6;54.3 202,966 141,581;268,807 Reason why did not go to some of the referrals (n = 25)
Appointment made, but has not happened yet 9 36.0 18.0;57.5 73,068 36,534;116,706 Unable to get tests on the SUS and unable to pay 5 20.0 6.8;40.7 40,593 13,802;82,607
Did not want to 4 16.0 4.5;36.1 32,475 9,133;73,271
Thought they did not need them 3 12.0 2.5;31.2 24,356 5,074;63,325
Unable to go and make appointment/Have them 3 12.0 2.5;31.2 24,356 5,074;63,325
Not available in their city 1 4.0 0.1;20.4 8,119 203;41,405
Other 3 12.0 2.5;31.2 24,356 5,074;63,325
Opinion about care received (n = 1,492)
Very bad 16 1.1 0.6;1.7 132,816 72,445;205,260
aged 20 or more. The inclusion of older adults may
have led to the higher percentage found by that study.
fDespite being low, the prevalence rates found in this
study reach another dimension when they are extrapo
-lated to include all adults living in urban areas in Brazil.
Access to a doctor, for example, is estimated to be lacking
for more than 350,000 public and private health service
users and 360,000 adults are estimated to be without
access to emergency care. This is worsened by the service
being mainly public. These projections are expected to
be useful in supporting health management to calculate
the efforts needed to address it, such as scaling up the
physical structure of the services and the workforce.
Similarity was found among the reasons for seeking
care by both those who did and those who did not
manage to access services, with regard to hospitaliza
-tion, care provided by a doctor and domiciliary care
(data not presented). Different from the 2003 PNAD,
which found preventive actions to be the main reason
for health care provision, our study identiied surgical
operations and illnesses in general as being the main
reasons for needing to be admitted to a hospital or
needing to receive health care, like the 2008 PNAD.
eThe main reason for lack of access by those seeking
health care was structural and organizational problems:
lack of hospital beds, charges for services, having to
wait a long time to be seen, lack of health professionals,
lack of appointments availability and lack of the kind of
care needed. Similar aspects were found by the PNAD
and by the study conducted in Pelotas, RS, in particular
charges for services, unavailability of appointments
and lack of doctors.
ff Nunes BP. Acesso aos serviços de saúde em adolescentes e adultos na cidade de Pelotas - RS [dissertation]. Pelotas (RS): Universidade Federal de Pelotas, Departamento de Medicina Social; 2012.
g Instituto Brasileiro de Geografia e Estatística. Pesquisa Nacional por Amostra de Domicílios - PNAD: acesso e utilização dos serviços de saúde 2003. Rio de Janeiro (RJ); 2005 [cited 2014 Dec 8]. Available from: http://www.spm.gov.br/arquivos-diversos/.arquivos/integra_saude_ibge_2003
Continuation
Poor 14 1.0 0.5;1.6 120,741 60,371;193,186
Regular 65 4.3 3.4;5.5 519,188 410,521;664,078
Good 758 50.8 48.2;53.4 6,133,662 5,819,734;6,447,589
Very good 639 42.8 40.3;45.4 5,167,731 4,865,877;5,481,658
Problem outcome after care was provided (n = 1,466)
Got worse 13 0.9 0.5;1.5 108,667 60,371;181.112
Just the same as before 271 18.5 16.5;28.6 2,233,715 1,992,233;3,453,203
Improved a little 234 16.0 14.1;17.9 1,931,862 1,702,453;2,161,271
Improved considerably 500 34.1 31.7;36.6 4,117,281 3,827,501;4,419,134
Cured/Problem solved 448 30.5 28.2;33.0 3,682,612 3,404,907;3,984,465
SUS: Brazilian Unified Health System
a Information is partially unknown for some variables. Differing values may therefore appear. b Instituto Brasileiro de Geografia e Estatística. Censo Demográfico, 2010.
c The denominator refers to the total of individuals who received care from a health professional other than a doctor plus individuals who sought this type of care but did not have access to it.
Dificulty in getting an appointment on SUS, inancial
and personal problems and unavailability of services
were the reasons for not seeking domiciliary care
(72.6%), care provided by a doctor (70.7%) and care
provided by other health professionals (56.0%). Lack of
access can precede health care seeking, whereby service
users identify barriers beforehand. A similar
charac-teristic can be seen in barriers for having tests done.
The 2003 PNAD found that the main barriers to access
were inancial (23.8%) and long waiting times (18.1%).
gFinancial and structural problems continue to be
signif-icant obstacles to accessing health services. Service
users can think it is so unlikely for them to get an
appointment at their health centre within a short space
of time that the majority do not even try to get one.
5Geographical, inancial, organizational, information and
cultural barriers to access are an expression of the char
-acteristics of supply that can facilitate or impede people’s
ability to use services. Travassos & Castro
20highlight the
most important barrier as being the unavailability or phys
-ical absence of services and human resources. However,
information about such availability, the illness in question
and treatment options are also important in facilitating the
use of health services, as these factors have an impact on
people’s perception of health. Individual perception can
also affect use of services, as both the quest for and use
of them can be triggered by perceived need.
18Table 5. Description of barriers to access and continued care based on adults’ self-reported need for domiciliary care. Brazil, 2009.
Variable (n) Sample
Projection for the urban population (20 to 59 years)b 92,168,985
na % 95%CI n 95%CI
Domiciliary care (n = 12,281) 560 4.6 4.2;4.9 4,239,773 3,871,097;4,516,280
Needed care at home, despite not receiving it (n = 11,721) 62 0.5 Barriers to access Reason why needed care (n = 62)
Transport difficulties 22 35.5 23.7;48.7 156,074 04,196;214,108
Confined to bed 18 29.0 18.2;42.0 127,497 80,016;184,651
Blood pressure problem 10 16.1 8.0;27.7 70,783 35,172;121,782
Had backache 8 12.9 5.7;23.9 56,714 25,060;105,075
Had leakage/Stroke/Ischaemia 5 8.1 2.7;17.8 35,611 11,870;78,257
Had a mental problem 5 8.1 2.7;17.8 35,611 11,870;78,257
Had rheumatism/Joint problems 5 8.1 2.7;17.8 35,611 11,870;78,257
Had heart problems 4 6.5 1.8;15.7 28,577 7,914;69,024
Had a neurological problem 3 4.8 1.0;13.5 21,103 440;59,352
Needed to get vaccinated 3 4.8 1.0;13.5 21,103 440;59,352
Had diabetes 2 3.2 0.4;11.2 14,069 1,759;49,240
Had been hospitalized in the last three months 2 3.2 0.4;11.2 14,069 1,759;49,240
Had had surgery recently 2 3.2 0.4;11.2 14,069 1,759;49,240
Had cancer 1 1.6 0.04;8.7 7,034 176;38,249
Had injured limbs or back – – – – –
Lack of access to domiciliary care (n = 577)c 17 2.9 1.7;4.7 126,447 74,124;204,931 Did not request domiciliary care (n = 62) 45 72.6 59.8;83.2 319,183 262,908;365,786 Reason why did not request domiciliary care (n = 45)
Service does not provide domiciliary care 31 68.9 53.4;81.8 219,917 170,444;261,092 No professional available to provide domiciliary care 25 55.6 40.0;70.4 177,466 127,673;224,705
Health complaint got better 7 15.6 6.5;29.5 49,793 20,747;94,159
Unable to go and make an appointment or request
domiciliary care 6 13.3 5.1;26.8 42,451 16,278;85,541
Afraid/Did not want to 5 11.1 3.7;24.1 35,429 11,810;76,923
Service telephone always engaged or not working 2 4.4 0.5;15.2 14,044 1,596;48,516
Service does not have telephone 1 2.2 0.06;11.8 7,022 192;37,664
Other 6 13.3 5.1;26.8 42,451 16,278;85,541
Reason why domiciliary care was not provided (n = 17)
Sought care but health service did not reply 8 47.1 23.0;72.2 56,738 27,706;8,717,527 Sought care but health service did not have a professional
available 8 47.1 23.0;72.2 56,738 27,706;8,717,527
Sought care but health service does not provide this type
of care 7 41.2 18.4;67.1 49,631 22,165;8,101,746
Sought care but no appointment available 6 35.3 14.2;61.7 42,523 17,106;7,449,743 No SUS professional available and unable to pay privately 4 23.5 6.8;50.0 28,309 8,191;6,037,069
Sought care but the service was closed 1 5.6 0.1;28.7 6,746 120;3,465,277
Telephone always engaged (n = 17) – – – – –
Other (n = 17) – – – – –
Problem outcome after not receiving care (n = 62)
Got worse 10 16.1 8.0;27.7 70,783 35,172;121,782
Just the same as before 28 45.2 32.5;58.3 198,720 142,885;256,314
h Instituto Brasileiro de Geografia e Estatística. PNAD - Pesquisa Nacional por Amostra de Domicílios - PNAD: acesso e utilização dos serviços de saúde 1998. Rio de Janeiro (RJ); 2000 [cited 2014 Dec 8]. Available from: http://www.ibge.gov.br/home/estatistica/populacao/ trabalhoerendimento/pnad98/saude/saude.pdf
Longitudinality, i.e. service users being accompanied
over time by health professionals, is considered to be
a key characteristic of Primary Health Care. However,
this concept can also be applied to other levels of care,
given that it relates to positive health care results and
can be used to assess its quality.
7,10There is a lack of information about the need for or
indica-tion by health professionals to have follow-up after care,
about the need to have tests and the need to be referred to
another health professional. Despite that, continuity of care
and assessment of the service user’s condition can result in
more accurate diagnosis and more eficacious treatment,
in addition to optimizing referrals to specialists and the
performance of more complex procedures. The same can
be observed regarding the prescription of tests and medica
-tion, especially about the lack of access to some of these
procedures during health care provision.
7Most users stated that the received care was good or very
good in spite of the barriers to continued care. On the
other hand, 30.5% of those receiving care in accident and
emergency units considered it to be regular/poor/very bad
and this was the worst service in the opinion of respond
-ents. This degree of dissatisfaction was higher than that
found by PNADs
in 2008 (13.5%), 2003 (14.0%) and
1998 (2.4%)
e,hfor any kind of care. For satisied users,
satisfaction is associated with service use, i.e., those who
Continuation
Improved a little 11 17.7 9.2;29.5 77,817 40,447;129,696
Improved considerably 10 16.1 8.0;27.7 70,783 35,172;121,782
Cured/Problem solved 3 4.8 1.0;13.5 21,103 4,396;59,352
Barriers to continuity of care Did not receive an explanation as to the reason for seeking
care (n = 537) 444 82.7 79.2;85.8 3,506,293 3,357,900;3,637,725
Received care but not referred to any other service (n = 550) 515 93.6 91.3;95.5 3,968,428 3,870,913;4,048,984 Did not go to some of the referrals (n = 35) 4 11.4 3.2;26.7 30,933 8,683;72,449 Reason why did not go to some of the referrals (n = 4)
Appointment made. but has not happened yet 1 25.0 0.6;80.6 7,733 186;24,932
Unable to get tests on SUS and unable to pay – – – – –
Thought they did not need them 1 25.0 0.6;80.6 7,733 186;24,932
Did not want to 1 25.0 0.6;80.6 7,733 186;24,932
Unable to go and make appointment/Have them 1 25.0 0.6;80.6 7,733 186;24,932
Not available in their city – – – – –
Other 1 25.0 0.6;80.6 7,733 186;24,932
Opinion about care received (n = 548)
Very bad 3 0.6 0.1;1.6 25,439 4,240;67,836
Poor 5 0.9 0.3;2.1 38,158 12,719;89,035
Regular 46 8.4 6.2;11.0 356,141 262,866;466,375
Good 350 63.8 59.7;67.9 2,704,975 2,531,145;2,878,806
Very good 144 26.3 22.6;30.2 1,115,060 958,189;1,280,412
Problem outcome after care was provided (n = 427)
Got worse 1 0.2 0.006;1.3 8,480 254;55,117
Just the same as before 222 52.0 47.1;56.8 2,204,682 1,996,933;2.408,191
Improved a little 52 12.2 9.2;15.7 517,252 390,059;665,644
Improved considerably 99 23.2 19.3;27.5 983,627 818,276;1,165,938
Cured/Problem solved 53 12.4 9.4;15.9 525,732 398,539;674,124
SUS: Brazilian Unified Health System
a Information is partially unknown for some variables. Differing values may therefore appear. b Instituto Brasileiro de Geografia e Estatística. Censo Demográfico, 2010.
have access to services and for whom this experience is
positive, tend to use services more.
13Most individuals
who manage to use health services feel satisied, despite
signiicant inequities.
User satisfaction can be understood based on conceptual
models. It may be limited to a checklist or be observed
from the perspective of the theory of discrepancy,
whereby levels of user satisfaction are predicted from
the difference between expectations and the perception
of the experience the user has. Furthermore, the theory
of embodiment states that satisfaction is the difference
between what is desired and what is obtained.
8People seek emergency service care owing to greater
assurance of access (24h care – “open doors”),
problem-solving and being able to have examinations
and tests then and there.
2,6The degree of user satisfaction, apart from being an
important indicator of health service quality and access,
is also a tool that enables service managers to evaluate
and monitor the health system.
12Problems affected by
barriers to access can be less severe. However, when
comparing this with the answers given by those to
whom care was provided, no signiicant differences
were found.
In a context of high prevalence of chronic diseases
among adults, most of them seek care in order to cope
with their health problems rather than to cure them.
Therefore, regular contact with a health service provider
can inluence behavioural change and better treatment
adherence, aim of staying healthy and having better
quality of life.
4,iThere are few studies describing and quantifying barriers
to accessing health care and its continuity. This study
analyzed when respondents last received health care,
which varied between three months and one year. These
periods were used to minimize bias in the respondents’
recollections of what happened.
3Other positive features
are the low percentage of subjects lost to the study in
relation to the estimated sample size, sample size and
comprehensiveness, and its being nationally representa
-tive, as well as its use of primary data.
The low proportion of individuals without access to
health services and care hampered the precision of the
analysis. Stratiied or adjusted analysis could help to
understand the most affected social groups. It can also
contribute to the adoption of measures and policies to
reduce inequalities, in addition to increasing the efi
-ciency of the health system and scaling up access to
services and their quality. Despite the low prevalence
rates found, when these proportions are projected and
applied to the entire Brazilian adult population living in
urban areas, many individuals do not access the health
system or have continued health care.
The importance of the access and continuity of health
services is increasing in national and international liter
-ature. Most studies deines service use as a synonym of
access and do not investigate adequately lack of access
and continuity of care.
Quantifying lack of access and continuity of health
actions and service supply throughout the national terri
-tory helps its magnitude to be recognized, assisting in
the deinition of strategies for controlling them in the
health system.
i Macinko J, Dourado I, Guanais FC. Doenças crônicas, atenção primária e desempenho dos sistemas de saúde: diagnósticos, instrumentos e intervenções. Washington (DC): Banco Interamericano de Desenvolvimento; 2011 [cited 2015 Feb 13]. (Textos para Debate). Available from: http://apsredes.org/site2012/wp-content/uploads/2012/06/Publica%C3%A7%C3%A3o-BID.pdf
1. Andersen RM, Yu H, Wyn R, Davidson PL, Brown ER, Teleki S. Access to medical care for low-income persons: how do communities make a difference? Med Care Res Rev. 2002;59(4):384-411. DOI:10.1177/107755802237808
2. Aranaz Andrés JM, Martínez Nogueras R, Gea Velázques de Castro MT, Teresa M, Rodrigo Bartual V, Antón García P, Gómez Pajares F. ¿Por qué los pacientes utilizan los servicios de urgencias hospitalarios por iniciativa propia? Gac Sanit. 2006;20(4):311-5.
3. Bastos GAN, Santos IS, Costa JSD, Capilheira MF. Uso de serviços ambulatoriais nos últimos 15 anos: comparação de dois estudos de base populacional. Rev Bras Epidemiol. 2011;14(4):620-32. DOI:10.1590/S1415-790X2011000400009
4. Campos MO, Rodrigues Neto JF. Doenças crônicas não transmissíveis: fatores de risco e repercussão na qualidade de vida. Rev Baiana Saude Publica. 2009;33(4):561-81. 5. Carret MLV, Fassa ACG, Domingues MR. Inappropriate use
of emergency services: a systematic review of prevalence and associated factors. Cad Saude Publica. 2009;25(1):7-28. DOI:10.1590/S0102-311X2009000100002
6. Carret MLV, Fassa AG, Paniz VMV, Soares PC. Características da demanda do serviço de saúde de emergência no Sul do Brasil. Cienc Saude Coletiva. 2011;16(Supl 1):1069-79. DOI:10.1590/S1413-81232011000700039
7. Cunha EM, Giovanella L. Longitudinalidade/ continuidade do cuidado: identificando dimensões e variáveis para a avaliação da Atenção Primária no contexto do sistema público de saúde brasileiro.
Cienc Saude Coletiva. 2011;16(Supl 1):1029-42. DOI:10.1590/S1413-81232011000700036
Research supported by the Brazilian Ministry of Health (Process 23110.010118/2007-89).
Basead on the doctoral thesis of Alitéia Santiago Dilélio, titled: “Acesso e Utilização da Assistência Médica Ambulatorial ao Adulto na Rede de Serviços de Saúde do Brasil”, presented to the Graduate Program in Epidemiologyof Universidade Federal de Pelotas, in 2014.
The authors declare no conflict of interest.
8. Esperidião MA; Trad LA Bonfim. Avaliação de satisfação de usuários: considerações teórico-conceituais.
Cad Saude Publica. 2006;22(6):1267-76. DOI:10.1590/S0102-311X2006000600016
9. Facchini LA, Piccini RX, Tomasi E, Thumé E, Teixeira VA, Silveira DS, et al. Avaliação de efetividade da Atenção Básica à Saúde em municípios das regiões Sul e Nordeste do Brasil: contribuições metodológicas. Cad Saude Publica. 2008;24(Supl 1)):s159-72. DOI:10.1590/S0102-311X2008001300020
10. Haggerty JL, Reid RJ, Freeman GK, Starfield BH, Adair CE, McKendry R. Continuity of care: a multidisciplinary review. BMJ. 2003;327(7425):1219-21.
DOI:10.1136/bmj.327.7425.1219
11. Hill AP, Freeman GK. Promoting continuity of care in general practice (UK). London: Royal College of General Practitioners; 2011.
12. Massote AW, Lima AMD, Van Stralen CJ, Álvares J, Fleury-Teixeira P, Belisário SA, et al. A contribuição de estudos de percepção da população usuária na avaliação da atenção básica. In: Hartz ZMA, Felisberto E, Silva LMV, organizadores. Meta-avaliação da atenção básica à saúde: teoria e prática. Rio de Janeiro: Editora Fiocruz; 2008. p. 410. 13. Mendoza-Sassi R, Béria JU. Utilización de los servicios
de salud: una revisión sistemática sobre los factores relacionados. Cad Saude Publica. 2001;17(4):819-32. DOI:10.1590/S0102-311X2001000400016
14. Novaes HMD. Epidemiologia e avaliação em serviços de atenção médica: novas tendências na pesquisa. Cad Saude Publica. 1996;12(Supl 2):S7-12. DOI:10.1590/S0102-311X1996000600002
15. Paim J, Travassos C, Almeida C, Bahia L, Macinko J. The Brazilian health system: history, advances, and challenges. Lancet. 2011;377(9779):1778-97. DOI:10.1016/S0140-6736(11)60054-8
16. Pereira MG. Serviços de saúde. In: Pereira MG. Epidemiologia: teoria e prática. 6.ed. Rio de Janeiro: Guanabara Koogan; 2001. p.513-37.
17. Szwarcwald CL, Damacena GN. Amostras complexas em inquéritos populacionais: planejamento e implicações na análise estatística dos dados.
Rev Bras Epidemiol. 2008;11(Supl 1):38-45. DOI:10.1590/S1415-790X2008000500004 18. Travassos C, Castro MSM. Determinantes e
desigualdades sociais no acesso e na utilização de serviços de saúde. In: Giovanella L, Escorel S, Lobato LVC, Noronha JC, Carvalho AI, organizadores. Políticas e sistema de saúde no Brasil. Rio de Janeiro: Editora Fiocruz; 2008. p.215-46.
19. Travassos C, Martins M. Uma revisão sobre os conceitos de acesso e utilização de serviços de saúde. Cad Saude Publica. 2004;20(Supl 2):S190-8. DOI:10.1590/S0102-311X2004000800014
20. Travassos C, Oliveira EXG, Viacava F. Desigualdades geográficas e sociais no acesso aos serviços de saúde no Brasil: 1998 e 2003.
Cienc Saude Coletiva. 2006;11(4):975-86. DOI:10.1590/S1413-81232006000400019
21. Turci MA, Lima-Costa MF, Proietti FA, Cesar CC, Macinko J. Intraurban differences in the use of ambulatory health services in a large Brazilian city. J Urban Health. 2010;87(6):994-1006. DOI:10.1007/s11524-010-9499-4
22. Vázquez ML, Silva MRF, Campos ES, Arruda IKG, Diniz AS, Veras IL, et al. Participação social nos serviços de saúde: concepções dos usuários e líderes comunitários em dois municípios do Nordeste do Brasil.
Cad Saude Publica. 2003;19(2):579-91. DOI:10.1590/S0102-311X2003000200025